. 2021 Dec 7;12(1):7113.
doi: 10.1038/s41467-021-27398-y.

Spatial-proteomics reveals phospho-signaling dynamics at subcellular resolution

Affiliations

Spatial-proteomics reveals phospho-signaling dynamics at subcellular resolution

Ana Martinez-Val et al. Nat Commun. .

Abstract

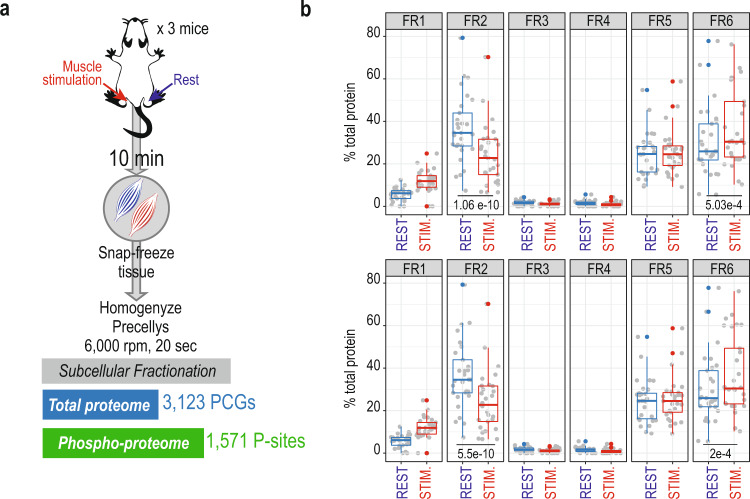
Dynamic change in subcellular localization of signaling proteins is a general concept that eukaryotic cells evolved for eliciting a coordinated response to stimuli. Mass spectrometry-based proteomics in combination with subcellular fractionation can provide comprehensive maps of spatio-temporal regulation of protein networks in cells, but involves laborious workflows that does not cover the phospho-proteome level. Here we present a high-throughput workflow based on sequential cell fractionation to profile the global proteome and phospho-proteome dynamics across six distinct subcellular fractions. We benchmark the workflow by studying spatio-temporal EGFR phospho-signaling dynamics in vitro in HeLa cells and in vivo in mouse tissues. Finally, we investigate the spatio-temporal stress signaling, revealing cellular relocation of ribosomal proteins in response to hypertonicity and muscle contraction. Proteomics data generated in this study can be explored through https://SpatialProteoDynamics.github.io .


Conflict of interest statement

D.B.B.-J. is employee at Evosep Biosystems. All other authors declare no competing interests.

Figures

Fig. 1
Fig. 1. High-throughput and reproducible subcellular fractionation.
a Experimental workflow for subcellular fractionation and LC-MS/MS data acquisition. SPD: Samples Per Day, CV Compensation Voltage. b Transmission Electron Microscopy images from the different fractionation steps. 1: HeLa cells after trypsinization from cell culture plates. 2: HeLa cells after incubation with buffer 1 containing digitonin. 3: pellet obtained from previous step after incubation with buffer 2 containing 140 mM of NaCl. 4: pellet obtained from previous step after incubation with buffer 3 containing 0.05% Tween-20. 5: pellet obtained from previous step after incubation with buffer 4 containing 1% DDM. 6: pellet obtained from previous step after incubation with buffer 5 containing 500 mM NaCl and benzonase. Yellow arrows point to mitochondria, blue arrows point to Golgi apparatus, red arrows point to nuclear membranes and dashed red lines indicate nucleoli. Six HeLa samples were prepared in parallel for TEM acquisition, one for each subcellular fractionation step and posterior TEM imaging.
Fig. 2
Fig. 2. Overview of subcellular fractionation resolution and subcellular compartment enrichment.
a Bar-plot summary of the identified proteins in HeLa samples as average of 4 replicates per fraction (light blue bar) and quantified proteins in at least 3 replicates (dark blue). Height of the bars represents the mean number of identifications of n = 4 experimental replicates, and error bars represent the standard deviation in identification numbers between replicates. b Bar-plot summary of the identified phosphorylation sites in HeLa samples as average of 4 replicates per fraction (light green) and quantified phosphorylation sites in at least 3 replicates (dark green). Height of the bars represents the mean number of identifications of n = 4 experimental replicates, and error bars represent the standard deviation in identification numbers between replicates. c Heatmap of scaled intensities per replicate, of four replicates, of the subcellular proteome of HeLa, showing both protein and sample clustering. d Heatmap of scaled intensities per replicate, of four replicates, of the subcellular phospho-proteome of HeLa, showing both phospho-site and sample clustering. e t-SNE plots of log2 transformed intensities of proteins identified in the subcellular fractionation of HeLa (n = 4). TOP: The clusters assigned for each fraction in Fig. 2c are used to color-code it. BOTTOM: Markers of different organelles are highlighted in the t-SNE plot. f Profile-plots of cell compartment markers in the subcellular proteome HeLa dataset. Scaled intensity across fractions is plotted for each independent replicate. Gradient of white to blue indicates Pearson correlation to the centroid of each distribution, which is highlighted as a yellow line. “N” specifies the number of protein markers used to make the profile plots, but the plots show that number of markers for each one of the 4 replicates used experimentally. Source Data for Figs. 2a and b are provided as a Source Data file.
Fig. 3
Fig. 3. Comparative analysis of subcellular fractionation protocols based on chemical reagents using Metamass.
ab Heatmaps showing protein distribution across fractions obtained from HeLa and U2OS using the present subcellular fractionation protocol and KM12 using the commercial kit (Pierce) employed in Mendes et al.. Proteins were classified and sorted using the Excel-based analysis tool MetaMass (Supplementary Data 4). In (a) proteins are clustered based on the data from HeLa and U2OS fractionation in the present study. In (b) proteins are clustered based on Mendes et al data. Heatmaps were obtained after normalizing gene distribution and center samples by mean in Cluster 3.0, and plotted in TreeView. CE Cytoplasmic Extract, ME Membrane Extract, NE Nuclear Extract, CB Chromatin-Bound, PE Pellet Extract, ER Endoplasmic Reticulum. c F-score barplot for the protein assignment to organelles in the present study (blue) and in Mendes et al (yellow).
Fig. 4
Fig. 4. Spatio-temporal phosphoproteomics in response to EGF stimulation.
a Experimental design and result overview with number of proteins and phosphorylation-sites (p-sites) obtained from the subcellular fractionation of HeLa cells treated with EGF at different time points. PCGs: Protein Coding Genes. b Translocation plots of EGF treated samples at 2, 8, 20, and 90 min versus control. Red dashed lines indicate the cutoff threshold used for mobility score and significance levels. The color of the dots indicate which compartments the proteins are moving to and from. Compartment are grouped as three: cytosol (FR1 and FR2), membrane-bound organelles (FR3 and FR4) and nuclear compartment (FR5 and FR6). Red: nuclear compartment to/from membrane-bound organelles. Green: cytosol to/from membrane-bound organelles. Blue: nuclear compartment to/from cytosol. Grey: proteins moving within same compartment. GRB2, SHC1 and CBL are highlighted in green. c Stacked bar-plot of scaled protein intensities across fractions and time points of EGFR and adaptor proteins CBL, SHC1, and GRB2. d Bar-plot of intensities across fractions and time points of EGFR tyrosine phosphorylation sites. A cross represents each independent measurement. Height of the bars represents the mean intensity of n = 4 measurements of the protein, and error bars represent the standard error of the mean. e Bar-plot of intensities phosphorylation sites across fractions and time points of SHC1 and JUN. A cross represents each independent measurement. Height of the bars represents the mean intensity of n = 4 measurements of the protein, and error bars represent the standard error of the mean. Source Data for Figs. 4c, d, and e are provided as a Source Data file.
Fig. 5
Fig. 5. In vivo subcellular fractionation and spatio-temporal signaling in response to EGF stimulation.
a Experimental design and workflow of subcellular fractionation proteome and phospho-proteome analysis of EGF treatment in mice and a summary of identified proteins and phosphorylation sites in liver and kidney respectively. b Heatmap of scaled intensities per replicate, of four replicates, of the subcellular proteome of mouse liver (green) and kidney (pink), showing both protein and sample clustering. c Transmission electron microscopy images of Liver (top) and Kidney (bottom) tissues after homogenization and incubation with subcellular fractionation buffer 1 containing digitonin. Blue arrows signal the Golgi apparatus, red arrows signal the mitochondrion and black arrows signal the nucleus. Sample preparation was performed in technical duplicates derived from the same organ; an aliquot at each subcellular step was pooled for TEM imaging. d Profile-plots of cell compartment markers in the subcellular proteome HeLa, Kidney, and Liver datasets. Scaled intensity across fractions is plotted for each independent replicate. Gradient of color indicates Pearson correlation to the centroid of each distribution, which is highlighted as a yellow/black line. Next to the plot, the Pearson correlation coefficients calculated between samples of the centroids of each cell compartment are indicated. e Bar-plot of protein intensities and phosphorylation sites across fractions and time points of EGFR in HeLa and Liver. Height of the bars represents the mean protein intensity of n = 4 experimental replicates, and error bars represent the standard error of the mean. f Bar-plot of protein intensities across fractions in the HeLa subcellular fractionation datasets corresponding to markers of early, late, and recycling endosomes. Height of the bars represents the mean protein intensity of n = 4 experimental replicates, and error bars represent the standard error of the mean. Source Data for Figs. 5e and 5f are provided as a Source Data file.
Fig. 6
Fig. 6. Subcellular protein dynamics during hyperosmotic shock.
a Experimental design and result overview of subcellular fractionation of U2OS cells upon osmotic shock with sorbitol and posterior release. b Line-plot reflecting the percentage of total ribosomal protein (separately for 40S and 60S subunits) in each subcellular fraction at each given time point. Statistical significance of the change between control and 1 h treated samples is indicated by the calculated p value (paired two-sample t-test). Source Data is provided as a Source Data file. c MAP3K20 phosphorylation sites regulation across time points. Intensity is depicted as log2 fold-change. Asterisks indicate statistical significance (moderated t test, BH FDR q value <0.05). d Heatmap of protein and phosphorylation site z-score intensities of ribosome assembly factors. Full-proteome intensity is only shown for initial/control conditions. e Representative images of co-localization immunofluorescence analysis of ribosomal proteins and fibrillarin in TIG3 cells expressing mKeima-tagged RPL10A, RPL22 untreated and treated with 500 mM sorbitol for 3 h. Immunostaining was performed once in two different cells (mKeima-tagged RPL10A and RPL22). f Northern blots of whole-cell RNA from biological replicates of U2OS cells treated with and without 500 mM sorbitol (N = 3), probed with probe a targeting ITS1 (left) and probe b targeting ITS2 (right). Black arrows indicate rRNA processing intermediates (see Supplementary Fig. 11a for a processing scheme) and gray arrows mark the migration of mature rRNA species. Internal RNAs (18S, 5.8S, and 28S rRNA) are employed as molecular size markers. Source Data is provided as a Source Data file.
Fig. 7
Fig. 7. Muscle contraction in mice recapitulates ribosomal translocation.
a Experimental design and workflow of subcellular fractionation proteome and phospho-proteome analysis of muscle contraction in mice. b Boxplot of percentage of total ribosomal protein (top: N = 29 40S subunits, bottom: N = 37 60S subunits) across fractions in resting conditions (blue, N = 3 biological replicates) and after muscle contraction (red, N = 3 biological replicates). Statistical significance is calculated from a two-sided paired t-test from each subset of proteins (40S or 60S), which values were derived from 3 biological replicates in resting against stimulated mice. P-values are indicated in the figure. Boxplots show medians and limits indicate the 25th and 75th percentiles, whiskers extend 1.5 times the interquartile range from the 25th and 75th percentiles, outliers are represented by dots. Source Data is provided as a Source Data file.

References

    1. Liu Y, Beyer A, Aebersold R. On the Dependency of Cellular Protein Levels on mRNA Abundance. Cell. 2016;165:535–550. - PubMed
    1. Kim W, et al. Systematic and quantitative assessment of the ubiquitin-modified proteome. Mol. Cell. 2011;44:325–340. - PMC - PubMed
    1. Sharan R, Ulitsky I, Shamir R. Network-based prediction of protein function. Mol. Syst. Biol. 2007;3:88. - PMC - PubMed
    1. Gallic Lle, et al. Transcriptional Repressor ERF Is a Ras/Mitogen-Activated Protein Kinase Target That Regulates Cellular Proliferation. Mol. Cell. Biol. 1999;19:4121–4133. - PMC - PubMed
    1. Francavilla C, et al. Multilayered proteomics reveals molecular switches dictating ligand-dependent EGFR trafficking. Nat. Struct. Mol. Biol. 2016;23:608–618. - PubMed

Publication types

LinkOut - more resources