. 2021 Dec 7;12(1):7104.
doi: 10.1038/s41467-021-27326-0.

Biological heterogeneity in idiopathic pulmonary arterial hypertension identified through unsupervised transcriptomic profiling of whole blood

Collaborators, Affiliations

Biological heterogeneity in idiopathic pulmonary arterial hypertension identified through unsupervised transcriptomic profiling of whole blood

Sokratis Kariotis et al. Nat Commun. .

Erratum in

Abstract

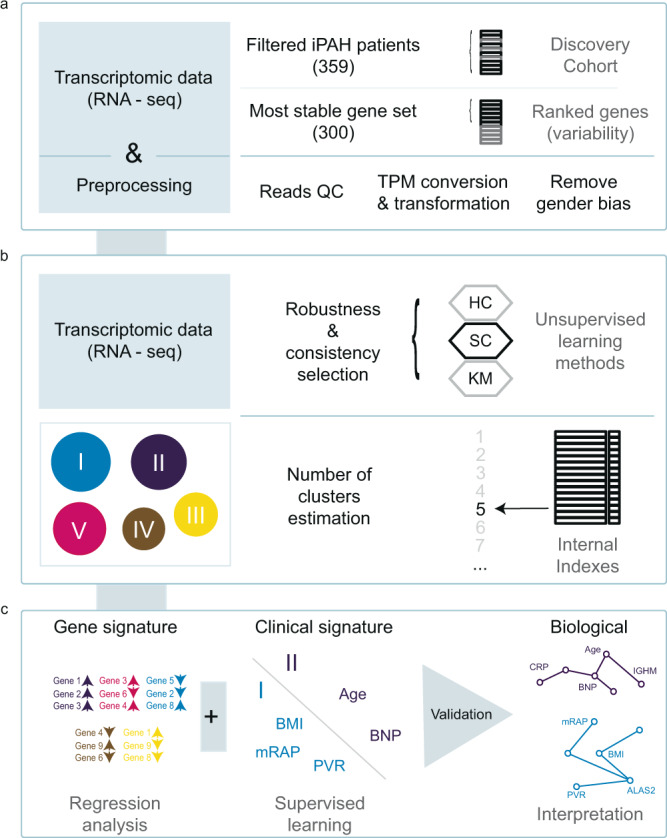
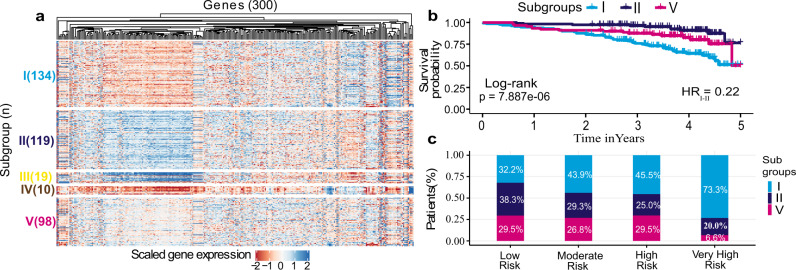
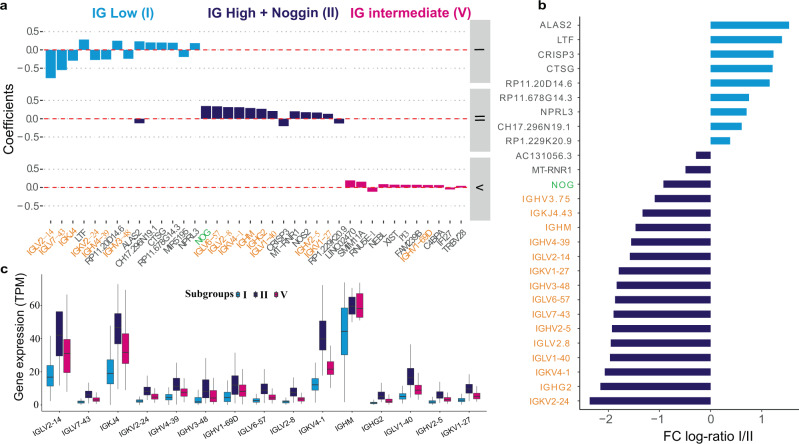
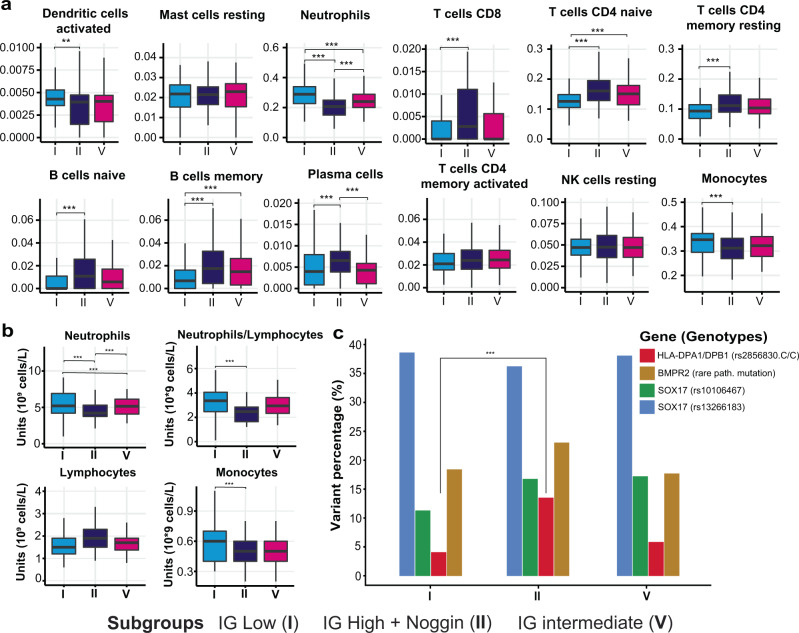
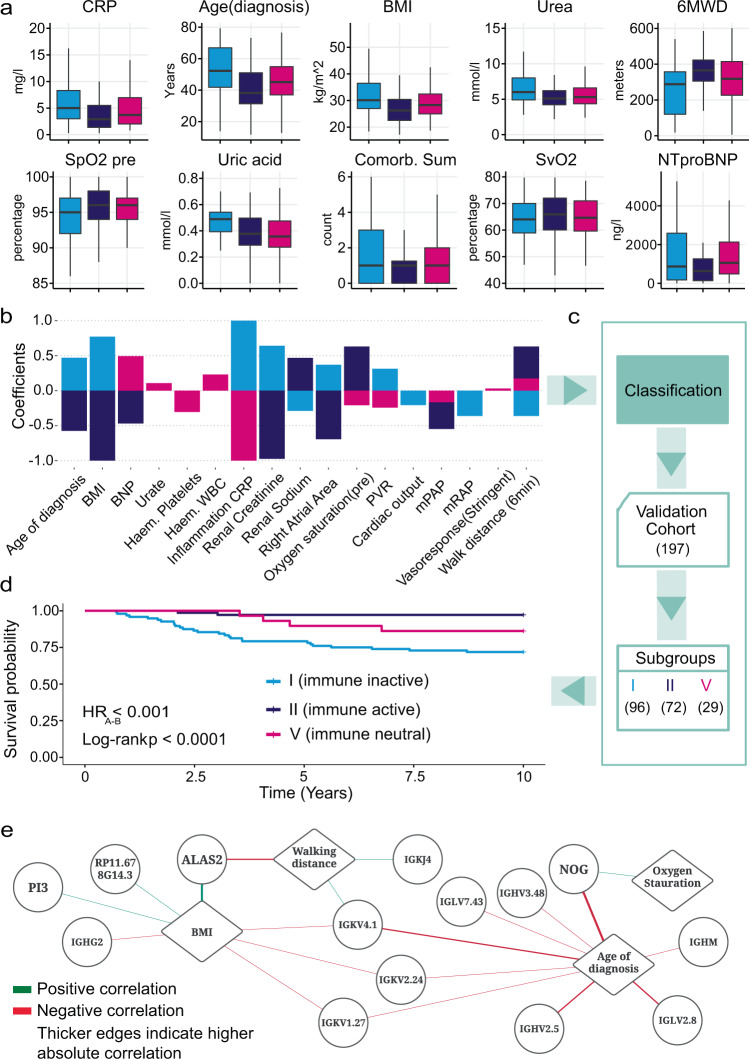
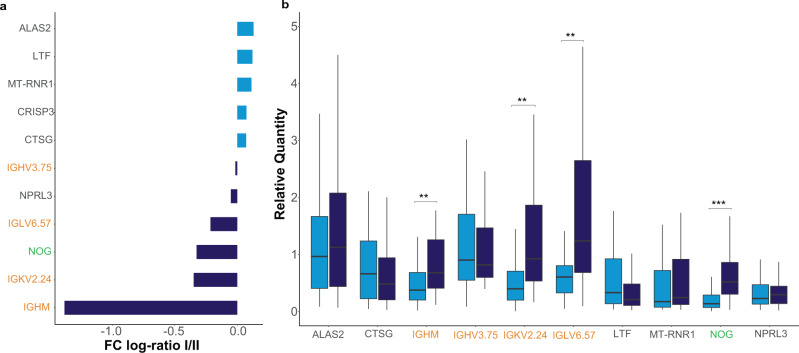
Idiopathic pulmonary arterial hypertension (IPAH) is a rare but fatal disease diagnosed by right heart catheterisation and the exclusion of other forms of pulmonary arterial hypertension, producing a heterogeneous population with varied treatment response. Here we show unsupervised machine learning identification of three major patient subgroups that account for 92% of the cohort, each with unique whole blood transcriptomic and clinical feature signatures. These subgroups are associated with poor, moderate, and good prognosis. The poor prognosis subgroup is associated with upregulation of the ALAS2 and downregulation of several immunoglobulin genes, while the good prognosis subgroup is defined by upregulation of the bone morphogenetic protein signalling regulator NOG, and the C/C variant of HLA-DPA1/DPB1 (independently associated with survival). These findings independently validated provide evidence for the existence of 3 major subgroups (endophenotypes) within the IPAH classification, could improve risk stratification and provide molecular insights into the pathogenesis of IPAH.


Conflict of interest statement

The authors declare no competing interests.

Figures

Fig. 1
Fig. 1. Overview of IPAH subgroup identification methodology.
a A cohort of 359 IPAH patients and a set of 300 genes are selected for clustering based on RNA data quality and variability of expression across samples. b Spectral clustering of patients using expression values (TPM) was benchmarked against hierarchical clustering (HC) and k-means clustering (KM), and the optimal number of IPAH subgroups was selected based on internal indexes. c Associated gene expression and clinical features were identified and validated in independent cohorts.
Fig. 2
Fig. 2. Gene expression profiles, survival and risk categories that demonstrate five distinct subgroups.
a The expression heatmap for the five discovered subgroups showing distinct expression profiles. b Kaplan–Meier survival curves for the three predominant subgroups demonstrating the difference in survival profiles (from RNA sampling) for a span of 5 years along with two-sided log-rank test p values. c The percentage of predominant subgroups I, II and V patients across REVEAL risk categories. High- and very-high-risk populations mostly consist of subgroup I patients (45.5% and 73.3%, respectively), while the low-risk population is mostly composed of subgroup II (38.3%) and V (29.5%) patients. Fisher’s exact test showed a statistically significant difference (two-sided p value = 0.024) between subgroups I and II for low- and very-high-risk categories.
Fig. 3
Fig. 3. Genes associated with subgroups I (low survival), II (high survival) and V (intermediate survival).
a Genes with the highest 5% of LASSO coefficients across subgroups I, II and V. b Average expression fold change (log2 scaled) of the signature genes between subgroup I and II, with significance notations. Genes over-expressed in subgroup I are denoted by light blue bars while genes primarily expressed in subgroup II are represented by dark blue bars. c Expression level of immunoglobulin genes selected by LASSO across the three predominant subgroups with medians shown. Subgroups I (n = 134), V (n = 98) and II (n = 119) can be defined as having low, intermediate and high immunoglobulin characteristics. Vertical centre line represents the median, top and bottom bounds of the box represent the first and third quartile, while the tips of the whiskers represent min and max values.
Fig. 4
Fig. 4. Immunity cell composition across PAH transcriptomic subgroups.
a CIBERSORT estimation of relative cell abundance in patients of subgroups I (n = 129), II (n = 112) and V (n = 89) using two-sided test and Bonferroni adjusted mean difference significance notation with p values: pI-II(Dendritic cells activated) = 0.011, pI-II(Neutrophils) = 4.4 × 10−11, pI-V(Neutrophils) = 2.0 × 103, pII-V(Neutrophils) = 1.7 × 103, pI-II(T cells CD8) = 4.8 × 10−5, pI-II(T cells CD4 naive) = 1.9 × 10−8, pI-V(T cells CD4 naive) =  3.8 × 10−3, pI-II(T cells CD4 memory resting) = 2.3 × 10−5, pI-II(B cells naive) = 2 × 10−5, pI-II(B cells memory) = 2.5 × 10−6, pI-V(B cells memory) = 3.9 × 10−3, pI-II(Plasma cells) = 6.4 × 10−4, pII-V(Plasma cells) = 6.5 × 10−5 and pI-II(Monocytes) = 0.0053. Vertical centre line represents the median, top and bottom bounds of the box represent the first and third quartile, while the tips of the whiskers represent min and max values. b Whole-blood cell counts across subgroups I (n = 129), II (n = 112) and V (n = 89) using two-sided test and Bonferroni adjusted mean difference significance notation. pI-II (Neutrophils) = 7.2 × 10−12, pI-V (Neutrophils) = 8.0 × 10−4, pII-V (Neutrophils) = 4.4 × 10−4, pI-II (Neutrophils/Lymphocytes) = 0.0061 and pI-II (monocytes) = 0.0076. Vertical centre line represents the median, top and bottom bounds of the box represent the first and third quartile, while the tips of the whiskers represent min and max values. c Proportion of patients in each subgroup with DNA variants in HLA-DPA1/DPB1 (rs2856830), SOX17 (rs10106467 and rs13266183, homozygous and heterozygous), BMPR2 (rare pathogenic variant). Notably, pI-II (HLA-DPA1/DPB1) = 0.009. Generated using a two-sample test for equality of proportions with continuity correction. *P value ≤ 0.05, **p value ≤ 0.01, ***p value ≤ 0.001.
Fig. 5
Fig. 5. Clinical variables descriptive of RNA subgroups and used for classification of new patients.
a Comparison of clinical variables deemed most important from our univariate feature selection model across subgroups I (n = 129), II (n = 112) and V (n = 89). Vertical centre line represents the median, top and bottom bounds of the box represent the first and third quartile, while the tips of the whiskers represent min and max values. b Clinical variables selected by ensemble feature selection from models predictive of each subgroup. Coefficients shown for each variable are from the most predictive support vector machine classifiers. c Selected clinical features are used to classify 197 IPAH patients from an independent validation cohort. d Kaplan–Meier survival curves per predicted subgroup in the validation cohort confirming the difference in survival outcomes between subgroups along with log-rank test p values. e Gene and clinical variable correlation network. Diamond nodes represent clinical variables drawn from the clinical signatures. Round nodes represent genes drawn from the gene signature generated by our LASSO model. Edges denoted Spearman rank correlation and have been thresholded to 0.25 and two-tailed test p value < 1.11 × 10−5. Specifically, corrBMI-ALAS2 = 1.27 × 10−11, corrBMI-PI3 = 3.17 × 10−6, corrBMI-IGHG2 = 4.13 × 10−6, corrBMI-RP11.678G14.3 = 8.22 × 10−6, corrBMI-IGKV1.27 = 9.32 × 10−6, corrBMI-IGKV2.24 = 3.09 × 10−6, corrBMI-IGKV4.1 = 9.55 × 10−7, corr6MWD-IGKV4.1 = 2.83 × 10−6, corr6MWD-IGKJ4 = 2.08 × 10−6, corr6MWD-ALAS2 = 7.52 × 10−10, corrAoD-IGHV2.5 = 3.72 × 10−10, corrAoD-IGLV2.8 = 1.06 × 10−9, corrAoD-IGHM = 6.2 × 10−8, corrAoD-NOG = 3.18 × 10−17, corrAoD-IGHV3.48 = 7.7 × 10−7, corrAoD-IGLV7.43 = 1.04 × 10−6, corrAoD-IGKV4.1 = 6.35 × 10−10, corrAoD-IGKV2.24 = 4.19 × 10−6, corrAoD-IGKV1.27 = 3.93 × 10−7, corrOxygenSat-NOG = 1.11 × 10−6.
Fig. 6
Fig. 6. Genes of interest with data based on our qPCR results of 91 patients (I = 53, II = 38) of the validation cohort.
a Mean expression fold change (log2 scaled) of the signature genes between validation subgroup I (immune inactive) and II (immune active). The fold ratio was generated based on negative delta Ct values (vs GAPDH). Genes over-expressed in subgroup I are denoted by light blue bars while genes primarily expressed in subgroup II are represented by dark blue bars. b The relative quantity (RQ) of each gene of interest relative to GAPDH using a two-sided t-test with medians and significant differences shown with pI-II (IGHM) = 8.256 × 10−3, pI-II (IGKV2.24) = 2.373 × 10−3, pI-II (IGLV6.57) = 5.908 × 10−3 and pI-II (NOG) = 1.233733 × 10−4. **p < 0.01, ***p < 0.001. Vertical centre line represents the median, top and bottom bounds of the box represent the first and third quartile, while the tips of the whiskers represent min and max values.

References

    1. Galiè, N. et al. Risk stratification and medical therapy of pulmonary arterial hypertension. Eur. Respir. J. 53, 1801889 (2019). - PMC - PubMed
    1. Hurdman J, et al. ASPIRE registry: assessing the spectrum of pulmonary hypertension identified at a REferral centre. Eur. Respir. J. 2012;39:945–955. doi: 10.1183/09031936.00078411. - DOI - PubMed
    1. Ling Y, et al. Changing demographics, epidemiology, and survival of incident pulmonary arterial hypertension: results from the pulmonary hypertension registry of the United Kingdom and Ireland. Am. J. Respir. Crit. Care Med. 2012;186:790–796. doi: 10.1164/rccm.201203-0383OC. - DOI - PubMed
    1. Benza RL, et al. Predicting survival in patients with pulmonary arterial hypertension: the REVEAL Risk Score Calculator 2.0 and comparison with ESC/ERS-based risk assessment strategies. Chest. 2019;156:323–337. doi: 10.1016/j.chest.2019.02.004. - DOI - PubMed
    1. Bergemann R, et al. High levels of healthcare utilization prior to diagnosis in idiopathic pulmonary arterial hypertension support the feasibility of an early diagnosis algorithm: the SPHInX project. Pulm. Circ. 2018;8:2045894018798613. doi: 10.1177/2045894018798613. - DOI - PMC - PubMed

Publication types

MeSH terms