. 2021 Dec 7;12(1):7107.
doi: 10.1038/s41467-021-27386-2.

Thawing Yedoma permafrost is a neglected nitrous oxide source

Affiliations

Thawing Yedoma permafrost is a neglected nitrous oxide source

M E Marushchak et al. Nat Commun. .

Abstract

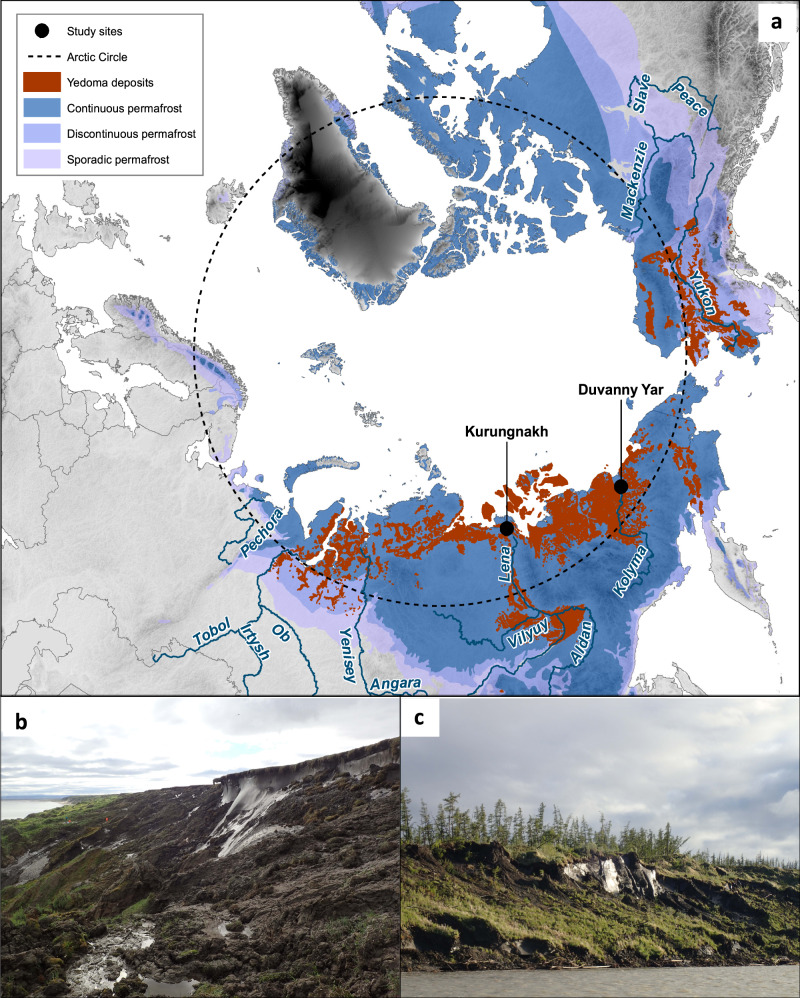
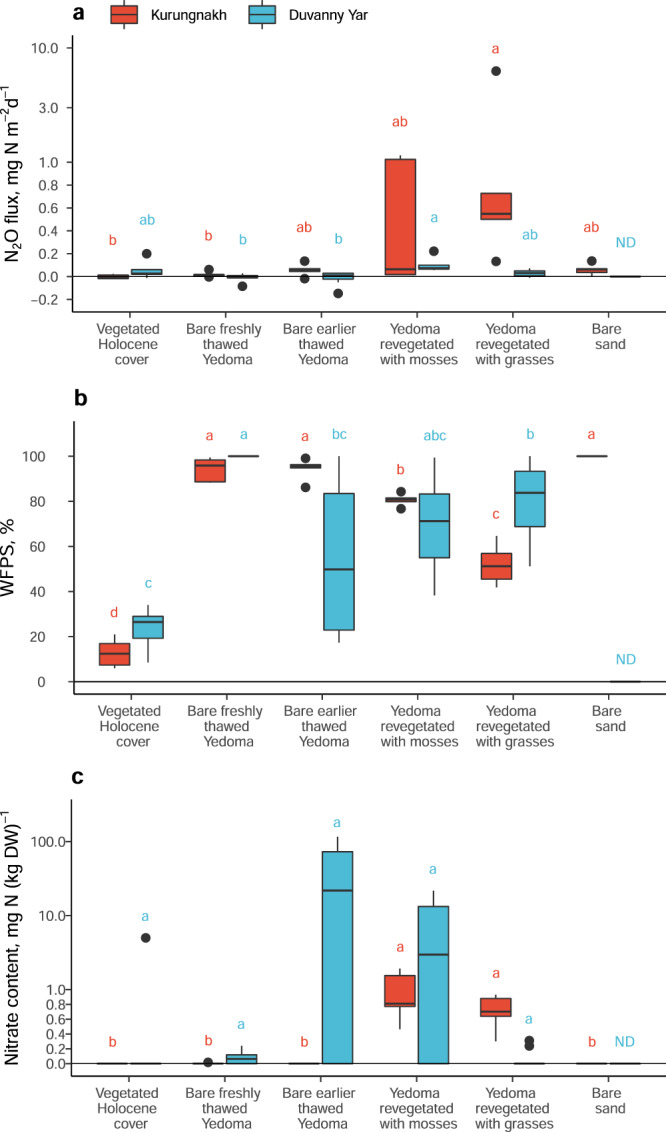
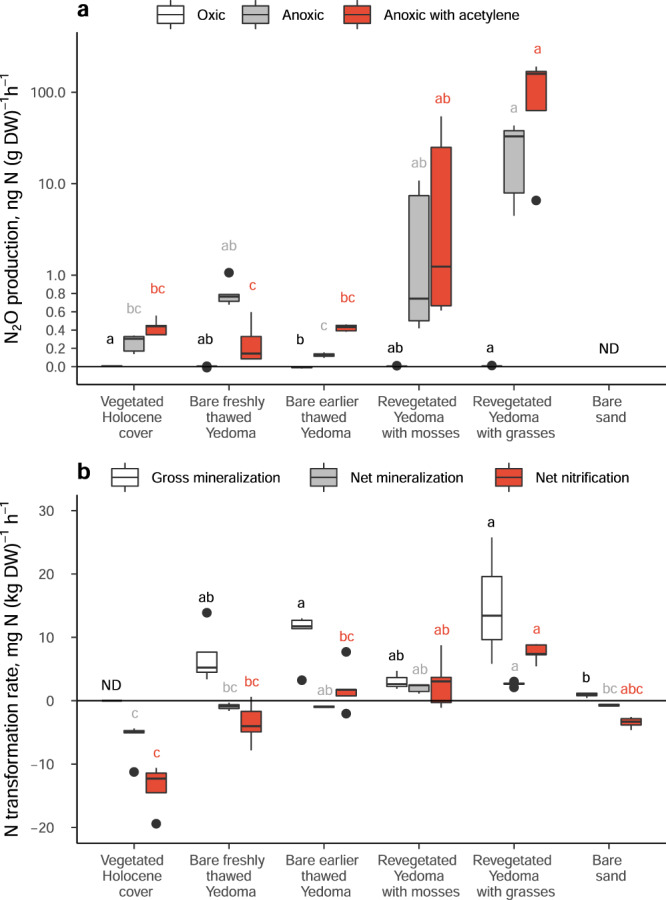
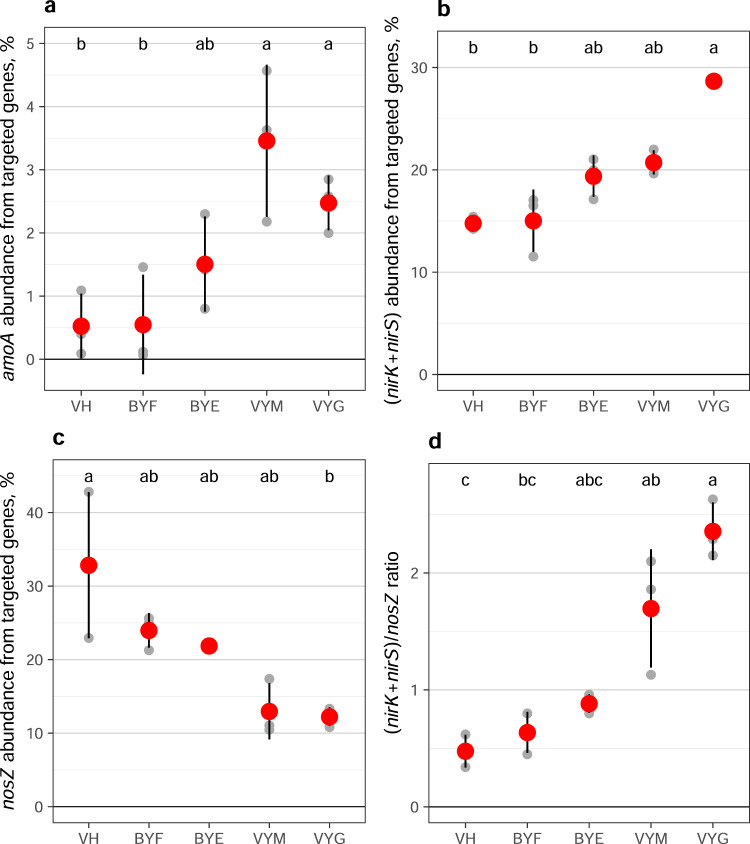
In contrast to the well-recognized permafrost carbon (C) feedback to climate change, the fate of permafrost nitrogen (N) after thaw is poorly understood. According to mounting evidence, part of the N liberated from permafrost may be released to the atmosphere as the strong greenhouse gas (GHG) nitrous oxide (N2O). Here, we report post-thaw N2O release from late Pleistocene permafrost deposits called Yedoma, which store a substantial part of permafrost C and N and are highly vulnerable to thaw. While freshly thawed, unvegetated Yedoma in disturbed areas emit little N2O, emissions increase within few years after stabilization, drying and revegetation with grasses to high rates (548 (133-6286) μg N m-2 day-1; median with (range)), exceeding by 1-2 orders of magnitude the typical rates from permafrost-affected soils. Using targeted metagenomics of key N cycling genes, we link the increase in in situ N2O emissions with structural changes of the microbial community responsible for N cycling. Our results highlight the importance of extra N availability from thawing Yedoma permafrost, causing a positive climate feedback from the Arctic in the form of N2O emissions.


Conflict of interest statement

The author declares no competing interests.

Figures

Fig. 1
Fig. 1. Overview of the studied Yedoma exposures.
a Location of the study sites, overlain on the map showing the extent of Yedoma deposits on the Northern Hemisphere and the permafrost zonation. b Kurungnakh exposure. c Duvanny Yar exposure. Photos b and c by J. Kerttula.
Fig. 2
Fig. 2. Nitrous oxide fluxes and nitrate content at the Kurungnakh and Duvanny Yar exposures.
a In situ N2O fluxes measured with the chamber technique. b Soil moisture expressed as water-filled pore space. c Extractable nitrate content. See Supplementary Table 2 for extractable ammonium content. Box plots show lower and upper quartiles, median (thick black line), smallest and largest values without outliers (thin black line) and outliers (circles); n = 5 biologically independent samples, except for ‘Bare earlier thawed Yedoma’ and ‘Yedoma revegetated with grasses’ in Duvanny Yar, where n = 10. Lower case letters indicate significant differences between studied soils, tested separately for each study site (Kruskal-Wallis test with pairwise comparisons with Dunn’s test; p < 0.05). For N2O fluxes in a, positive values indicate emissions, and negative values indicate uptake. Note the logarithmic scale on y-axes in a and c. WFPS water-filled pore space, DW dry weight, ND Not determined.
Fig. 3
Fig. 3. Nitrous oxide production and nitrogen transformation rates in Kurungnakh soils.
a Nitrous oxide production with different headspace conditions. Acetylene inhibits the last step of denitrification, N2O reduction to N2, and can be used to estimate the total denitrification rate. b Nitrogen transformation rates including gross N mineralization, net N mineralization and net nitrification. Net N mineralization and nitrification rates were determined with initial N addition (2.1–2.6 mg N (kg DW)–1) due to low inherent mineral N content in part of the soils. Box plots show lower and upper quartiles, median (thick black line), smallest and largest values without outliers (thin black line) and outliers (circles); n = 5 biologically independent samples. Lower case letters indicate significant differences between studied soils, tested separately for each treatment (a) or process (b; Kruskal-Wallis test with pairwise comparisons with Dunn’s test; adjusted p < 0.05). Note the logarithmic scale on y-axis in a. One outlying point has been removed from net nitrification data for vegetated Holocene cover in b. DW dry weight, ND Not determined.
Fig. 4
Fig. 4. Relative abundance of selected N cycling genes at the Kurungnakh exposure from all functional gene sequences captured with the targeted metagenomics tool.
a Relative abundance of amoA gene (including bacterial and archaeal). b Relative abundance of nir gene (including both nirK and nirS). c Relative abundance of nosZ gene. d Ratio of (nirK + nirS)/nosZ genes. The studied surfaces are arranged according to the distance from the Yedoma cliff border, with intact Holocene cover on the top of the Yedoma exposure on the left and earliest thawed revegetated Yedoma on the right side. Small gray symbols indicate values for individual samples, large red symbols indicate means, and error bars indicate standard error of mean (n = 3 biologically independent samples). Lower case letters indicate significant differences between studied soils (Kruskal-Wallis test with pairwise comparisons with Dunn’s test; unadjusted p < 0.05). VH Vegetated Holocene cover, BYF Bare freshly thawed Yedoma, BYE Bare earlier thawed Yedoma, VYM Yedoma revegetated with mosses, and VYG Yedoma revegetated with grasses.

References

    1. Huang J, et al. Recently amplified arctic warming has contributed to a continual global warming trend. Nat. Clim. Change. 2017;7:875–879.
    1. Biskaborn BK, et al. Permafrost is warming at a global scale. Nat. Commun. 2019;10:264–11. - PMC - PubMed
    1. Turetsky MR, et al. Permafrost collapse is accelerating carbon release. Nature. 2019;569:32–34. - PubMed
    1. Hugelius G, et al. Estimated stocks of circumpolar permafrost carbon with quantified uncertainty ranges and identified data gaps. Biogeosciences. 2014;11:6573–6593.
    1. Hugelius G, et al. Large stocks of peatland carbon and nitrogen are vulnerable to permafrost thaw. Proc. Natl Acad. Sci. U.S.A. 2020;117:20438–20446. - PMC - PubMed

Publication types