. 2021 Dec 7;12(1):7102.
doi: 10.1038/s41467-021-27337-x.

eIF2B-capturing viral protein NSs suppresses the integrated stress response

Affiliations

eIF2B-capturing viral protein NSs suppresses the integrated stress response

Kazuhiro Kashiwagi et al. Nat Commun. .

Abstract

Various stressors such as viral infection lead to the suppression of cap-dependent translation and the activation of the integrated stress response (ISR), since the stress-induced phosphorylated eukaryotic translation initiation factor 2 [eIF2(αP)] tightly binds to eIF2B to prevent it from exchanging guanine nucleotide molecules on its substrate, unphosphorylated eIF2. Sandfly fever Sicilian virus (SFSV) evades this cap-dependent translation suppression through the interaction between its nonstructural protein NSs and host eIF2B. However, its precise mechanism has remained unclear. Here, our cryo-electron microscopy (cryo-EM) analysis reveals that SFSV NSs binds to the α-subunit of eIF2B in a competitive manner with eIF2(αP). Together with SFSV NSs, eIF2B retains nucleotide exchange activity even in the presence of eIF2(αP), in line with the cryo-EM structures of the eIF2B•SFSV NSs•unphosphorylated eIF2 complex. A genome-wide ribosome profiling analysis clarified that SFSV NSs expressed in cultured human cells attenuates the ISR triggered by thapsigargin, an endoplasmic reticulum stress inducer. Furthermore, SFSV NSs introduced in rat hippocampal neurons and human induced-pluripotent stem (iPS) cell-derived motor neurons exhibits neuroprotective effects against the ISR-inducing stress. Since ISR inhibition is beneficial in various neurological disease models, SFSV NSs may be a promising therapeutic ISR inhibitor.


Conflict of interest statement

The authors declare no competing interests.

Figures

Fig. 1
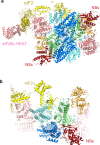
Fig. 1. Cryo-EM structure of the human eIF2B SFSV NSs complex.
a Overall structure of the human eIF2B•SFSV NSs complex (eIF2Bα: blue; eIF2Bβ: cyan; eIF2Bγ: orange; eIF2Bδ: lime; eIF2Bε: pink; SFSV NSs: maroon). b Overlay showing a comparison of the interactions through the α-δ groove of eIF2B in the eIF2B•SFSV NSs complex and in the eIF2B•eIF2(αP) complex (PDB: 7D44). The eIF2B subunits and the phosphorylated eIF2α subunit in the eIF2B•eIF2(αP) complex are pale blue and yellow, respectively. The two structures are aligned with their eIF2Bβ subunit C-terminal domains.
Fig. 2
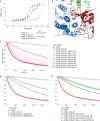
Fig. 2. Aromatic clusters of SFSV NSs are important for binding to eIF2B and suppressing the inhibitory effect of eIF2(αP).
a MST analysis between eIF2B and SFSV NSs. Fluorescently labeled SFSV NSs (100 nM) was mixed with an equal volume of a 16-step serial dilution of 6.8 μM eIF2B and the microscale thermophoresis was measured. Plots of the wild-type SFSV NSs (maroon) and the alanine-substituted mutants on aromatic cluster 1 (SFSV NSs-c1-Ala-mut: Y5A, F7A, and F33A; yellow), aromatic cluster 2 (SFSV NSs-c2-Ala-mut: Y79A and F80A; blue), and both clusters (SFSV NSs-c1 + 2-Ala-mut: Y5A, F7A, F33A, Y79A, and F80A; cyan) are shown. Data are presented as mean values ± SDs at each concentration, and n = 3 independent experiments. b Two aromatic clusters of SFSV NSs at the interface with eIF2B. Aromatic cluster 1 (c1: Y5, F7, and F33) and aromatic cluster 2 (c2: Y79 and F80) grasp the α3 helix of the eIF2Bα subunit from both sides and bury the space between the helices of the eIF2Bα subunit. ce Guanine nucleotide exchange assay. Non-phosphorylatable eIF2(αS51A) (final 150 nM) was loaded with BODIPY-GDP and fluorescent signals were read every 20 s. In the three panels, the gray lines are the measurements without eIF2B, and other measurements were started by the addition of eIF2B (final 40 nM). The red and green lines are the measurements without and with eIF2(αP) (final 1.5 μM), respectively. In the experiments shown in c, various concentrations (0–200 nM) of wild-type SFSV NSs were included in the reaction solutions containing fluorescent-eIF2(αS51A) and eIF2(αP). In the experiments shown in (d and e), ISRIB (d) or the mutants of SFSV NSs (c1-Ala-mut, c2-Ala-mut, and c1 + 2-Ala-mut) (e) were included into the reaction solutions at 200 nM. The same controls (No eIF2B, eIF2B, eIF2B + eIF2(αP) and eIF2B + eIF2(αP) + SFSV NSs at 200 nM) were used in (d and e). Data are presented as mean values ± SDs at each time point [n = 3 for eIF2B + eIF2(αP) + SFSV NSs at 100 nM in c, n = 4 for eIF2B + eIF2(αP) + SFSV NSs at 20, 40, 60 nM in (c), eIF2B + eIF2(αP) in (d and e), eIF2B + eIF2(αP) + SFSV NSs-c1-Ala-mut, eIF2B + eIF2(αP) + SFSV NSs-c1 + 2-Ala-mut in (e), and n = 5 for the rest of the experiments. n means the number of independent experiments]. Source data are provided as a Source Data file.
Fig. 3
Fig. 3. Cryo-EM structure of the human eIF2B•SFSV NSs•unphosphorylated eIF2 complex.
a Overall structure of the human eIF2B SFSV NSs unphosphorylated eIF2 (one eIF2-bound) complex. eIF2B and SFSV NSs are color-coded as in Fig. 1. The eIF2α and eIF2γ subunits are colored yellow and olive, respectively. b Close-up view of the interfaces for SFSV NSs and eIF2α. These two molecules can bind eIF2B simultaneously and there is no direct interaction between them.
Fig. 4
Fig. 4. SFSV NSs suppresses translational impacts induced by thapsigargin.
a Global protein synthesis rate measured by OP-puro labeling in control, SFSV NSs-expressing, or SFSV NSs-c1 + 2-Ala-mut-expressing cells. Cells were also treated with 50 or 500 nM Tg. Representative images of three biologically independent replicates of labeled nascent proteins (IR800 signal) and total protein with Coomassie Brilliant Blue (CBB) staining are shown. b Quantification of nascent proteins labeled with OP-puro, normalized by total protein in (a). Data of three replicates (points) and the means (bars) are shown. c Histogram of the number of transcripts along the footprint change in cells treated with 500 nM Tg. Data were normalized to the mean of footprint change of mitochondrial genome-encoded genes (used as internal spike-ins). Bin width is 0.1. d MA (M, log ratio; A, mean average) plot of the ribosome occupancy change in control vector-transfected cells treated with 500 nM Tg. High-sensitive and low-sensitive mRNAs (defined as false discovery rate [FDR] < 0.05) are highlighted. e, f Heatmap of ribosome occupancy changes on uORF-containing stress-resistant mRNAs (identified in ref. ) (e) and XBP1s extension (f), compared to control vector-transfected cells treated with 0 nM Tg. The log2-fold change scales are shown at the color bars. Schematic representations of the XBP1 gene are shown on the top of f. The intron in the XBP1u mRNA is spliced to produce the C-terminally extended protein upon ER stress. Source data are provided as a Source Data file.
Fig. 5
Fig. 5. SFSV NSs in rat primary hippocampal neurons attenuates the ISR induction and protects the neuronal morphology.
a Schematic illustration of thapsigargin treatment (500 nM) for rat primary hippocampal neurons. The neurons were transfected with the control plasmid, the SFSV NSs-expression plasmid, or the SFSV NSs-c1 + 2-Ala-mut-expression plasmid by electroporation. b Representative images of hippocampal neurons with or without Tg treatment after 24 h. Tg treatment shortened the neurites in the control and NSs-c1 + 2-Ala-mut-expressing cells, whereas NSs counteracted Tg. Scale bar = 100 µm. c Schematic representation of the Sholl analysis. d The Sholl analysis revealed that NSs protected the arborization of neurons. n = 5. e NSs downregulated ATF4 expression induced by Tg (500 nM, 3 h), as compared to the control and NSs-c1 + 2-Ala-mut. n = 3 (seven targeted neurons), n means the number of independent experiments. *p < 0.05, a.u., arbitrary units. Scale bar = 10 µm. The 12-bit scale of fluorescent intensity is shown as color coded. d One-way ANOVA with Tukey’s multiple comparisons test. e Two-way ANOVA with Tukey’s multiple comparisons test. Error bars ± SD. a, b DIV, days in vitro. Source data are provided as a Source Data file.
Fig. 6
Fig. 6. SFSV NSs in human iPS cell-derived motor neurons attenuates the ISR induction and exhibits neuroprotective effects.
a Motor neuron differentiation from human iPS cells and the timing of NSs transfection and drug administration. After motor neurons were replated onto glass coverslips, they were transfected with the control plasmid, the SFSV NSs-expression plasmid, or the SFSV NSs-c1 + 2-Ala-mut-expression plasmid by Lipofectamine 3000 for 2 days. After additional 3 days, the neurons were treated with thapsigargin (Tg; 500 nM) for 2 h, followed by fixation and immunostaining of ATF4. b Representative images of motor neurons with or without Tg treatment. Scale bar = 50 µm. c Tg significantly induced the stress response, as represented by ATF4 upregulation in motor neurons. n = 3. Scale bar = 10 µm. **p < 0.01. d ATF4 intensity in control, SFSV NSs-expressing, and SFSV NSs-c1 + 2-Ala-mut-expressing motor neurons after Tg treatment. In SFSV NSs-expressing motor neurons, ATF4 was significantly downregulated, whereas mutant SFSV NSs expression did not alter ATF4 protein levels as compared to the control. n = 3. *p < 0.05. Scale bar = 10 µm. e Sholl analysis in motor neurons. NSs expression increased the length of axons as compared to the control and NSs-c1 + 2-Ala-mut expression. n = 5. f ISR triggered a significant increase of immunoreactivity to the GADD34 antibody. In addition, NSs treatment significantly decreased the expression level of GADD34, whereas NSs-c1 + 2-Ala-mutant did not alter the GADD34 level as compared to the control. n = 5. Scale bar = 10 µm. g Illustration of ISR induction and NSs effect upon ER stress in neurons. n means the number of independent experiments *p < 0.05; **p < 0.01. h Student’s t-test; df One-way ANOVA with Tukey’s multiple comparisons test. Error bars ±SD. c, d, f a.u., arbitrary units. The 12-bit scale of fluorescent intensity is shown at color coded. Source data are provided as a Source Data file.

Similar articles

Cited by

References

    1. Pakos-Zebrucka K, et al. The integrated stress response. EMBO Rep. 2016;17:1374–1395. - PMC - PubMed
    1. Merrick WC, Pavitt GD. Protein synthesis initiation in eukaryotic cells. Cold Spring Harb. Perspect. Biol. 2018;10:a033092. - PMC - PubMed
    1. Kenner LR, et al. eIF2B-catalyzed nucleotide exchange and phosphoregulation by the integrated stress response. Science. 2019;364:491–495. - PMC - PubMed
    1. Kashiwagi K, et al. Structural basis for eIF2B inhibition in integrated stress response. Science. 2019;364:495–499. - PubMed
    1. Wek RC. Role of eIF2α kinases in translational control and adaptation to cellular stress. Cold Spring Harb. Perspect. Biol. 2018;10:a032870. - PMC - PubMed

Publication types

MeSH terms

Substances