. 2021 Dec 7;12(1):7092.
doi: 10.1038/s41467-021-27318-0.

Delayed induction of type I and III interferons mediates nasal epithelial cell permissiveness to SARS-CoV-2

Affiliations

Delayed induction of type I and III interferons mediates nasal epithelial cell permissiveness to SARS-CoV-2

Catherine F Hatton et al. Nat Commun. .

Abstract

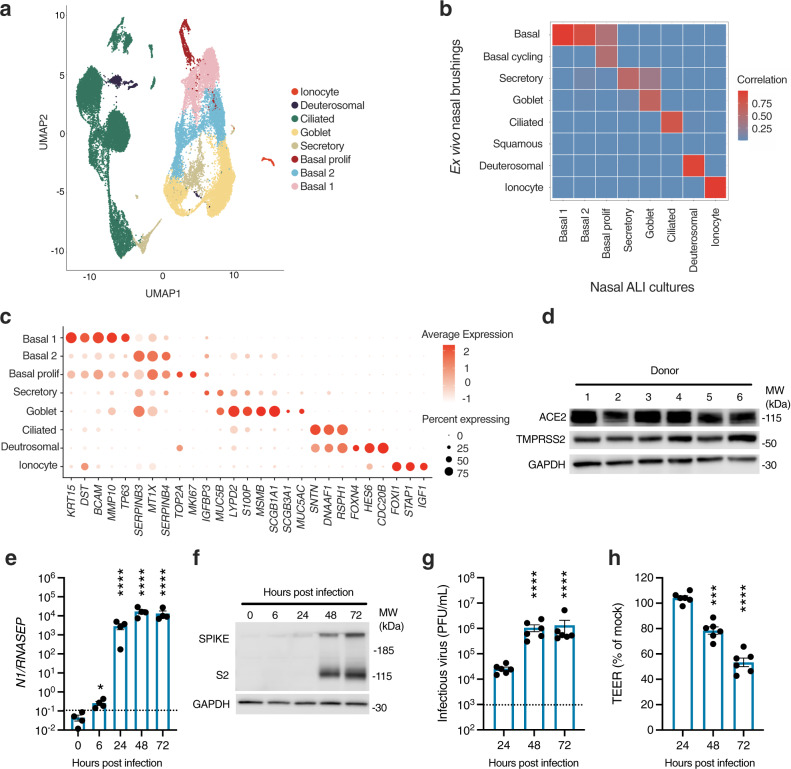
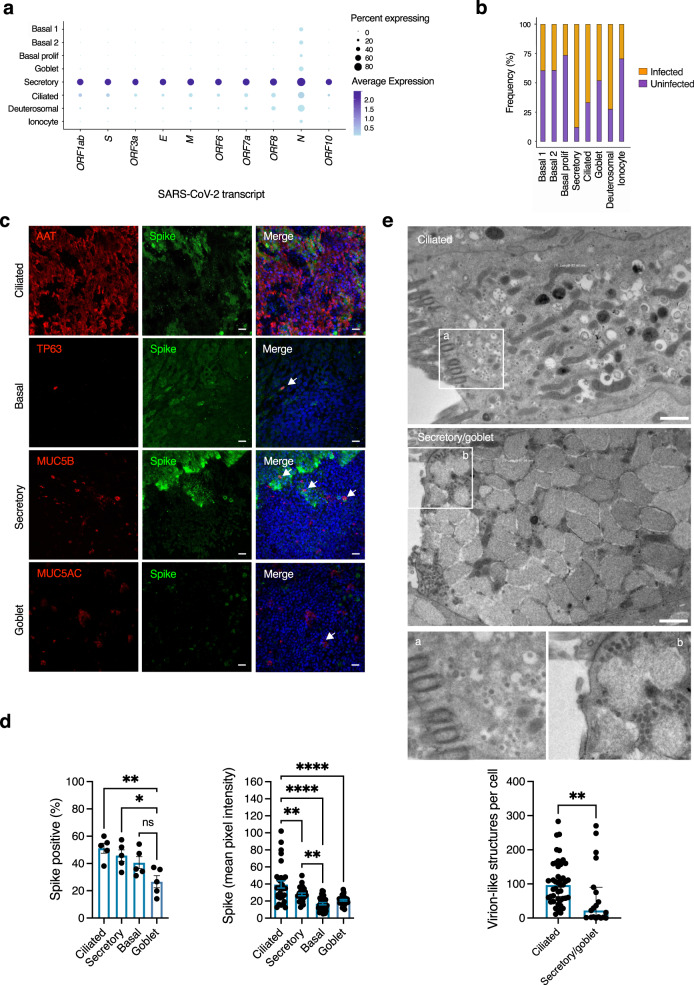
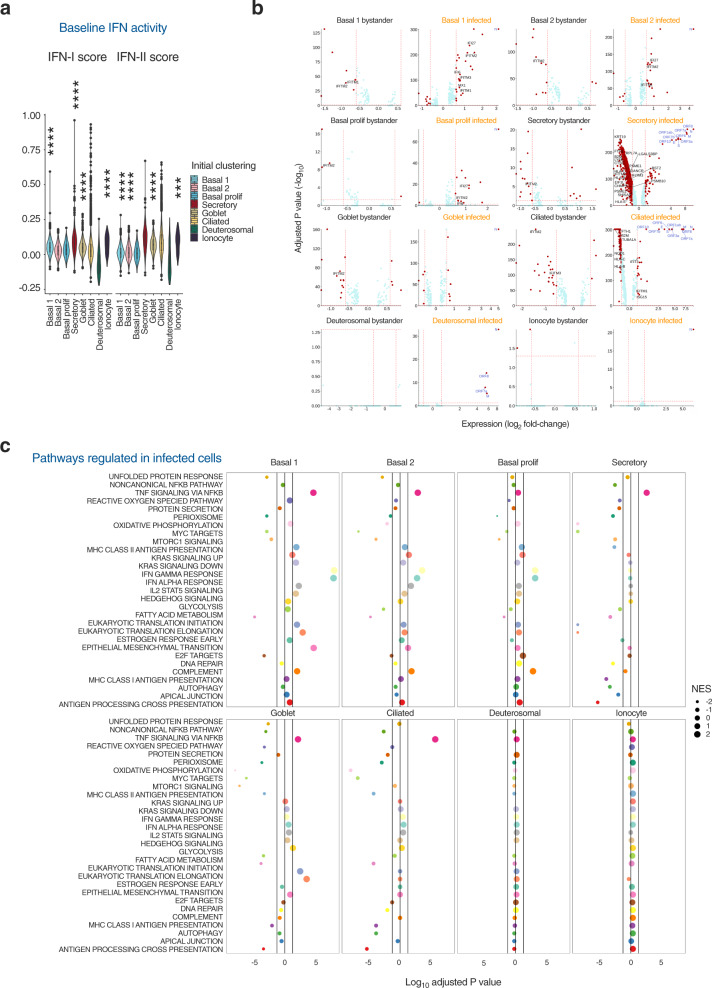
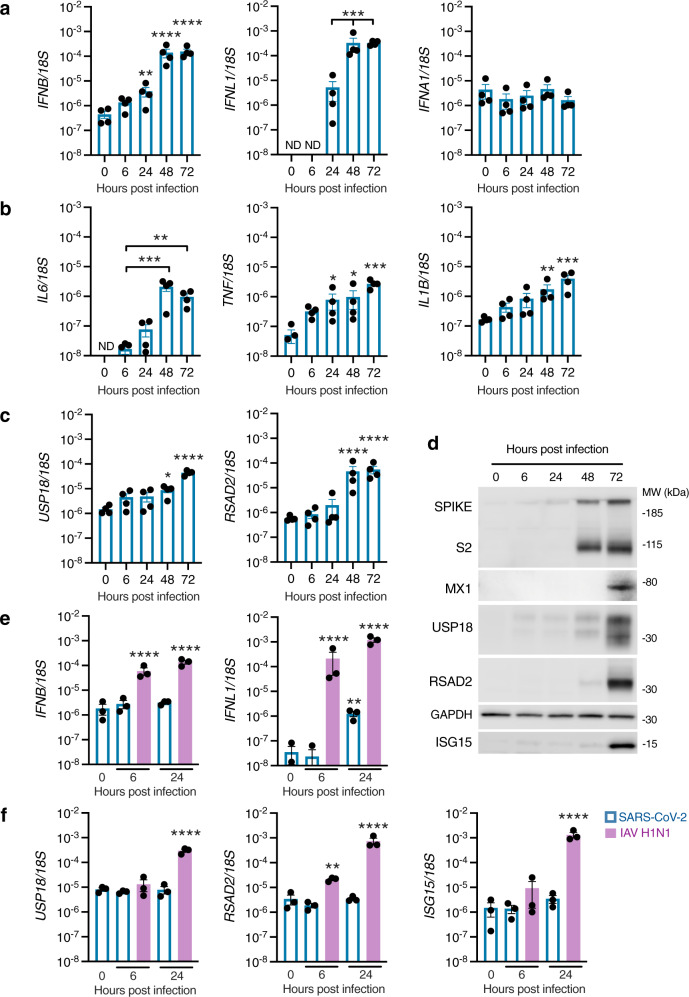
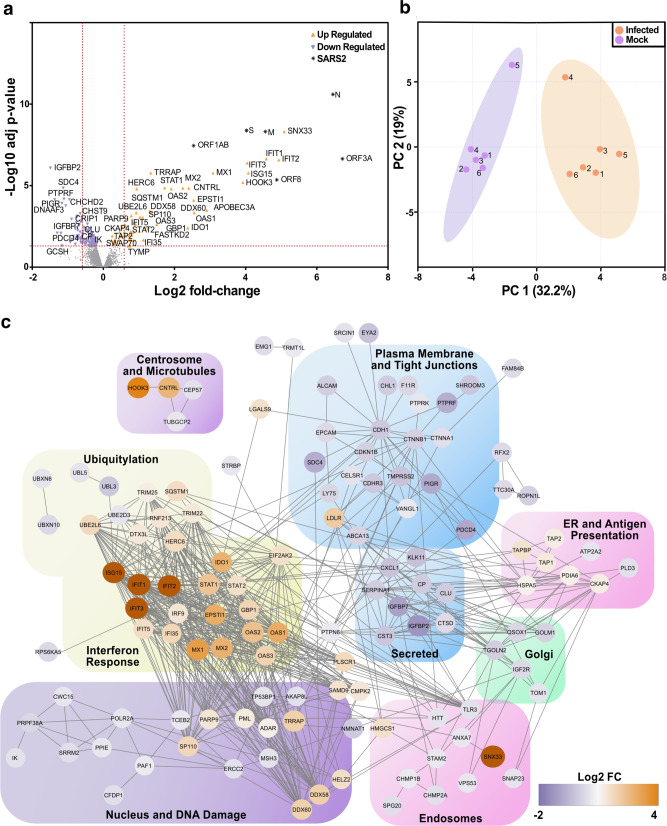
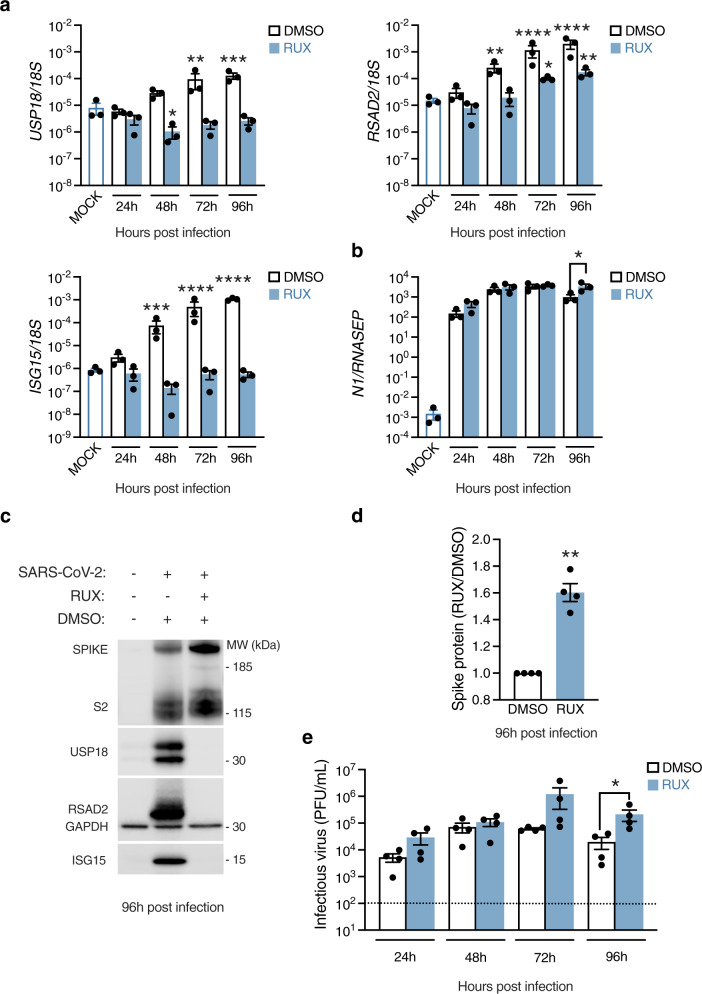
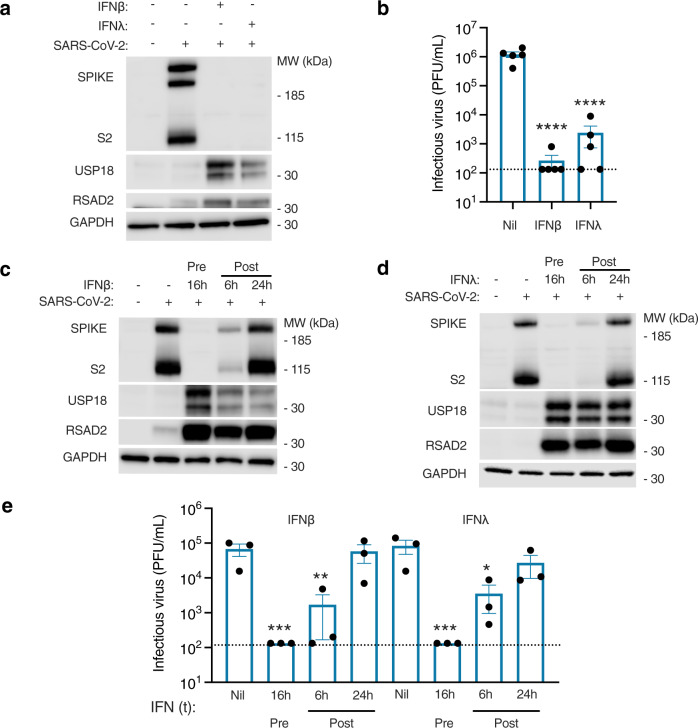
The nasal epithelium is a plausible entry point for SARS-CoV-2, a site of pathogenesis and transmission, and may initiate the host response to SARS-CoV-2. Antiviral interferon (IFN) responses are critical to outcome of SARS-CoV-2. Yet little is known about the interaction between SARS-CoV-2 and innate immunity in this tissue. Here we apply single-cell RNA sequencing and proteomics to a primary cell model of human nasal epithelium differentiated at air-liquid interface. SARS-CoV-2 demonstrates widespread tropism for nasal epithelial cell types. The host response is dominated by type I and III IFNs and interferon-stimulated gene products. This response is notably delayed in onset relative to viral gene expression and compared to other respiratory viruses. Nevertheless, once established, the paracrine IFN response begins to impact on SARS-CoV-2 replication. When provided prior to infection, recombinant IFNβ or IFNλ1 induces an efficient antiviral state that potently restricts SARS-CoV-2 viral replication, preserving epithelial barrier integrity. These data imply that the IFN-I/III response to SARS-CoV-2 initiates in the nasal airway and suggest nasal delivery of recombinant IFNs to be a potential chemoprophylactic strategy.


Conflict of interest statement

S.H. declares honoraria from CSL Behring and Takeda for teaching and consultancy. M.B. declares being CI on investigator-led research grants from Pfizer and Roche Diagnostics; speaker fees paid to Newcastle University from Novartis, Roche Diagnostics and TEVA; travel expenses to educational meetings from Boehringer Ingelheim and Vertex. The remaining authors declare no competing interests.

Figures

Fig. 1
Fig. 1. Robust SARS-CoV-2 infection in a primary differentiated nasal epithelial ALI culture model.
a UMAP visualisation of single-cell RNA sequencing (scRNA-seq) data from nasal ALI cultures (28,346 single-cell transcriptomes from two representative donors) showed six major cell types. b Correlation between the annotation from an external dataset of nasopharyngeal swabs and the assigned annotation of our scRNA-seq from nasal ALI culture following label transfer. c Dot plot demonstrating expression of key markers distinguishing cell types in annotated clusters, with intensity demonstrated by colour and size of the dot representing the proportion of cells expressing the marker. d Immunoblot demonstrating ACE2 and TMPRSS2 expression by donor, representative of n = 3 experiments. Nasal ALI cultures were infected with SARS-CoV-2 (MOI 0.1) and subjected to various modalities to analyse infection. Whole-cell lysates were prepared at the indicated times for RT-PCR analysis of expression of e SARS-CoV-2 nucleocapsid (N1) gene expression normalised to the housekeeper RNASEP (average of n = 2 repeat experiments in n = 4 donors, mean ± SEM; *P = 0.0248, ****P < 0.0001, ANOVA, two-sided, with Dunnett’s post-test correction compared to 0 h). f Whole-cell lysates were prepared at the indicated times for immunoblot analysis of expression of SARS-CoV-2 spike (S) and cleaved S2 protein expression (representative of repeat experiments in n = 4 donors). g Release of infectious viral particles was measured by plaque assay of apical washings on permissive Vero E6 cells (average of repeat experiments in n = 6 donors, mean ± SEM; ****P < 0.0001, ANOVA, two-sided, with Dunnett’s post-test correction compared to 24 h). Dotted line represents lower limit of detection. h Transepithelial resistance (TEER) measurements upon infection (expressed as % of mock-infected wells, n = 6 donors, mean ± SEM; ***P = 0.0007, ****P < 0.0001, ANOVA, two-sided, with Dunnett’s post-test correction compared to 24 h). UMAP = Uniform Manifold Approximation and Projection, MOI = multiplicity of infection, PFU = plaque-forming units, MW = molecular weight, kDa = kilodalton, ACE2 = angiotensin-converting enzyme 2, TMPRSS2 = transmembrane serine protease 2, GAPDH = glyceraldehyde-3-phosphate dehydrogenase.
Fig. 2
Fig. 2. Broad tropism of SARS-CoV-2 for nasal cells.
Nasal ALI cultures were infected with SARS-CoV-2 (MOI 0.1) and analysed using different modalities to explore tropism. At 24 h post-infection (hpi), cell suspensions were prepared from two representative donors for single-cell RNA sequencing (scRNA-seq) and 28,346 individual transcriptomes passing QC were analysed. a Dot plot of scRNA-seq data showing magnitude (colour) and proportion (size) of cell types expressing viral transcripts. E = envelope; M = matrix; N = nucleocapsid; S = spike, ORF = open reading frame. b Relative proportion of infected cell types based on expression of any viral transcript. Separately, nasal ALI cultures were fixed at 48 hpi and subjected to immunofluorescence analysis. c Expression of viral S protein expression in ciliated (AAT), basal cells (TP63), secretory (MUC5B) and goblet (MUC5AC) cells (arrowed) shown in (c). Scale bars = 10 μm (representative of experiments in n = 5 donors). d Quantification of cell-type specific expression of viral S protein (Goblet vs Secretory *p = 0.0309, Goblet vs Ciliated **p = 0.0045) and S protein intensity (Basal vs Secretory **p = 0.0073, Secretory vs Ciliated **p = 0.0046, ****p < 0.0001) at 48 hpi (n = 5 donors, mean ± SEM; ns = non-significant, ANOVA, two-sided, with Sidak’s post-test correction for multiple comparisons, indicated by lines). e Nasal ALI cultures were infected as above, fixed at 48 hpi for transmission electron micrograph (TEM) analysis of SARS-CoV-2 infected ciliated and secretory/goblet cells. Inserts a, b display virion-like structures in ciliated and secretory/goblet cells, respectively. Scale bars = 1 μm. Image analysis was undertaken to quantify virion-like structures as displayed in the bar plot (n = 3 donors, mean ± SEM **P = 0.0031, Mann–Whitney test, two-sided). MOI = multiplicity of infection, AAT = acetylated-alpha tubulin, tumour protein 63 = TP63, MUC = mucin.
Fig. 3
Fig. 3. Characterisation of individual nasal cell transcriptional responses to SARS-CoV-2.
Nasal ALI cultures were infected with SARS-CoV-2 (MOI 0.1). At 24 h post-infection (hpi), cell suspensions were prepared from two representative donors for single-cell RNA sequencing (scRNA-seq) and 28,346 individual transcriptomes passing quality control (QC) were analysed. a Violin plot representing the composite interferon-stimulated gene (ISG) signature score that was defined based on a published nasal cell dataset from cells treated with IFN alpha and IFN gamma. Gene set scores greater than zero suggest expression levels higher than background gene expression. The bottom and the top of the boxes correspond to the 25th (Q1) and 75th (Q3) percentiles, and the internal band is the 50th percentile (median). The plot whiskers represent the 95% confidence intervals show down to the minimum (Q1−1.5*IQR) and up to the maximum (Q3 + 1.5*IQR) value. IQR = interquartile range. Outside points correspond to potential outliers. See Supplementary data 6 for exact values. Two-sided Wilcoxon rank sum testing was performed for each cell type vs all with Benjamini–Hochberg correction (***P < 0.0008, ****P < 0.0001). b Differential expression (DE) analysis by Wilcoxon rank sum test was undertaken to compare mock-infected cell transcriptomes with those from bystander cells (without detectable viral transcripts) and infected cells (with detectable viral transcripts) from the virus-exposed cultures. Volcano plots were generated with vertical lines marking ±1.5 fold change cut-offs (note log2 scale) and the horizontal line marking an adjusted P value cut-off of 0.05 (<0.05 was considered statistically significant). Individual genes coloured as non-significant (light blue) and significant (red). Labels indicate viral transcripts (dark blue) and epithelial-cell specific ISGs (black). c Gene-set enrichment analysis was undertaken by ordering genes by fold change difference between mock-infected and infected cells by cluster (two-sided Wilcoxon rank sum statistical test with Bonferroni multiple testing correction). Vertical lines indicated adjusted P value cut-off of 0.05. NES = normalised enrichment score, MOI = multiplicity of infection.
Fig. 4
Fig. 4. Delayed induction of IFN-I/III signalling in SARS-CoV-2-infected nasal ALI cultures.
Nasal ALI cultures were infected with SARS-CoV-2 (MOI 0.1). Whole-cell lysates were prepared at the indicated times for RT-PCR analysis of expression of a IFNB (**p = 0.0081, ****p < 0.0001), IFNL1 (***p < 0.0006) and IFNA1 b IL6 (*p = 0.001, ***p = 0.0003), TNF (0 h vs 24 h *p = 0.0182, 0 h vs 48 h **p = 0.0124, ***p = 0.0002) and IL1B (**p = 0.0031, ***p = 0.0001) and c USP18 (*p = 0.0102, ****p < 0.0001), and RSAD2 (****p < 0.0001), (average of n = 2 repeat experiments in n = 4 donors, mean ± SEM; ANOVA, two-sided, with Dunnett’s post-test correction compared to 6 h [b, IL6], 24 h [a, IFNL1] or 0 h [all others]). ND, Not detected. d Whole-cell lysates were prepared at the indicated times for immunoblot analysis of Spike/cleaved S2, MX1, USP18, RSAD2 and ISG15 expression (representative of experiments in n = 4 donors). Nasal ALI cultures were infected with SARS-CoV-2 or influenza A virus (IAV H1N1, purple bars) at MOI 2. Whole-cell lysates were prepared at the indicated times for RT-PCR analysis of expression of e IFNB, IFNL1 (**P < 0.0056, ****P < 0.0001, all compared to 0 h) and f the ISGs USP18, RSAD2 and ISG15 (**P < 0.0010, ****P < 0.0001, all compared to 0h) (n = 3 donors, mean ± SEM; ANOVA, two-sided, with Dunnett’s post-test correction). MOI = multiplicity of infection, MW = molecular weight, kDa = kilodalton.
Fig. 5
Fig. 5. An ISG response dominates the proteome of SARS-CoV-2 infected nasal ALI cultures.
Differential proteomic profiling of SARS-CoV-2-infected nasal ALI cultures. Mass spectrometry-based proteomics was carried out on whole-cell lysates prepared at 72 h post infection (hpi; n = 6 donors per condition). The exact adjusted (adj) P values can be found in Supplementary dataset 5. a Volcano plot illustrating 180 differentially expressed proteins with increased (orange points) and decreased (purple points) expression in infected as compared to mock-infected samples. Dotted red lines indicate those proteins with a fold change of >1.5 and adjusted p values <0.05. b Principal component (PC) analysis of the whole proteome dataset. c Functional annotation network of differentially expressed proteins to indicate those proteins with a fold change (FC; Log2).
Fig. 6
Fig. 6. Impact of endogenous IFN-I/III signalling on SARS-CoV-2 infection.
Nasal ALI cultures treated with ruxolitinib (RUX, 10 µM) or Dimethyl sulfoxide (DMSO) vehicle for 24 h prior to infection (MOI 0.1). Whole-cell lysates were prepared at the indicated times for RT-PCR analysis of expression of a the ISGs USP18 (*p = 0.0133, **p = 0.0051, ***p = 0.0006), RSAD2 (*p = 0.0333, mock vs DMSO 48 hpi **p = 0.0019, mock vs RUX 96 hpi **p = 0.0061, ****P < 0.0001) and ISG15 (***p = 0. 0006, ****P < 0.0001) (n = 3 donors, mean ± SEM; ANOVA, two-sided, with Dunnett’s post-test correction, all compared to mock-infected cells) or b viral N mRNA (n = 3 donors, mean ± SEM; *P = 0.0346 ANOVA, two-sided, with Sidak’s post-test correction compared to DMSO control). c Whole-cell lysates were prepared at 96 hpi for immunoblot analysis of viral Spike (S)/cleaved S2 protein and host RSAD2, USP18 and ISG15 protein expression (representative blot shown of experiments in n = 4 donors). d Densitometry analysis of S+S2 protein intensity relative to GAPDH, normalised to the DMSO control (data from c, n = 4 donors, mean ± SEM; **P = 0.003, one-sample t test, two-sided). e Plaque assay of apical washes collected at the times indicated showing a significant increase in infectious particle release at 96 h post infection (hpi) (same experimental conditions as (c, d); n = 4 donors, mean ± SEM; *P = 0.0147, ANOVA, two-sided, with Sidak’s post-test correction compared to DMSO control). Dotted line indicates lower limit of assay detection. MOI = multiplicity of infection, MW = molecular weight, kDa = kilodalton, PFU = plaque-forming units.
Fig. 7
Fig. 7. Exogenous IFN-I/III treatment controls SARS-CoV-2 replication.
Nasal ALI cultures were pre-treated for 16 h with IFNβ (1000 IU/mL) or IFNλ1 (100 ng/mL) prior to infection (MOI 0.01). a Immunoblot of whole-cell lysates prepared from nasal ALI cultures at 48 h post infection (hpi) (representative of experiments in n = 4 donors). b Plaque assay of apical washes showing significant reduction in infectious particle release at 48 hpi if pre-treated with IFNβ (1000 IU/mL) or IFNλ1 (100 ng/mL) (same experimental conditions as a; n = 5 donors, mean ± SEM; ****P < 0.0001, ANOVA, two-sided, with Dunnett’s post-test correction compared to untreated control). c, d Immunoblot of whole-cell lysates prepared at 48 hpi. Nasal ALI cultures were either pre-treated (Pre) with IFNβ (1000 IU/mL, c) or IFNλ1 (100 ng/mL, d) for 16 h prior to infection with SARS-CoV-2, or IFN treatment was applied at 6 or 24 hpi (Post). Results representative of experiments in n = 3 donors. e Plaque assay on apical washes collected at 48 hpi from experiments in (c, d) (n = 3 donors, mean ± SEM; *P = 0.0202, **P = 0.015, ***P = 0.001, ANOVA, two-sided, with Dunnett’s post-test correction compared to untreated control). Dotted line indicates lower limit of assay detection. MOI = multiplicity of infection, MW = molecular weight, kDa = kilodalton, PFU = plaque-forming units, Nil = not treatment, t = treatment.

Similar articles

Cited by

References

    1. Zhu N, et al. A novel coronavirus from patients with pneumonia in China, 2019. N. Engl. J. Med. 2020;382:727–733. - PMC - PubMed
    1. Hoffmann M, et al. SARS-CoV-2 Cell entry depends on ACE2 and TMPRSS2 and Is blocked by a clinically proven Protease inhibitor. Cell. 2020;181:271–280 e278. - PMC - PubMed
    1. Huang C, et al. Clinical features of patients infected with 2019 novel coronavirus in Wuhan, China. Lancet. 2020;395:497–506. - PMC - PubMed
    1. Knight SR, et al. Risk stratification of patients admitted to hospital with covid-19 using the ISARIC WHO clinical characterisation protocol: development and validation of the 4C mortality score. BMJ. 2020;370:m3339. - PMC - PubMed
    1. Group, R. C. et al. Dexamethasone in hospitalized patients with Covid-19—preliminary report. N. Engl. J. Med. 10.1056/NEJMoa2021436 (2020).

Publication types

MeSH terms