. 2021 Dec 7;11(1):23520.
doi: 10.1038/s41598-021-02794-y.

A population based expression atlas provides insights into disease resistance and other physiological traits in cassava (Manihot esculenta Crantz)

Affiliations

A population based expression atlas provides insights into disease resistance and other physiological traits in cassava (Manihot esculenta Crantz)

Alex C Ogbonna et al. Sci Rep. .

Abstract

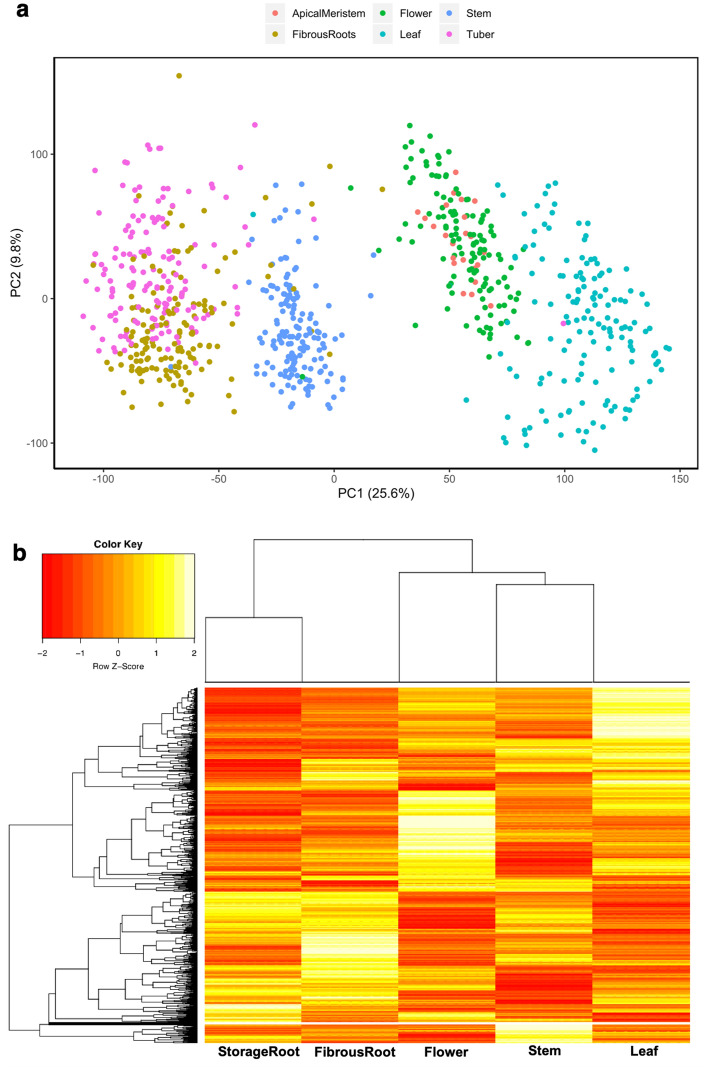
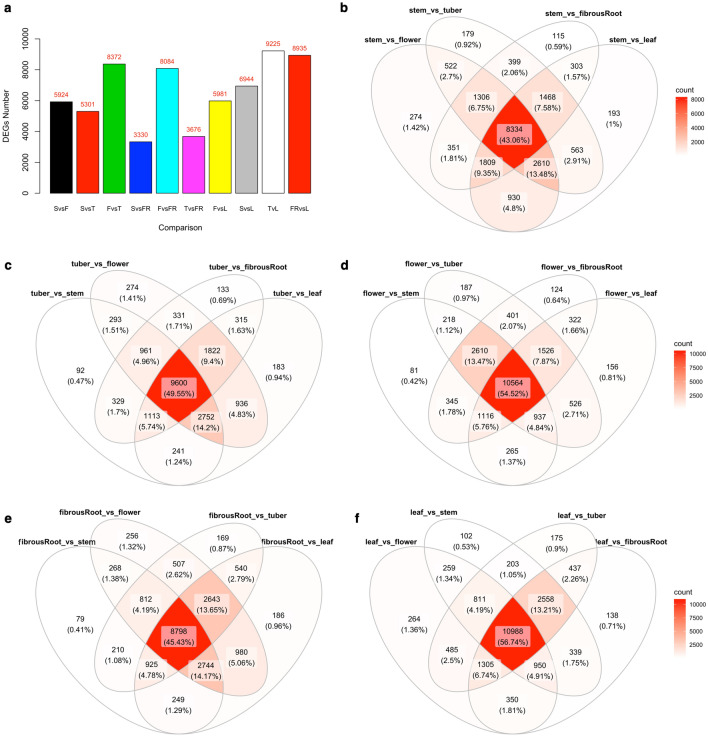
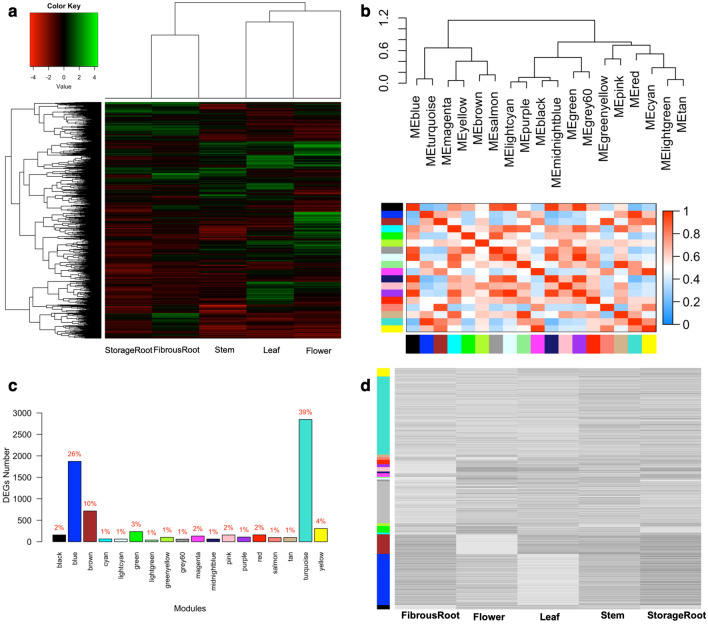
Cassava, a food security crop in Africa, is grown throughout the tropics and subtropics. Although cassava can provide high productivity in suboptimal conditions, the yield in Africa is substantially lower than in other geographies. The yield gap is attributable to many challenges faced by cassava in Africa, including susceptibility to diseases and poor soil conditions. In this study, we carried out 3'RNA sequencing on 150 accessions from the National Crops Resources Research Institute, Uganda for 5 tissue types, providing population-based transcriptomics resources to the research community in a web-based queryable cassava expression atlas. Differential expression and weighted gene co-expression network analysis were performed to detect 8820 significantly differentially expressed genes (DEGs), revealing similarity in expression patterns between tissue types and the clustering of detected DEGs into 18 gene modules. As a confirmation of data quality, differential expression and pathway analysis targeting cassava mosaic disease (CMD) identified 27 genes observed in the plant-pathogen interaction pathway, several previously identified CMD resistance genes, and two peroxidase family proteins different from the CMD2 gene. Present research work represents a novel resource towards understanding complex traits at expression and molecular levels for the development of resistant and high-yielding cassava varieties, as exemplified with CMD.


Conflict of interest statement

The authors declare no competing interests.

Figures

Figure 1
Figure 1
Principal component analysis and heatmap visualization of variance stabilizing transformation (vst) normalized gene-level counts for 31,895 genes across five different tissues (storage root, fibrous root, flower + apical meristem, stem and leaf). (A) Principal component 1 (PC1) and principal component 2 (PC2) were estimated using the prcomp function in R. The total variance explained by PC1 and PC2 is shown. (B) Heatmap of genes across different tissue types. Since apical meristem clustered with flower tissue type and was collected for accessions that did not flower, tissue samples from apical meristem were added to flower tissue types.
Figure 2
Figure 2
Cassava expression atlas (CEA) visualization output for four accessions (F10, Nam130, Mkumba, Pwani) and the Manes.01G011400 gene. (A) Expression atlas cube showing the expression of five tissue types on four accessions for Manes.01G011400 gene and other genes that are correlated to the gene of interest. (B) Heatmap of the expression of five tissue types on four accessions for Manes.01G011400 gene. (C) Expression images of five tissue types on four accessions for Manes.01G011400 gene. (D) Barplots showing the expression of five tissue types on four accessions for Manes.01G011400 gene.
Figure 3
Figure 3
Detected differentially expressed genes (DEGs) across tissue types comparisons. (A) barplot showing detected DEGs across pairwise tissue types (SvsF stem vs flower, SvsT stem vs storageRoot, FvsT flower vs StorageRoot, TvsFR storageRoot vs fibrousRoot, FvsL flower vs leaf, SvsL stem vs leaf, TvsL storageRoot vs leaf, FRvsL fibrousRoot vs leaf). (BF) Overlaps of detected DEGs for different tissue type comparisons.
Figure 4
Figure 4
Differential expression between Mkumba vs Nase14, heatmap of hierarchical clustering and phylogenetics analysis of CMD associated peroxidase genes. (A) Volcano plot showing differentially expressed genes. Some of the gene names were printed on the plots. NS = not significant; Log2 FC = significant DEGs above the threshold of >|1| log2 fold change; P = significant DEGs based on adjusted p value of < 0.05; P & Log2 FC = significant DEGs based on adjusted p value of < 0.05 and threshold of >|1| log2 fold change. The gene (Manes.10G147700) in the top left is a Bifunctional inhibitor/lipid-transfer protein/seed storage 2S albumin superfamily protein. Inserted are Expression atlas cube [above gene name] and barplot [below gene name] showing the expression of five tissue types on two accessions for Manes.10G147700 gene. (B) Heatmap for 27 genes involved in transmembrane transport activities in the yellow module with the genes and their corresponding description. The heatmap shows two broad characterizations. (C) Phylogeny of two differentially expressed peroxidase gene families and the two from GWAS analysis associated with CMD resistance in cassava.
Figure 5
Figure 5
Plant–pathogen interaction pathway, Heatmap of hierarchical clustering of the 27 DEGs in the pathway and cassava expression atlas (CEA) barplot of selected genes. (A) Observed plant–pathogen interaction pathway using the KEGG pathway enrichment analysis. Proteins present in the CMD DEGs are marked with red stars. Proteins marked in green belong to the reference-organism path. The plant–pathogen interaction pathway reveals sets of genes involved in the plant immune response. The gene MKK1/2 and HSP90 were upregulated, while the rest of the observed genes in the pathway were downregulated based on log2 fold change. MKK1/2 and HSP90 shows down- and up-regulations in a CMD susceptible and resistant accessions, respectively. The functions of these genes included potential calcium sensors (AGD11, CML, CAM), hydrogen peroxide generation during hypersensitive response-like cell death (MKK5), and disease resistance pathogen recognition protein that triggers a defense system including the hypersensitive response, which restricts the pathogen growth (RPS2). Others were genes that produce nitric oxide, a messenger molecule involved in hormonal signaling and defense responses in plants (NOA1); a protein kinase gene, involved in plant defense responses specifically recognizing effector avirulence protein and triggering a defense reaction (RPS5); and a gene that is an essential regulator of plant defense, which plays a central role in resistance in case of infection by a pathogen (RIN4). Additional genes in the pathway are involved in transcription, interacting with the W box (5′-(T)TGAC[CT]-3′) (WRKY2); and a gene that generates reactive oxygen species during incompatible interactions with pathogens and is important in the regulation of the hypersensitive response (RBOH F). (B) Heatmap of hierarchical clustering for the 27 genes observed in the plant–pathogen interaction pathway using KEGG enrichment analysis. (C) Barplot of selected genes in the plant–pathogen interaction pathway showing the pattern of gene expression for genes that are upregulated and downregulated for CMD susceptible (based on CMD2 resistance-NASE14) and resistant (Mkumba) accessions.
Figure 6
Figure 6
Heatmap of hierarchical clustering analysis and weighted gene co-expression network analysis (WGCNA). (A) Heatmap of 8820 DEGs across different tissue types. (B) Gene co-expression modules showing the cluster dendrogram constructed based on the eigengenes of the modules (upper panel) and the heatmap for the correlation coefficient between the modules (lower panel). (C) Barplot showing the approximate percentage distributions of DEGs clustered into 18 gene modules using the WGCNA R package. (D) Expression patterns of genes as they are clustered based on detected modules and different tissue types. Genes in the grey module are usually genes that did not cluster with genes in any of the 18 modules.

Similar articles

Cited by

References

    1. Food and Agriculture Organization of the United Nations . Save and Grow: Cassava: A Guide to Sustainable Production Intensification. Food & Agriculture Organization; 2018.
    1. Dixon AGO, et al. Fast track participatory approach to release of elite cassava genotypes for various uses in Nigeria’s cassava economy. Euphytica. 2008;160:1–13.
    1. Okeke UG, Akdemir D, Rabbi I, Kulakow P, Jannink J-L. Accuracies of univariate and multivariate genomic prediction models in African cassava. Genet. Sel. Evol. 2017;49:88. - PMC - PubMed
    1. Hu W, et al. Genome-wide identification and expression analysis of the NAC transcription factor family in cassava. PLoS ONE. 2015;10:e0136993. - PMC - PubMed
    1. Wang Z, Gerstein M, Snyder M. RNA-Seq: A revolutionary tool for transcriptomics. Nat. Rev. Genet. 2009;10:57–63. - PMC - PubMed

Publication types