. 2021 Dec 7;4(1):1364.
doi: 10.1038/s42003-021-02901-9.

Stomach secretes estrogen in response to the blood triglyceride levels

Affiliations

Stomach secretes estrogen in response to the blood triglyceride levels

Takao Ito et al. Commun Biol. .

Abstract

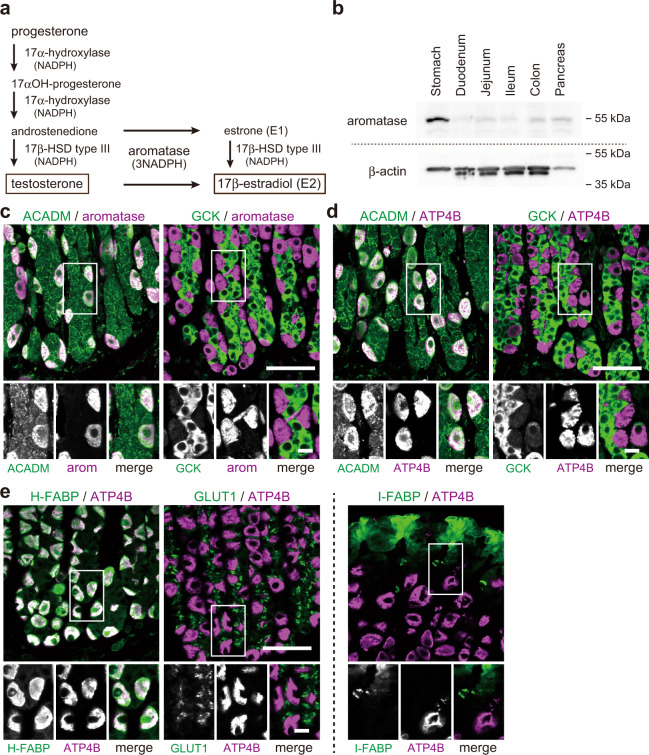
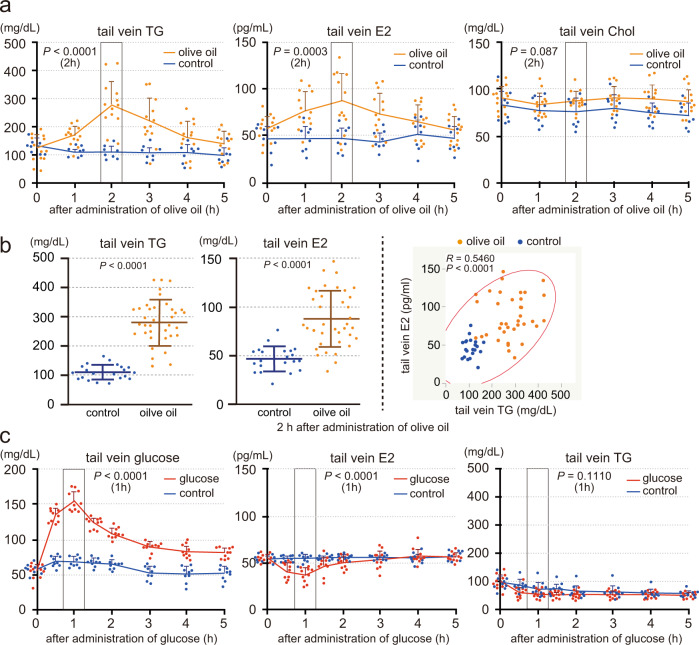
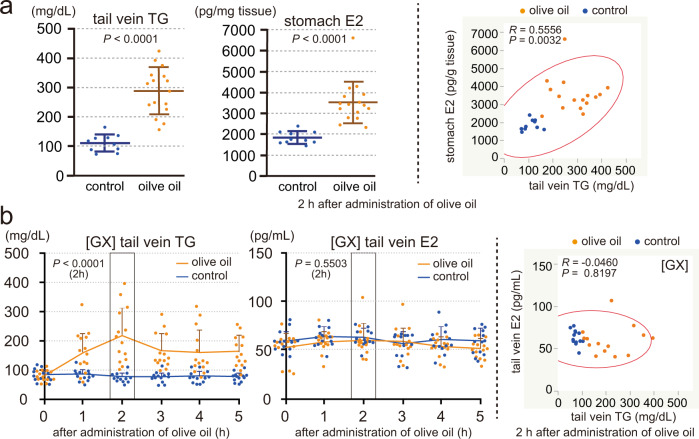
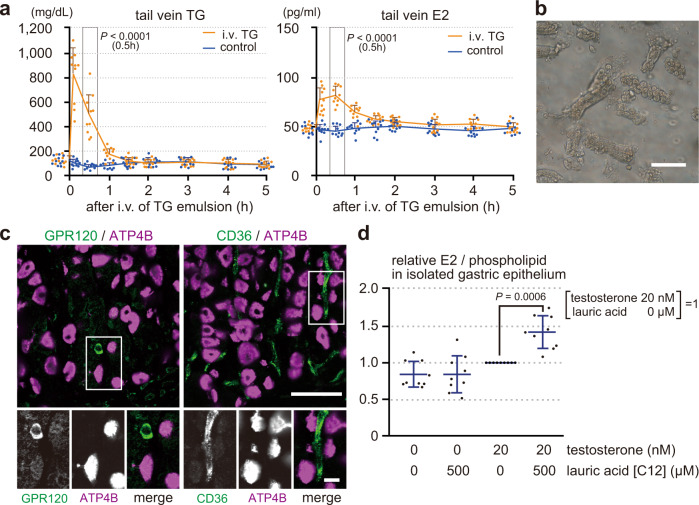
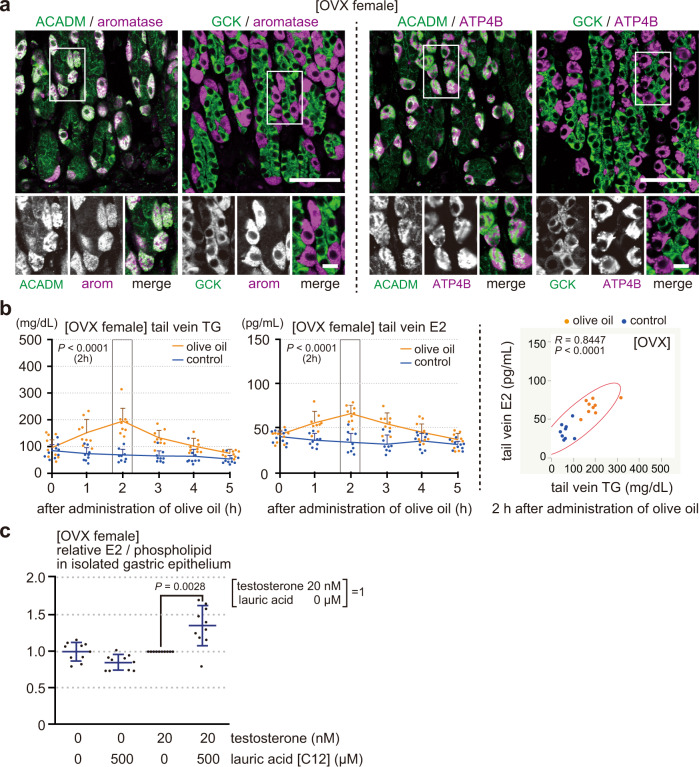
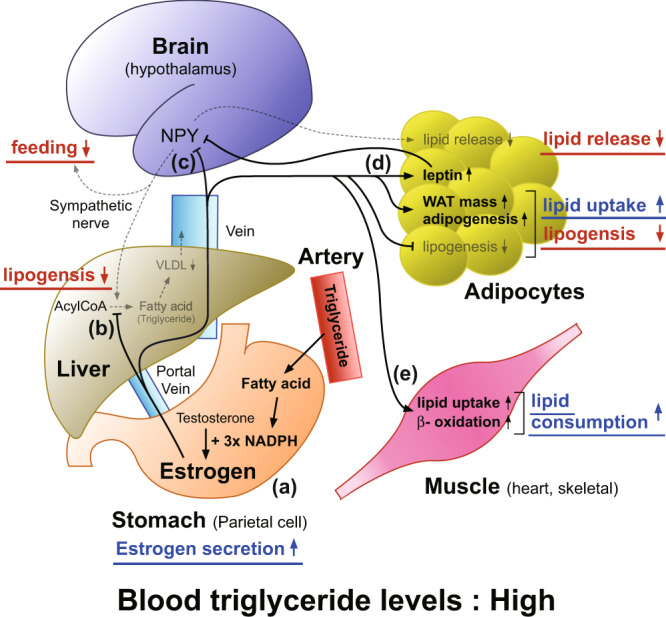
Mammals receive body energy information to maintain energy homeostasis. Ghrelin, insulin, leptin and vagal afferents transmit the status of fasting, blood glucose, body fat, and food intake, respectively. Estrogen also inhibits feeding behavior and lipogenesis, but increases body fat mass. However, how blood triglyceride levels are monitored and the physiological roles of estrogen from the perspective of lipid homeostasis remain unsettled. Here, we show that stomach secretes estrogen in response to the blood triglyceride levels. Estrogen-secreting gastric parietal cells predominantly use fatty acids as an energy source. Blood estrogen levels increase as blood triglyceride levels rise in a stomach-dependent manner. Estrogen levels in stomach tissues increase as blood triglyceride levels rise, and isolated gastric gland epithelium produces estrogen in a fatty acid-dependent manner. We therefore propose that stomach monitors and controls blood triglyceride levels using estrogen, which inhibits feeding behavior and lipogenesis, and promotes triglyceride uptake by adipocytes.


Conflict of interest statement

The authors declare no competing interests.

Figures

Fig. 1
Fig. 1. Estrogen-producing gastric parietal cells use fatty acids as an energy source in males.
a Scheme of testosterone (progesterone)-17β-estradiol (E2) conversion pathway in rat gastric parietal cells. b Immunoblotting of crude extracts from the stomach, duodenum, jejunum, ileum, colon, and pancreas of adult male rats using antibodies against aromatase and control β-actin. ce Gastric mucosa from male rat was double-stained for ACADM (acyl-CoA dehydrogenase medium-chain, an enzyme involved in β-oxidation) or GCK (glucokinase, a glycolytic enzyme) (green) with aromatase [arom] (magenta) (c), for ACADM or GCK (green) with ATP4B (H + /K + ATPase, a gastric parietal cell marker; magenta) (d), and for H-FABP (heart-type fatty acid-binding protein [FABP]), GLUT1 (glucose transporter 1), or I-FABP (intestinal FABP) (green) with ATP4B (magenta) (e). Bars: (main panels) 50 µm; (insets) 10 µm.
Fig. 2
Fig. 2. Blood estrogen levels increase as blood triglyceride levels rise in males.
a and b Male rats (8 weeks old, deprived of food for 4 h) were orally administered olive oil (2.5 mL per kg body weight) or control water (control) using the gavage technique. Triglyceride (TG), E2 and cholesterol (Chol) levels in the tail venous blood were measured before (0) and at 1, 2, 3, 4, 5 h after the administration (olive oil: n = 13, control: n = 8, a). TG and E2 levels in the tail venous blood were measured at 2 h after the administration (olive oil: n = 37, control: n = 21, b, left), and the correlation diagram between the blood TG and E2 levels (n = 58, b, right). c Male rats (8 weeks old, deprived of food for 18 h) were orally administered glucose (2 g per kg body weight, n = 10) or control water (n = 9). Glucose, E2, and TG in the tail venous blood were measured before (0) and at 0.5, 1, 1.5, 2, 3, 4, and 5 h after the administration. n number of rats. Data were mean ± s.d. P values determined by two-sided Student’s t-test at 2 h (a, b, left) or 1 h (c) after the administration. b, right, R and P values determined by Pearson’s product-moment correlation with 95% density ellipse.
Fig. 3
Fig. 3. Stomach secretes estrogen in response to the blood triglyceride levels in males.
a Male rats (8 weeks old, deprived of food for 4 h) were orally administered olive oil (2.5 mL per kg body weight, n = 16) or control water (n = 10). TG levels in the tail venous blood and E2 levels in the stomach tissues were measured at 2 h after the administration (left), and the correlation diagram between the blood TG and stomach E2 levels (n = 26, right). b GX male rats (8 weeks old, operated 5 days before, deprived of food for 4 h) were orally administered olive oil (5 mL per kg body weight, n = 14) or control water (n = 13). TG and E2 levels in the tail venous blood measured before (0) and at 1, 2, 3, 4, and 5 h after the administration (left), and the correlation diagram between the blood TG and E2 levels at 2 h after the administration (n = 27, right). n number of rats. Data were mean ± s.d. a left and b left, P values determined by two-sided Student’s t-test at 2 h after the administration. a right and b right, R and P values determined by Pearson’s product-moment correlation with 95% density ellipse.
Fig. 4
Fig. 4. Blood estrogen levels and production of gastric estrogen are directly regulated by blood triglyceride levels in males.
a Male rats (8 weeks old, deprived of food for 4 h) were intravenously injected with soy oil emulsion (2 mL of 20 % soy oil emulsion per kg body weight, n = 10) or control saline (control, n = 10). TG and E2 levels in the tail venous blood were measured before (0) and at 0.1, 0.5, 1, 1.5, 2, 3, 4, and 5 h after the injection. b Isolated gastric gland epithelium from male rats. c Gastric mucosa of the male rat was double-stained for GPR120 (G-protein-coupled receptor 120) or CD36 (cluster of differentiation 36) (green) with ATP4B (magenta). d Isolated epithelium from male rat (deprived of food for 4 h) was incubated in DMEM with or without testosterone (20 nM) or lauric acid (500 µM) at 37 °C for 1 h. E2 levels, normalized by phospholipid, were compared to those incubated with 20 nM testosterone but without lauric acid (n = 9). n number of rats. Data were mean ± s.d. a (0.5 h) and d, P values determined by two-sided Student’s t-test. Bars: (main panels) 50 µm; (insets) 10 µm.
Fig. 5
Fig. 5. Stomach of OVX female rats, like of male rats, secretes estrogen in response to the blood triglyceride levels.
a Gastric mucosa from an OVX female rat (8 weeks old, operated 14 days before) was double-stained for ACADM or GCK (green) with aromatase [arom] or ATP4B (magenta). b OVX female rats, deprived of food for 4 h, were orally administered olive oil (2.5 mL per kg body weight, n = 9) or control water (n = 9). TG and E2 levels in the tail venous blood measured before (0) and at 1, 2, 3, 4, and 5 h after the administration (left), and the correlation diagram between the blood TG and E2 levels at 2 h after the administration (n = 18, right). c Isolated epithelium from OVX female rat (deprived of food for 4 h) was incubated in DMEM with or without testosterone (20 nM) or lauric acid (500 µM) at 37 °C for 1 h. E2 levels, normalized by phospholipid, were compared to those incubated with 20 nM testosterone but without lauric acid (n = 10). n number of rats. Data were mean ± s.d. b left (2 h) and c P values determined by two-sided Student’s t-test. b right, R and P values determined by Pearson’s product-moment correlation with 95% density ellipse. Bars: (main panels) 50 µm; (insets) 10 µm.
Fig. 6
Fig. 6. Proposed model for the role of gastric estrogen in maintaining proper blood triglyceride levels.
a Parietal cells in the stomach produce estrogen using fatty acid (triglyceride) as an energy source (NADPH), and secretion of gastric estrogen increases as blood triglyceride levels rise (this study). b Gastric estrogen, secreted into the portal vein, primarily acts on the liver to suppress hepatic de novo lipogenesis. c Gastric estrogen inhibits hypothalamic NPY neurons, whose activation enhances feeding behavior, hepatic de novo lipogenesis, and fatty acid release from adipocytes via sympathetic nerves, –. d Gastric estrogen acts on adipocytes to suppress their de novo lipogenesis and to increase leptin secretion, white adipose tissue (WAT) mass, and adipogenesis. Leptin, in turn, inhibits hypothalamic NPY neurons. e Gastric estrogen increases the lipid uptake and β-oxidation of heart and skeletal muscles. ae When blood triglyceride levels are high, secretion of gastric estrogen increases. Increased estrogen inhibits feeding behavior, de novo lipogenesis, and lipid release from adipose tissues while promoting lipid uptake by WAT and lipid consumption by muscles. As a result, blood triglyceride levels are lowered. Conversely, when blood triglyceride levels are low, secretions of gastric estrogen are decreased to supply more lipid to the circulation.

Similar articles

Cited by

References

    1. Keesey RE, Powley TL. Body energy homeostasis. Appetite. 2008;51:442–445. - PMC - PubMed
    1. Kim K-S, Seeley RJ, Sandoval DA. Signalling from the periphery to the brain that regulates energy homeostasis. Nat. Publ. Group. 2018;19:185–196. - PMC - PubMed
    1. Sato T, et al. Structure, regulation and function of ghrelin. J. Biochem. 2012;151:119–128. - PubMed
    1. Ahima RS, Flier JS. Leptin. Annu. Rev. Physiol. 2000;62:413–437. - PubMed
    1. Maffei, M. & Giordano, A. Leptin, the brain and energy homeostasis: from an apparently simple to a highly complex neuronal system. Rev. Endocr. Metab. Disord.10.1007/s11154-021-09636-2 (2021). - PubMed

Publication types