. 2021 Dec;23(12):1224-1239.
doi: 10.1038/s41556-021-00774-y. Epub 2021 Dec 7.

Aberrant chromatin landscape following loss of the H3.3 chaperone Daxx in haematopoietic precursors leads to Pu.1-mediated neutrophilia and inflammation

Affiliations

Aberrant chromatin landscape following loss of the H3.3 chaperone Daxx in haematopoietic precursors leads to Pu.1-mediated neutrophilia and inflammation

Julia P Gerber et al. Nat Cell Biol. 2021 Dec.

Erratum in

Abstract

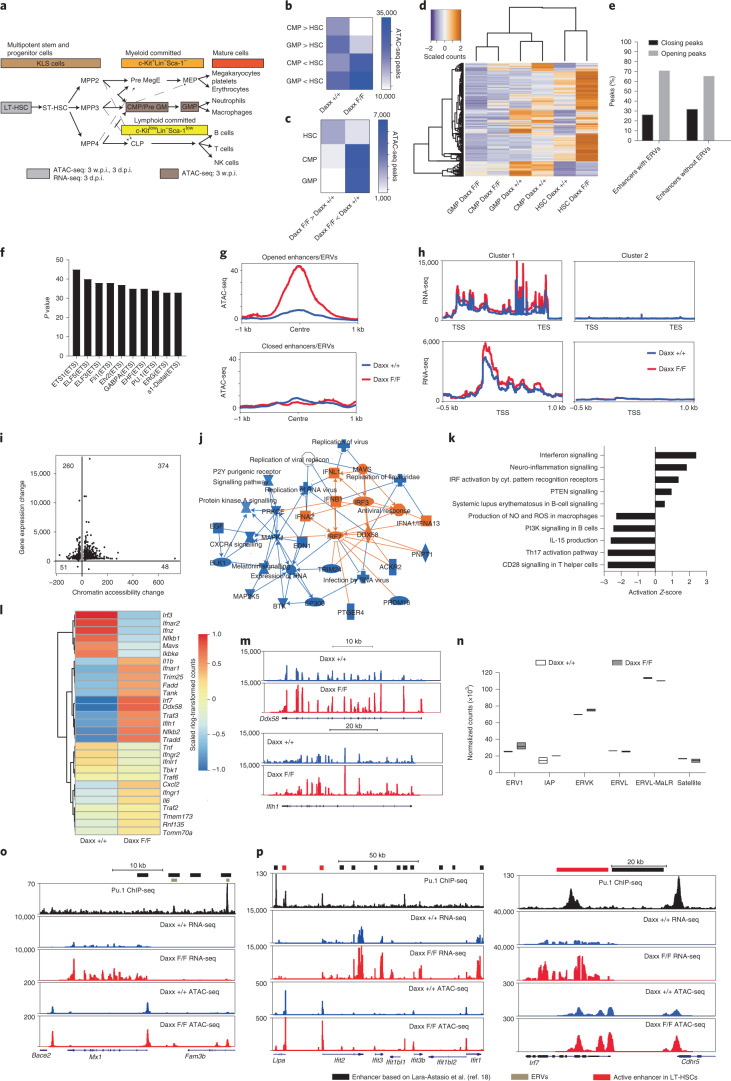
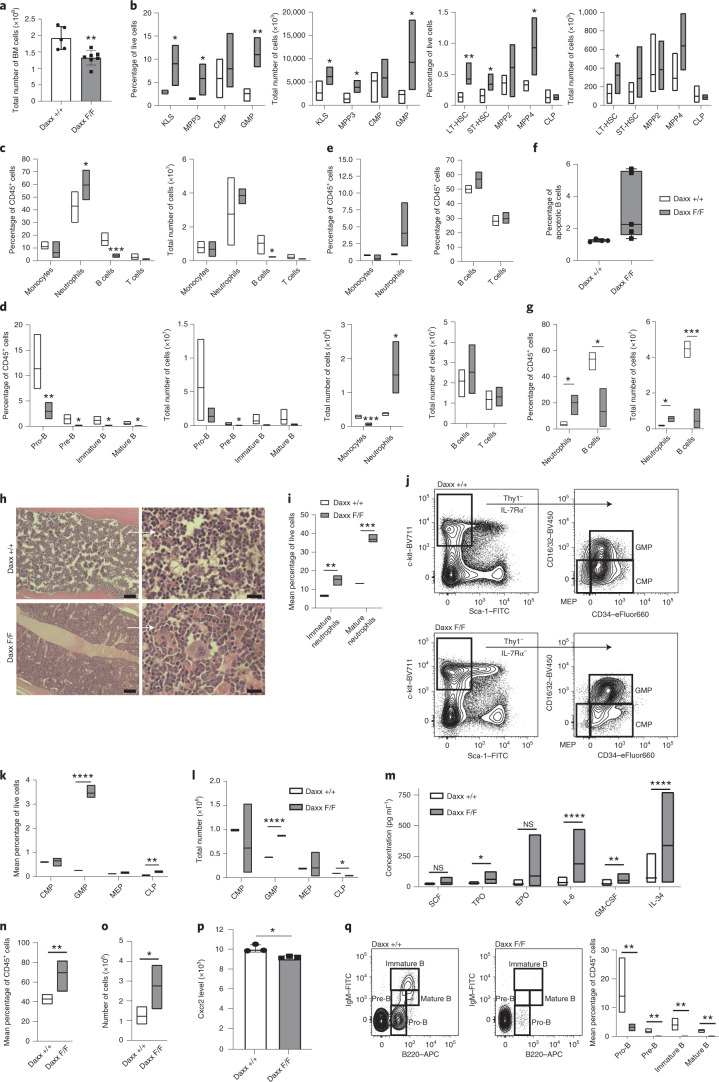
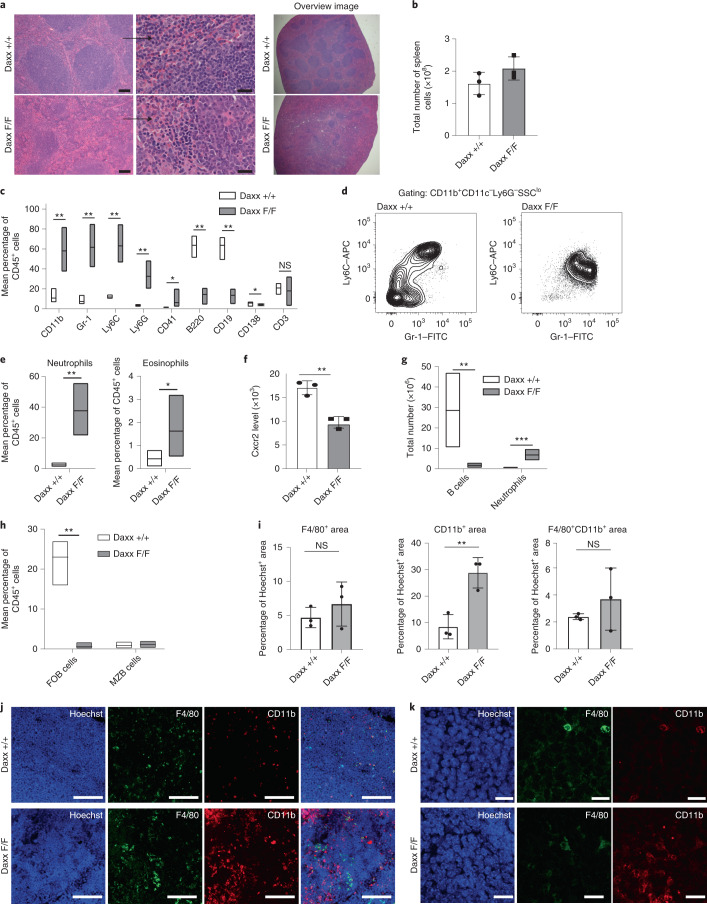
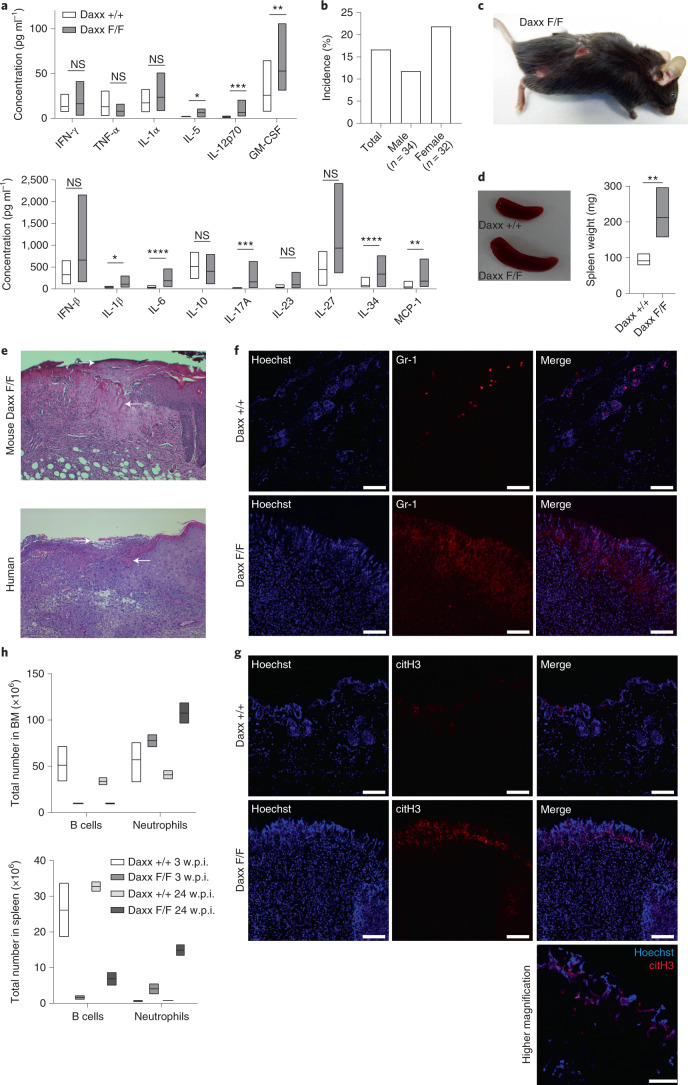
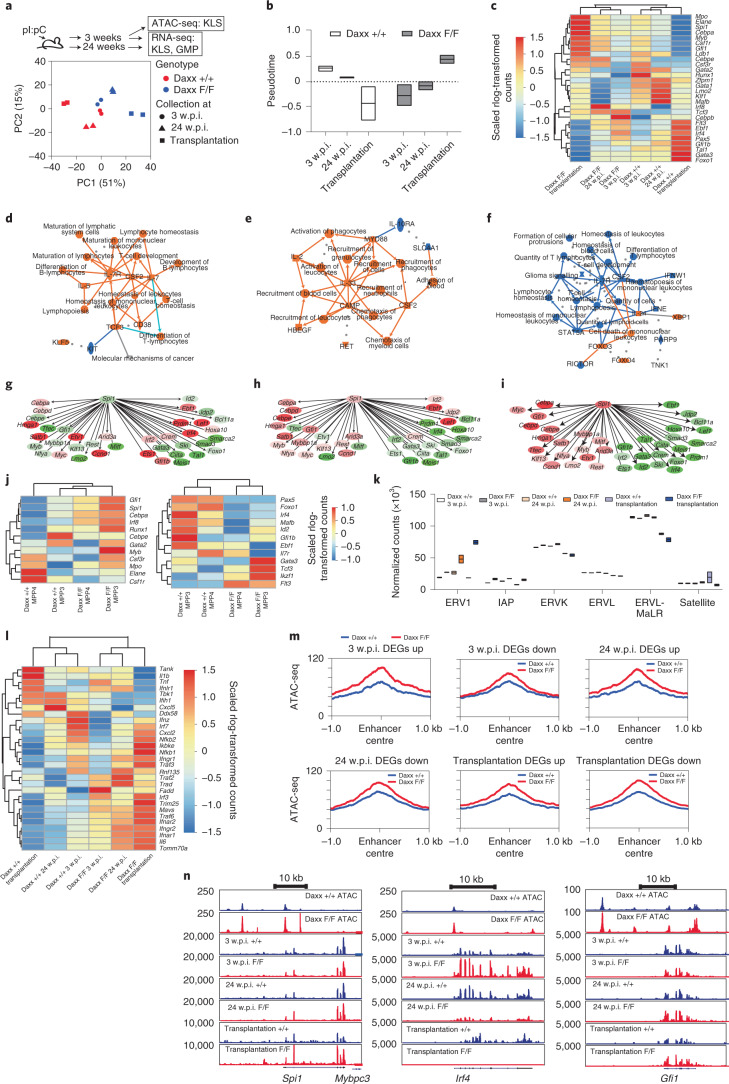
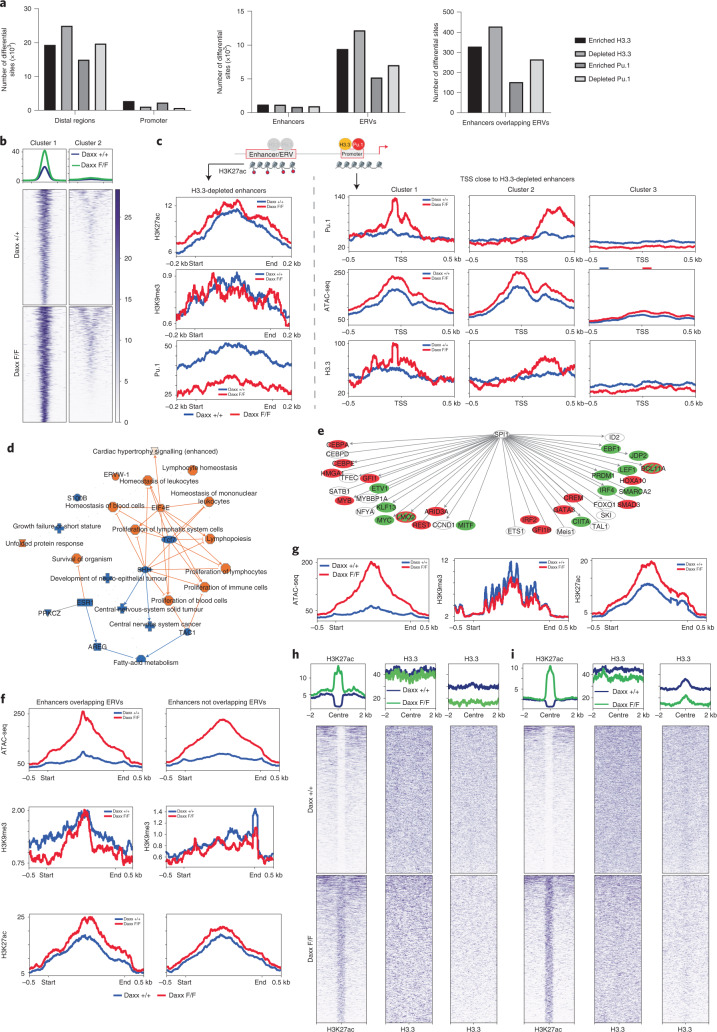
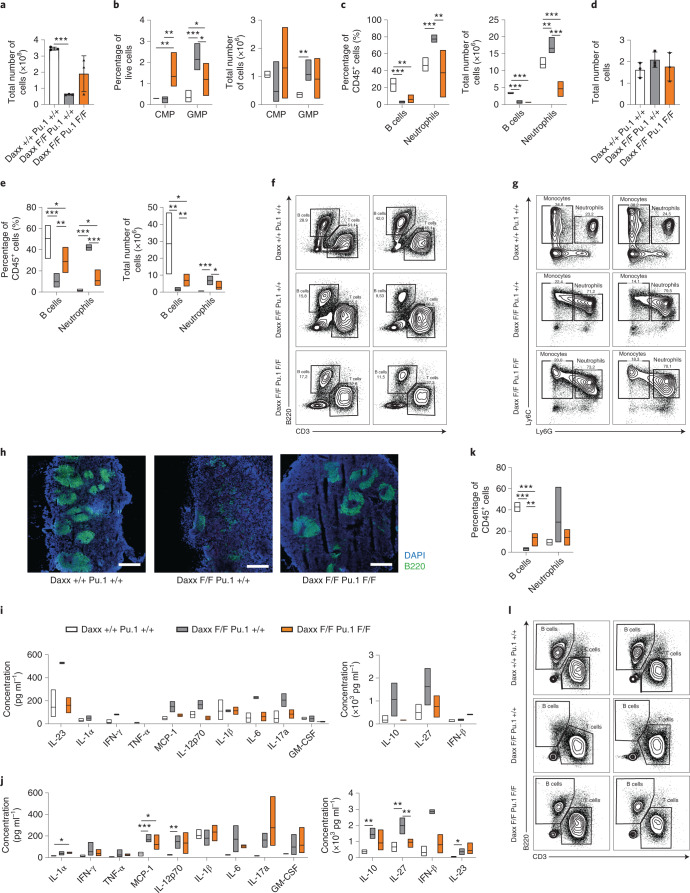
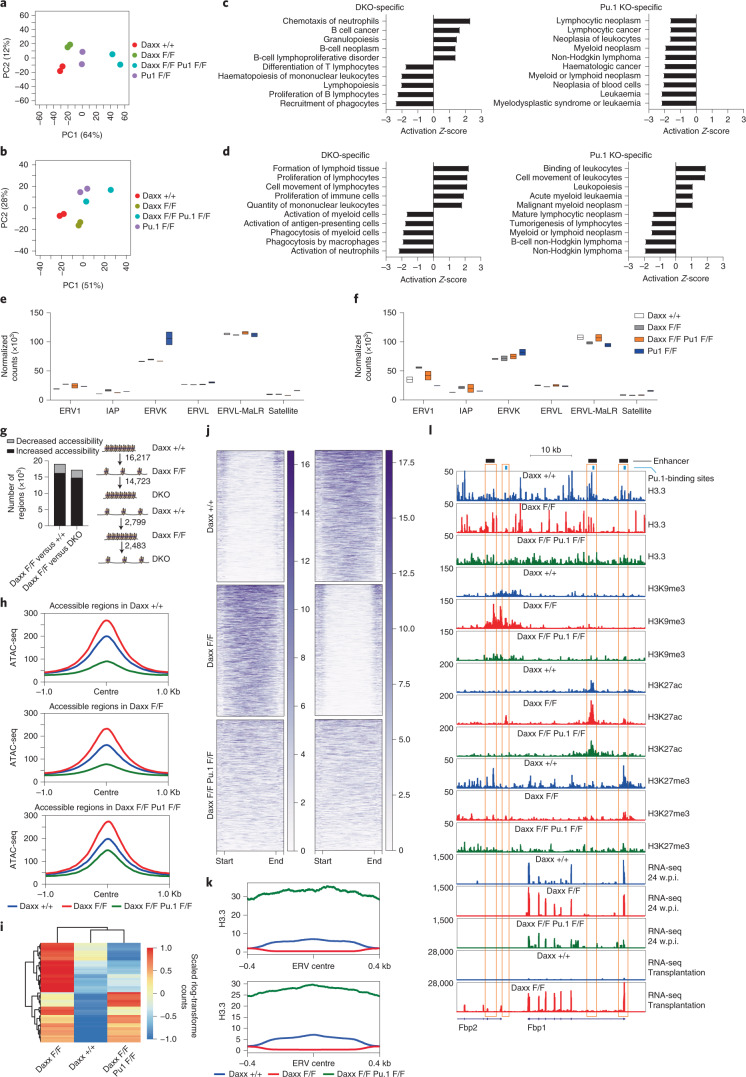
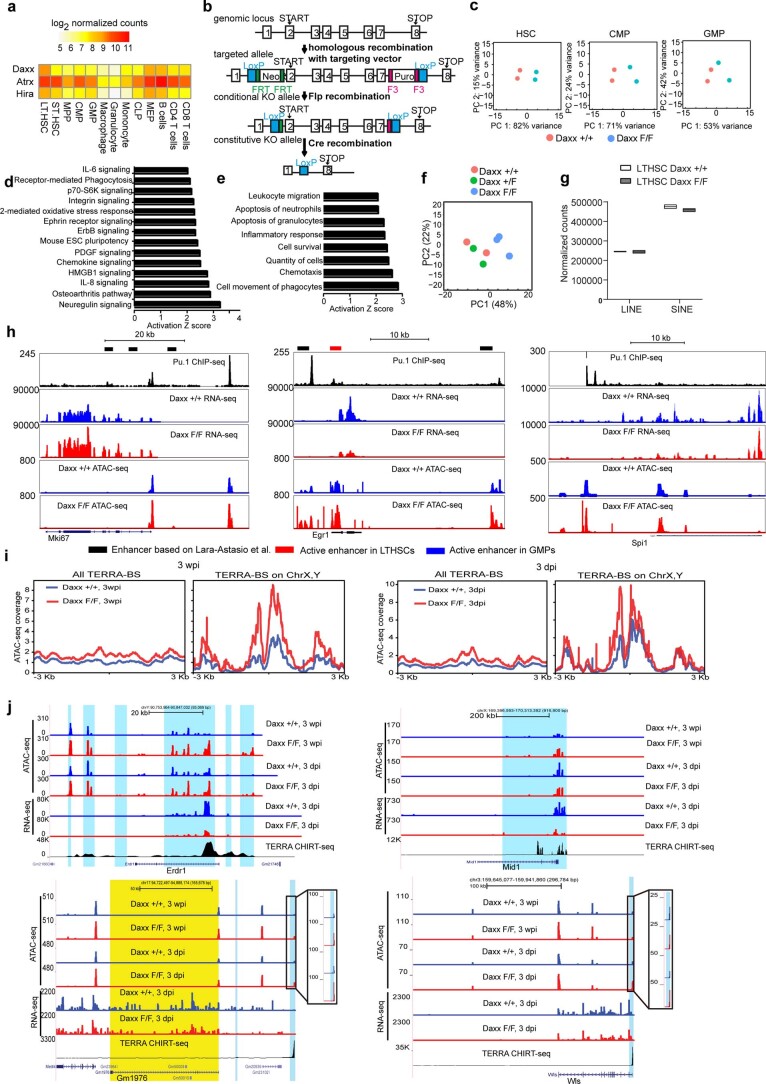
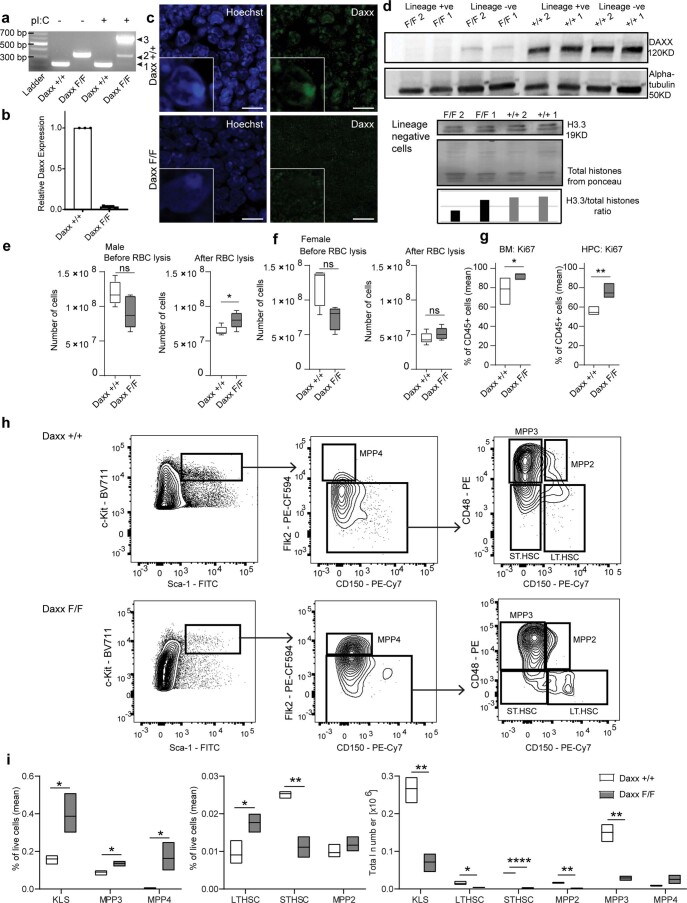
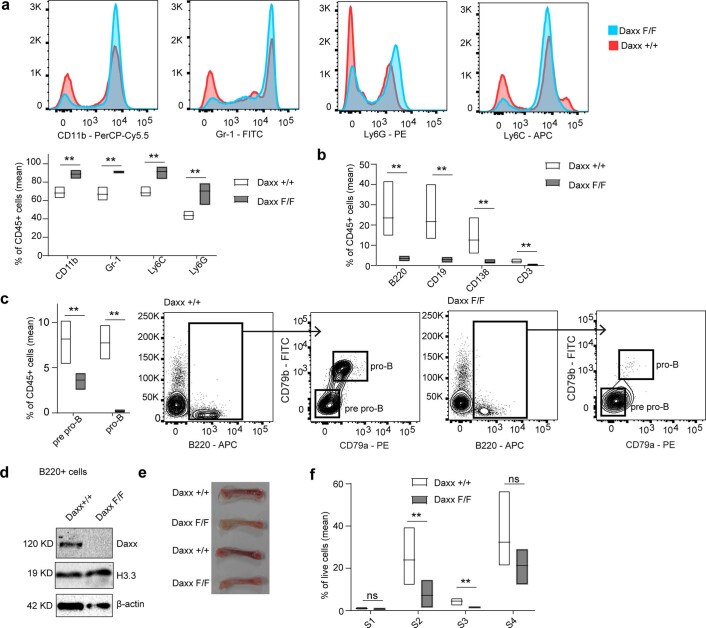
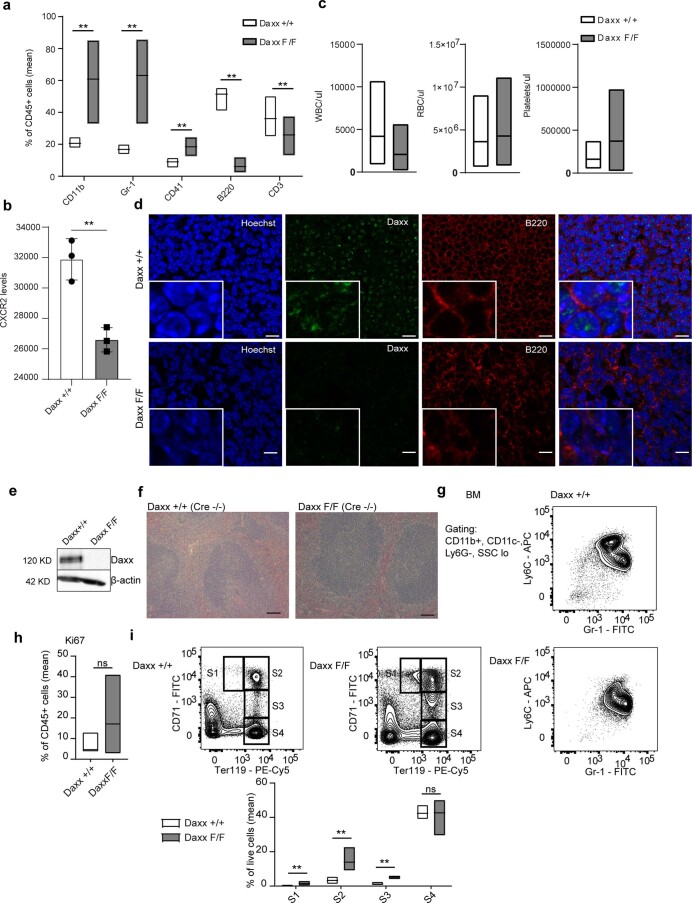
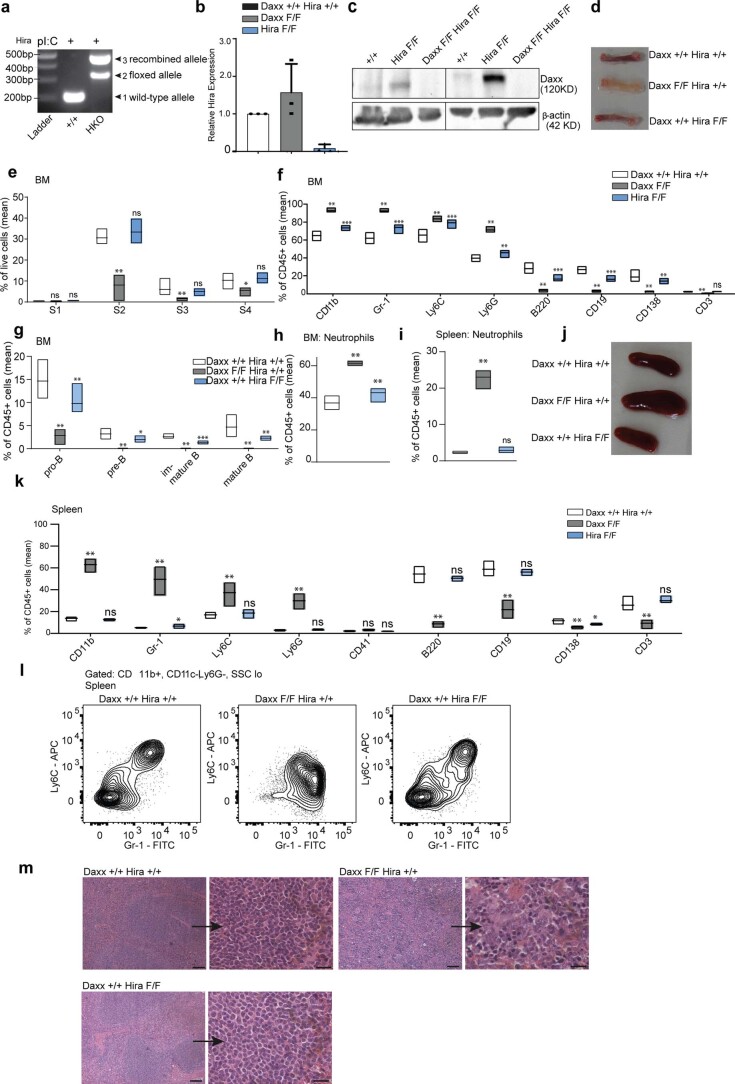
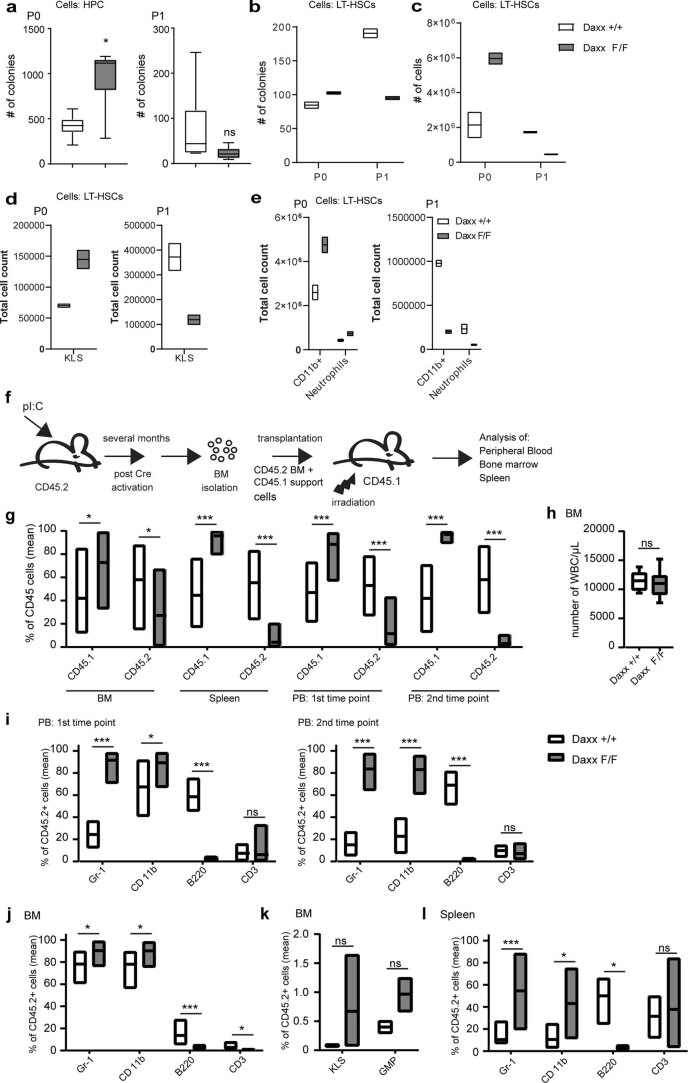
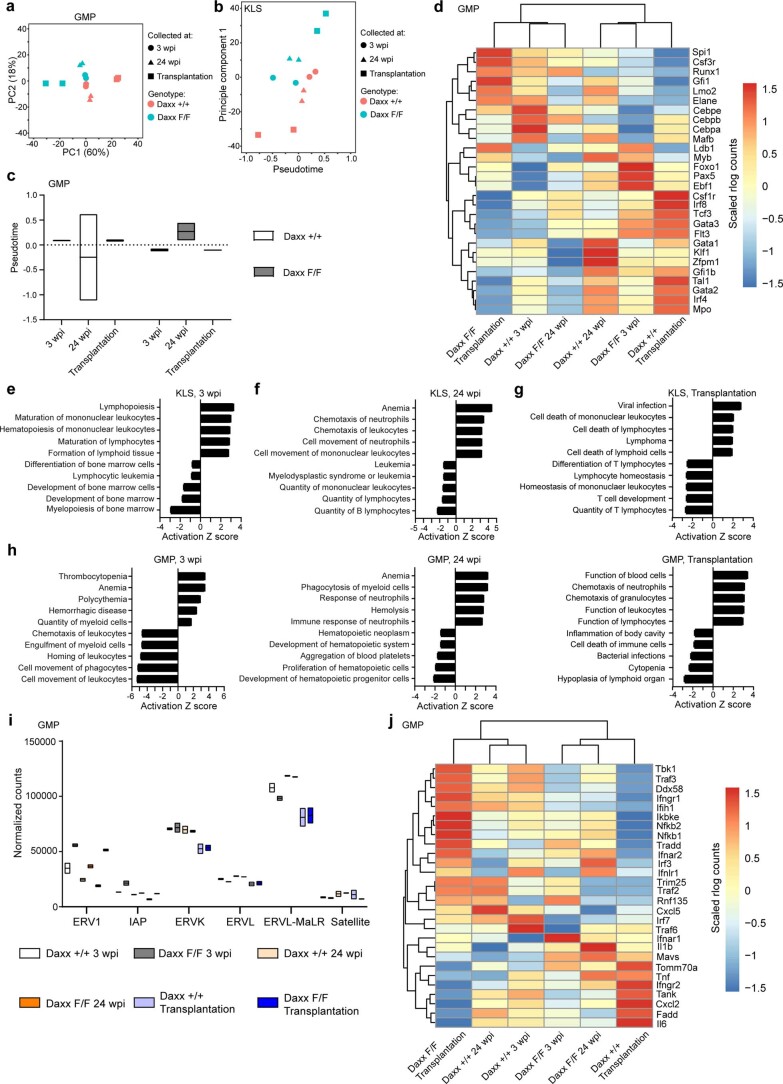
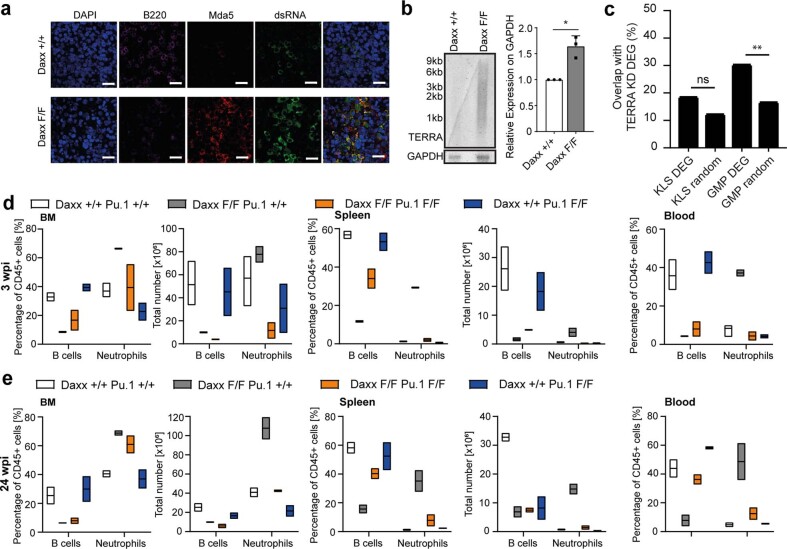
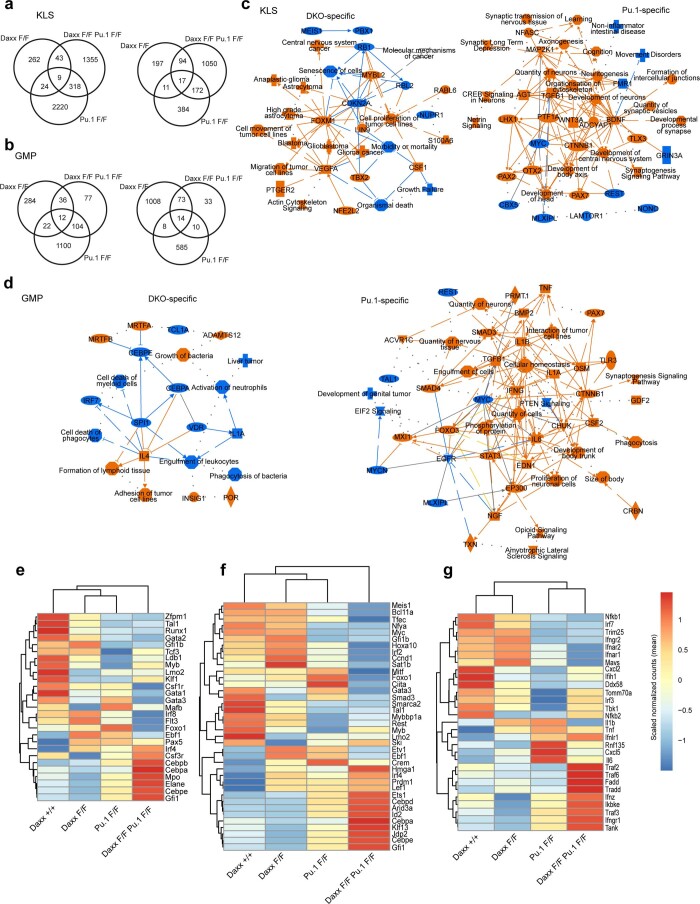
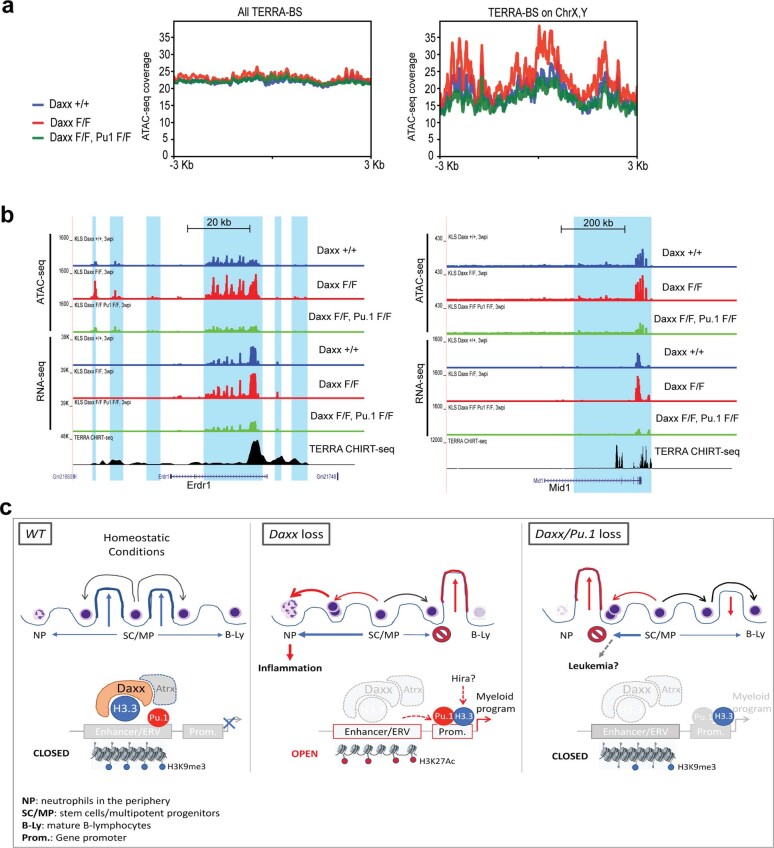
Defective silencing of retrotransposable elements has been linked to inflammageing, cancer and autoimmune diseases. However, the underlying mechanisms are only partially understood. Here we implicate the histone H3.3 chaperone Daxx, a retrotransposable element repressor inactivated in myeloid leukaemia and other neoplasms, in protection from inflammatory disease. Loss of Daxx alters the chromatin landscape, H3.3 distribution and histone marks of haematopoietic progenitors, leading to engagement of a Pu.1-dependent transcriptional programme for myelopoiesis at the expense of B-cell differentiation. This causes neutrophilia and inflammation, predisposing mice to develop an autoinflammatory skin disease. While these molecular and phenotypic perturbations are in part reverted in animals lacking both Pu.1 and Daxx, haematopoietic progenitors in these mice show unique chromatin and transcriptome alterations, suggesting an interaction between these two pathways. Overall, our findings implicate retrotransposable element silencing in haematopoiesis and suggest a cross-talk between the H3.3 loading machinery and the pioneer transcription factor Pu.1.


Conflict of interest statement

The authors declare no competing interests.

Figures

Fig. 1
Fig. 1. Daxx loss alters the chromatin landscape and transcription in LT-HSCs.
a, Overview scheme of haematopoiesis. ST-HSC, short-term haematopoietic stem cells; MegE, megakaryocyte-erythrocyte; MEP, megakaryocyte-erythrocyte progenitor; GM, granulocyte-monocyte. b, Heatmap of the number of distal peaks that were open or closed in CMPs (open, 8,753 in Daxx-KO and 18,194 in Daxx-WT cells; closed, 28,724 in Daxx-KO and 18,465 in Daxx-WT cells) and GMPs (open, 12,713 in Daxx-KO and 22,833 in Daxx-WT cells; closed, 33,374 in Daxx-KO and 23,703 in Daxx-WT cells) compared with HSCs. c, Heatmap of enhancer-overlapping distal peaks that were open or closed in Daxx-KO compared with WT cells. b,c, >, open peaks; and <, closed peaks. d, Heatmap showing scaled read counts within the enhancer-overlapping distal peaks that were open in Daxx-KO LT-HSCs compared with WT cells. e, Total number of peaks of LT-HSCs that closed or opened in known enhancers following Daxx KO. f, Top-ten transcription factor motifs enriched in ERV-overlapping enhancer peaks open in Daxx-KO LT-HSCs. g, ATAC-seq coverage around the centre of enhancers overlapping ERVs. h, RNA-seq coverage across gene bodies (left) and around the TSS (right) of genes closest to opened enhancers overlapping ERVs. TES, transcription end site. i, Change in accessibility at enhancers overlapping ERVs versus changes in gene expression of the closest gene. Numbers show the total number of enhancer-gene pairs per quadrant. j, Summary plot of IPA analysis for the RNA-seq of LT-HSCs. Predicted activation of protein or biofunction is indicated in orange and predicted inhibition of the displayed protein or biofunction in blue. k, Top-five activated and repressed IPA canonical pathways. Data are the activation Z-scores from IPA Fisher’s exact tests with multiple testing-adjusted P< 0.05. Activation Z-score > 2, increased activation; activation Z-score < −2, increased inhibition. cyt., cytoplasmic. l, Heatmap showing expression of interferon-responsive genes and dsRNA-recognition machinery in LT-HSCs. m, Genome browser tracks of the Ddx58 (top) and Ifih1 (bottom) genes. Transcript structure and position are shown below. n, Counts per million of repeat-element families in the LT-HSC RNA-seq data. Boxplots show the minimum and maximum values (box boundaries) and the mean (horizontal line). o, Genome browser track of the Mx1 gene regulatory region. Transcripts within the region are shown below. p, Genome browser tracks of the Irf7 (right) and Ifit (left) gene clusters. Transcripts within the clusters are shown below. HSC/LT-HSC, long-term haematopoietic stem cells. af, n = 2 independent biological samples analysed at 3 w.p.i. gp, n = 2 (Daxx+/+ and Daxx+/F) and 3 (Daxx KO) independent biological samples collected at 3 d.p.i. Daxx F/F, Daxx KO and Daxx +/+, Daxx WT. Numerical source data are provided. Source data
Fig. 2
Fig. 2. Acute and chronic Daxx loss lead to perturbations of haematopoiesis.
a, Total number of cells (n = 5 WT and 7 Daxx-KO mice). b, Frequency and total cell number of stem, multipotent and progenitor populations (n = 4 WT and 5 Daxx-KO mice). c, Frequency and total cell number of mature lymphoid and myeloid cells(n = 6 WT and 7 Daxx-KO mice). d, Frequency and total cell numbers of B cell-progenitor populations (n = 4 WT and 5 Daxx-KO mice). e, Frequency and total counts of mature lymphoid and myeloid cells (n = 4 mice per genotype). f, Frequencies of apoptotic B cells (n = 4 WT and 5 Daxx-KO mice). g, Frequency and total cell numbers of B cells and neutrophils at 2 w.p.i. (n = 3 mice per genotype). h, Representative images of haematoxilin and eosin (H&E) staining of bones (n = 2 independent experiments). Scale bars, 100 µm (left) and 20 µm (right; higher-magnification images). i, Frequencies of immature and mature neutrophils (Gr1+CD11b+ cells; n = 3 mice per genotype). j, Examples of the flow cytometry analysis of myeloid progenitor cells. k,l, Frequency (k) and total count (l) of haematopoietic progenitors (n = 3 mice per genotype). m, Concentration of different cytokines in plasma (n = 6 mice per genotype; analysis of variance and corresponding non-parametric Conover’s test). TPO, thrombopoietin. n, Frequencies of neutrophils (n = 6 mice per genotype; non-parametric Mann–Whitney test). o, Number of neutrophils (n = 5 mice per genotype; non-parametric Mann–Whitney test). p, Cxcr2 levels measured in mature neutrophils (n = 3 mice per genotype). MFU, mean fluorescent units. q, Examples of flow cytometry analysis of B cell progenitors and frequencies of B cells and progenitors (right; n = 6 mice per genotype; non-parametric Mann–Whitney test). ag, RosaCreERT2 mice. hq, Mx1Cre mice. ad,il,nq, BM. eg, Spleen. ag,i,k,l,p, Student’s t-test. bg,i,ko, Boxplots show the minimum and maximum values (box boundaries) and the mean (horizontal line). a,p, Data are the mean ± s.d. *P < 0.05, **P < 0.01, ***P < 0.001, ****P < 0.0001 and NS, not significant. Daxx F/F, Daxx KO and Daxx +/+, Daxx WT. Exact P values and numerical source data are provided. Source data
Fig. 3
Fig. 3. Daxx-deficient spleens display marked structural changes linked to an increase of neutrophils and reduction of B cells.
a, Representative images of H&E-stained spleen sections (n = 3 independent experiments). Scale bars, 100 µm (left) and 20 µm (middle; higher-magnification images). Overview images of the section are shown (right). b, Total number of spleen cells (n = 3 mice per genotype). c, Flow cytometry analysis of cell surface markers (n = 6 mice per genotype). d, Flow cytometry plots showing macrophage- and monocyte-like populations. e, Frequencies of neutrophils (left) and eosinophils (right; n = 5 mice per genotype). f, Cxcr2 levels in mature neutrophils of the spleen (n = 3 mice per genotype). MFU, mean fluorescent units. g, Total B-cell and neutrophil counts in the spleen (n = 5 mice per genotype). h, Frequencies of follicular and marginal-zone B cells (FOB and MZB, respectively; n = 6 mice per genotype). i, Levels of F4/80 (left), CD11b (middle) and combined F4/80 and CD11b (right) fluorescence (n = 3 mice per genotype). j, Immunofluorescence images of spleen sections (n = 3 mice per genotype). Scale bars, 100 µm. k, Magnified views of the images in j. Scale bars, 15 µm. c,e,g,h, Boxplots show the minimum and maximum values (box boundaries) and the mean (horizontal line). b,f,i, Data are the mean ± s.d. *P < 0.05, **P < 0.01 and NS, not significant; Student’s t-test (b,f,g,i) or non-parametric Wilcoxon rank test (c,e,h). Daxx F/F, Daxx KO and Daxx +/+, Daxx WT. Exact P values and numerical source data are provided. Source data
Fig. 4
Fig. 4. Chronic Daxx loss leads to increased inflammatory cytokines and pyoderma gangrenosum, an autoinflammatory neutrophilic disease.
a, Concentrations of cytokines in plasma (n = 6 mice per genotype). b, Incidence of skin lesions in the mice in the total group and stratified by sex. Data are the mean. c, DaxxF/F;Mx1Cre+/− mouse with skin lesions. d, Representative image of the spleens of control and Daxx-KO mice with skin lesions (left), and the spleen weight of mice with skin lesions (right; n = 6 mice per genotype). e, Skin lesion of a DaxxF/F;Mx1Cre+/− mouse (top; n = 3 biological replicates) compared with a human skin biopsy of a patient with pyoderma gangrenosum (bottom). Representative images of H&E-stained sections; the arrows indicate the site of the ulcer and fibrin layer. f, Immunofluorescence staining of Gr-1+ cells in sections of skin lesions (n = 2 independent experiments). Scale bars, 100 µm. g, Immunofluorescence staining of sections of skin lesions with citH3 (n = 2 independent experiments). The higher-magnification image (bottom) shows NETosis in a DaxxF/F;Mx1Cre+/− skin lesion. Scale bars, 100 µm and 20 µm (higher-magnification image). h, Number of B cells and neutrophils in the BM (top) and spleen (bottom) at 3 and 24 w.p.i. (n = 2 mice per genotype, except for WT at 3 w.p.i., where n = 4 mice). a,h, Boxplots show the minimum and maximum values (box boundaries) and the mean (horizontal line). *P < 0.05, **P < 0.01, ***P < 0.001, ****P < 0.0001 and NS, not significant; non-parametric Wilcoxon rank test. Daxx F/F, Daxx KO and Daxx +/+, Daxx WT. Exact P values and numerical source data are provided. Source data
Fig. 5
Fig. 5. Daxx loss affects the transcriptome of haematopoietic progenitors in the context of both steady-state and stress haematopoiesis.
RNA-seq analysis of Daxx+/+;Mx1Cre+/− and DaxxF/F;Mx1Cre+/− KLS cells isolated at 3 and 24 w.p.i. or from transplanted animals. a, Experimental scheme for cells isolated from pI:pC-treated mice (top) and PCA of the top-500 most variable genes (bottom). b, Mean pseudotime for each sample group (n = 2 mice per genotype). c, Heatmap showing scaled expression of selected transcription factors and regulators involved in blood-cell differentiation (n = 2 mice per genotype). d, Summary plot of IPA analysis of DEGs at 3 w.p.i. e, Summary plot of IPA analysis of DEGs at 24 w.p.i. f, Summary plot of IPA analysis of DEGs in KLS cells from transplanted animals. df, Predicted activation of protein or biofunction is indicated in orange and predicted inhibition of the displayed protein or biofunction in dark and light blue, respectively. Grey dotted lines are machine learning-based inferred connections. g, Expression changes, at 3 w.p.i., of the transcription factor genes regulated by Pu.1. h, Expression changes, at 24 w.p.i., of transcription factor genes regulated by Pu.1. i, Expression changes of the transcription factor genes regulated by Pu.1 in KLS cells isolated from transplanted mice. gi, Upregulated genes are shown in red and downregulated genes in green. A stronger colour intensity indicates higher absolute log2-transformed fold changes. j, Heatmaps showing myeloid- or lymphoid-driving transcription factors for MPP3 and MPP4 cells. k, Normalized read counts of ERV/RTE subtypes and satellite repeats (n = 2 mice per genotype). l, Heatmap showing expression of interferon-responsive genes and dsRNA-recognition machinery. m, ATAC-seq read coverage at enhancers overlapping ERVs close to genes that are up- or downregulated in KLS cells collected at 3 and 24 w.p.i. or from transplanted animals. n, Genome browser tracks of the regulatory regions of Spi1, Irf4 and Gfi1 showing ATAC-seq and RNA-seq coverage. Transcripts of genes of the depicted region are shown below. b,k, Boxplots show the minimum and maximum values (box boundaries) and the mean (horizontal line). Daxx F/F, Daxx KO and Daxx +/+, Daxx WT. Numerical source data provided. Source data
Fig. 6
Fig. 6. Daxx-deficient progenitors display alterations in H3.3 and Pu.1 genome-wide distribution as well as epigenetic marks.
a, Overview of altered H3.3 distribution and Pu.1 binding in Daxx-KO HSPCs determined by CUT&Tag assays. b, Heatmaps of ATAC-seq read distribution around the centre of H3.3-depleted enhancers. c, H3K27ac, H3K9me3 and Pu.1 CUT&Tag read distribution across H3.3-depleted enhancers (left) as well as Pu.1, ATAC-seq and H3.3 coverage around the TSS of genes close to H3.3-depleted enhancers (right). Pu.1 coverage was stratified into three clusters by k-means and ATAC-seq read distribution was plotted for the same clusters of TSS. d, Summary plot of IPA analysis for genes close to distal regions with altered Pu.1 binding. Predicted activation of the protein or biofunction is indicated in orange and predicted inhibition of the displayed protein or biofunction in blue. e, Graphical depiction of Pu.1-binding changes at distal or proximal sites close to transcription factors regulated by Pu.1. The regions with increased Pu.1 binding are shown in red and regions with decreased Pu.1 binding in green. f, Enrichment plots for ATAC-seq, H3K9me3 CUT&Tag and H3K27ac CUT&Tag at enhancers overlapping and not overlapping ERVs with increased accessibility. g, Enrichment plots for ATAC-seq, H3K9me3 CUT&Tag and H3K27ac CUT&Tag at ERVs with increased accessibility. h, Heatmaps of enhancers with increased H3K27ac showing cluster analysis with H3.3. i, Heatmaps of ERVs with increased H3K27ac showing cluster analysis with H3.3. h,i, The legend for the heatmaps is the same as b and middle graphs show cluster of enhancers or ERVs/RTEs with no difference in H3.3 while right graphs show those with reduced H3.3 loading. Daxx F/F, Daxx KO and Daxx +/+, Daxx WT. Numerical source data are provided. Source data
Fig. 7
Fig. 7. Concomitant loss of Daxx and Pu.1 partially restores lymphopoiesis while suppressing peripheral accumulation of neutrophils.
a, Total BM cell counts (n = 3 mice per genotype) in four leg bones per animal. b, Percentage (left) and number (right) of CMPs and GMPs in the BM (n = 5 mice per genotype). c, Percentage (left) and number of B cells and neutrophils in the BM (n = 5 mice per genotype). d, Total spleen cell counts (n = 3 mice per genotype). e, Percentage (left) and number (right) of B cells and neutrophils in the spleen (n = 5 mice per genotype). f, Flow cytometry plots showing B and T cell-like populations in the spleen. g, Flow cytometry analysis showing neutrophil- and monocyte-like populations in the spleen. f,g, The percentages of cells in the gated regions of the plots are indicated. h, Representative immunofluorescence overview images of spleens stained with 4,6-diamidino-2-phenylindole (DAPI) and B220 (n = 2 independent experiments). Scale bars, 500 µm. i, Inflammatory cytokine levels in plasma at 3 w.p.i. (n = 5 WT and 2 Daxx-KO and DKO mice). j, Inflammatory cytokine levels in plasma at 8 w.p.i. (n = 5 mice per genotype). k, Percentage of B cells and neutrophils in the PB (n = 5 mice per genotype). l, Flow cytometry plots showing B and T cell-like populations in PB (n = 5 mice per genotype). a,d, Data are the mean ± s.d. b,c,e,kj, Boxplots show the minimum and maximum values (box boundaries) and the mean (horizontal line). *P < 0.05, **P < 0.01, ***P < 0.001 and NS, not significant; Student’s t-test. Daxx F/F, Daxx KO and Daxx +/+, Daxx WT; Pu.1 F/F, Pu.1-KO and Pu.1 +/+, Pu.1 WT. Exact P values and numerical source data are provided. Source data
Fig. 8
Fig. 8. Partial rescue of the biological phenotype is associated with specific perturbations at the transcriptional and chromatin levels.
a, PCA of the top-500 most variable genes in KLS cells collected at 3 w.p.i. b, PCA of the top-500 most variable genes in GMP cells collected at 3 w.p.i. c, Top-five activated or inhibited haematological functions and diseases associated with KLS cells with Daxx and Pu.1 DKO- (left) and Pu.1-KO-specific (right) gene expression changes. d, Top-five activated or inhibited haematological functions and diseases associated with GMP cells with DKO- (left) and Pu.1-KO-specific (right) gene expression changes. c,d, Data are the activation Z-score from IPA Fisher’s exact tests with multiple testing-adjusted P< 0.05. An activation Z-score > 2 suggests increased activation of the indicated biofunctions and an activation Z-score < −2 suggests increased inhibition. e, Normalized read counts of ERV/RTE subtypes and satellite repeats (n = 2 mice per genotype) in KLS cells. f, Normalized read counts of ERV/RTE subtypes and satellite repeats (n = 2 mice per genotype) in GMP cells. e,f, Boxplots show the minimum and maximum values (box boundaries) and the mean (horizontal line). g, Number of regions that were opened or closed in Daxx-KO versus WT (left) and the number of those regions that reverted back to WT condition in DKO KLS cells (right). h, ATAC-seq read distribution around the centre of IDR-reproducible peaks identified in WT (top), Daxx-KO (middle) and DKO (bottom) KLS cells. i, Heatmap of scaled normalized RNA-seq read counts for genes upregulated in Daxx single-KO KLS and increased accessibility in nearby enhancers. j, Heatmaps of H3K9me3 enrichment over distal regions segregated in regions gaining or losing H3K9me3. k, H3.3 enrichment plots at enhancers (top) and ERVs (bottom). l, Genome browser coverage plot of the Fbp1 and Fbp2 locus. Daxx F/F, Daxx KO and Daxx +/+, Daxx WT; Pu.1 F/F, Pu.1-KO and Pu.1 +/+, Pu.1 WT. Numerical source data are provided. Source data
Extended Data Fig. 1
Extended Data Fig. 1. Expression of H3.3 chaperones in haematopoietic cells, creating Daxx F/F mice and analysis of LT-HSC ATAC-seq and RNA-seq data.
a, Heatmap of Daxx, Atrx and Hira expression levels (data from). b, Daxx genomic locus, Daxx floxed locus following homologous recombination, conditional KO allele following deletion of the FRT-flanked or F3-flanked Neomycin (NeoR) and Puromycin (PuroR) resistance gene; Cre-mediated deletion of Daxx exons 2-7. c, PCA for ATAC-seq data (3 w.p.i.; top-500 most variable peaks): displayed principal components (PC) 1 versus 2. d, Enriched IPA immune system-related canonical pathways for ERV-overlapping enhancer peaks that open upon Daxx KO in LT-HSCs (3 w.p.i.). e, Enriched IPA immune system-related biofunctions for ERV-overlapping enhancer peaks that open upon Daxx KO in LT-HSCs (3 w.p.i.). f, PCA plot for LT-HSC RNA-seq data (3 d.p.i.). g, Counts per million of LINE and SINE elements in LT-HSCs (3 d.p.i.). h, Genome browser tracks of the regulatory region of Spi1, Mki67 and Egr1 (3 d.p.i.). i, ATAC-seq coverage around TERRA-BS across all chromosomes or across sex chromosomes at 3 w.p.i. and 3 d.p.i. j, Genome browser tracks for wild-type (blue) and Daxx KO (red) LT-HSCs (ATAC-seq: 3 w.p.i. and 3 d.p.i.; RNA-seq: 3 d.p.i.) around Erdr1, Mid1, Gm1976 and Wls; TERRA CHIRT-seq based on published data. Light-blue regions are called TERRA binding sites and yellow region highlights the Gm1976 gene. For Gm1976 and Wls boxes show ATAC-seq coverage at the major TERRA binding site. LT.HSC, long-term haematopoietic stem cells; ST.HSC, short-term haematopoietic stem cells; MPP, multipotent progenitor; CMP, common myeloid progenitor; GMP, granulocyte-monocyte progenitor; CLP, common lymphoid progenitor; MEP, megakaryocyte erythroid progenitor. n = 2 independent biological samples analysed 3 weeks post induction with tamoxifen (ce, i, j). Analysis of gene expression and chromatin accessibility of LT-HSCs from n = 2 Daxx + /+ and Daxx + /F as well as n = 3 Daxx F/F samples collected 3 days post final induction with tamoxifen (f-j). Data are Activation Z-score from IPA Fisher’s exact tests with multiple testing adjusted p-values < 0.05 (d, e). Activation Z-score > 2 suggests increased activation of shown biofunctions. Numerical source data provided in Source data. Source data
Extended Data Fig. 2
Extended Data Fig. 2. Daxx-deficient BM displays increased proliferation and altered stem/progenitor cell frequencies and numbers.
a, Genotyping of Daxx+/+;Mx1Cre+/- and DaxxF/F;Mx1Cre+/- mice untreated (-) or treated with pI:pC (+). Arrows indicate the wild-type, floxed and recombined alleles (n = 5 independent experiments). b, Daxx mRNA levels upon pI:pC treatment in bone marrow. Shown is relative expression of Daxx mRNA over Tbp mRNA levels (n = 3 mice per genotype). c, IF of Daxx in bone marrow, scale bar = 10 µm (n = 4 mice per genotype, two independent experiments). Inlay image zoomed on representative nuclei. d, Western blot of Daxx, alpha-tubulin and H3.3 in Lineage-negative and Lineage-positive bone marrow cells (n = 2 mice per genotype). e, Bone marrow cellularity counts before and after RBC lysis in male mice (n = 5 mice per gender, non-parametric Mann–Whitney test, box-and-whiskers plot: min to max (whiskers), 25th and 75th percentile and median). f, Bone marrow cellularity counts before and after RBC lysis in female mice (n = 5 mice per gender, non-parametric Mann–Whitney test, box-and-whiskers plot: min to max (whiskers), 25th and 75th percentile and median). g, Flow cytometry analysis of Ki-67+ cells in BM and HPCs (n = 5 mice per genotype, repeated in two independent experiments, non-parametric Mann–Whitney test). h,i, Flow cytometry analysis of HSC and MPP populations (n = 3 mice per genotype, repeated in two independent experiments, Student’s t-test). BM, bone marrow; HPC, haematopoietic progenitor cells; HSC, haematopoietic stem cell; MPP, multipotent progenitors. Data in box plots are mean and min to max. ns, not significant; * P < 0.05, ** P < 0.01, *** P < 0.001, **** P < 0.0001. Exact p-values and numerical source data can be found in the accompanying source data. Unprocessed blots provided in Source data. Source data
Extended Data Fig. 3
Extended Data Fig. 3. Daxx deficiency results in myeloid/lymphoid imbalance in the bone marrow.
a, Flow cytometry analysis of myeloid cell surface markers (n = 6 mice per genotype, repeated in three independent experiments). b, Flow cytometry analysis of lymphoid cell surface markers (n = 6 mice per genotype, repeated in three independent experiments). c, Frequencies of B cell progenitors (n = 6 mice per genotype, repeated in three independent experiments. d, Western blot of Daxx, H3.3 and corresponding β-actin control in isolated B220+ cells from bone marrow (n = 3 mice per genotype, repeated in two independent experiments). e, Bones isolated from two Daxx+/+;Mx1Cre and DaxxF/F;Mx1Cre mice. f, Frequencies of erythroblast populations (n = 6 mice per genotype, repeated in three independent experiments. Data in box plots are mean and min to max. ns, not significant; * P < 0.05,d ** P < 0.01, *** P < 0.001, **** P < 0.0001, Wilcoxon rank test. Exact p-values and numerical source data can be found in the accompanying source data. Source image file provided in Source data. Source data
Extended Data Fig. 4
Extended Data Fig. 4. Loss of Daxx leads to neutrophilia and B-cell lymphopenia in the periphery.
a, Flow cytometry analysis of peripheral blood collected 4 weeks post induction (n = 6 mice per genotype, repeated in three independent experiments). b, Cxcr2 levels in mature neutrophils of the blood (n = 3 mice per genotype, Student’s t-test). c, Quantification of WBC, RBC and platelets using Sysmex (n = 3 mice per genotype). d, IF images of spleen stained for Daxx and B220 (n = 2 mice per genotype, repeated in two independent experiments). Scale bar indicates 10 µm. e, Western Blot of Daxx protein in spleen (n = 3 mice per genotype, repeated in three independent experiments). f, H&E stain of spleen sections in Cre-negative animals, scale bar = 100 µm (n = 2 mice per genotype). g, Representative flow cytometry plots showing Gr-1+/Ly6C+ populations in bone marrow upon CD11b+, CD11c-, Ly6G, SSClo gating. h, Frequencies of Ki67+ cells in spleen (n = 5 mice per genotype, repeated in two independent experiments). i, Frequencies of erythroblast populations in spleen (n = 6 mice per genotype, repeated in three independent experiments). Data in box plots are mean and min to max. ns, not significant; * P < 0.05, ** P < 0.01, *** P < 0.001, **** P < 0.0001, Wilcoxon rank test if not otherwise noted. Exact p-values and numerical source data can be found in the accompanying source data. Source image file provided in Source data. Source data
Extended Data Fig. 5
Extended Data Fig. 5. Loss of the H3.3 chaperone Hira has marginal effects on haematopoiesis.
a, Representative images of genotyping results using primers to detect WT, floxed and recombined bands of Hira in bone marrow cells (n = 3 independent experiments). b, Hira mRNA levels upon pI:pC treatment in bone marrow cells. Shown is relative expression of Hira mRNA over Tbp mRNA levels (n = 3 mice per genotype). c, Representative Western blots for Daxx and β-Actin in total bone marrow of Daxx +/+, Hira F/F and Daxx/Hira double KO Mx1Cre mice (n = 3 mice per genotype, repeated in two independent experiments). d, Bones of WT, Daxx KO and Hira KO mice. e, Frequencies of erythroblast populations in bone marrow (WT mice n = 9; Daxx KO n = 3; Hira KO n = 6). f, Flow cytometry analysis of mature cell markers in bone marrow (WT mice n = 9; Daxx KO n = 3; Hira KO n = 6). g, Flow cytometry analysis of B cells in bone marrow (WT mice n = 9; Daxx KO n = 3; Hira KO n = 6). h, Frequencies of neutrophils in bone marrow (WT mice n = 9; DKO n = 3; HKO n = 6). i, Frequencies of neutrophils in spleen (WT mice n = 9; Daxx KO n = 3; Hira KO n = 6). j, Spleens isolated from WT, Daxx KO and Hira KO mice. k, Flow cytometry analysis of mature cells in spleen (WT mice n = 9; Daxx KO n = 3; Hira KO n = 6). l, Flow cytometry plots gated on monocyte- and macrophage-like populations in spleen. m, H&E stain of spleen sections (n = 3 mice per genotype), scale bar = 100 µm. Higher magnification, scale bar = 20 µm. Data produced 3 weeks post pI:pC treatment. Data in box plots are mean and min to max. ns, not significant; * P < 0.05, ** P < 0.01, *** P < 0.001, **** P < 0.0001, Wilcoxon rank test. Exact p-values and numerical source data can be found in the accompanying source data. Source image file provided in Source data. Source data
Extended Data Fig. 6
Extended Data Fig. 6. The haematopoietic phenotype of Daxx deletion is due to a cell-intrinsic defect.
a, Number of colonies after first plating (P0) and first passage (P1) using haematopoietic progenitor cells (n = 5 mice per genotype, repeated in three independent experiments, box-and-whiskers plot: min to max, 25th to 75th percentile and median). b, Number of colonies after first plating (P0) and first passage (P1) using LT-HSCs (n = 2 mice per genotype). c, Number of cells after first plating (P0) and first passage (P1) using LT-HSCs (n = 2 mice per genotype). d, Number of KLS cells and e, number of CD11b + cells and neutrophil-like cells (Ly6C + ,Ly6G + ) after first plating (P0) of LT-HSCs and first passage (P1; n = 2 mice per genotype). f, Schematic representation of the experimental set-up to generate bone marrow chimeras. g, Frequencies of CD45.1+ and CD45.2+ cells in transplanted mice (n = 8 mice per genotype). h, WBC counts in total bone marrow (n = 8 mice per genotype, box-and-whiskers plot: min to max, 25th to 75th percentile and median). i, Flow cytometry analysis in peripheral blood of transplanted mice at two different time points: 1st: 4-5 weeks post transplantation; 2nd pooled data from two independent experiments collected at 8 or 12 weeks post transplantation (n = 8 mice per genotype). j, Frequencies of mature CD45.2+ blood cells in bone marrow of recipient mice (n = 8 mice per genotype, repeated in three independent experiments). k, Frequencies of CD45.2+ KLS and GMPs in bone marrow (n = 4 mice per genotype, repeated in two independent experiments). l, Flow cytometry analysis of CD45.2+ mature blood cells in spleen of recipient mice (n = 8 mice per genotype, repeated in three independent experiments). BM, bone marrow; PB, peripheral blood; KLS, c-Kitpos, lineageneg, Sca-1pos; GMP, granulocyte-monocyte progenitor; P0, first plating; P1, first passage. Data in box plots are mean and min to max. ns, not significant; * P < 0.05, ** P < 0.01, *** P < 0.001, **** P < 0.0001, Wilcoxon rank test. Exact p-values and numerical source data can be found in the accompanying source data. Source data
Extended Data Fig. 7
Extended Data Fig. 7. Gene expression changes in Daxx-deficient haematopoietic progenitors.
a, PCA of the top-500 most variable genes for GMPs. b, Trajectory of gene expression of KLS collected at 3 w.p.i., 24 w.p.i. or from transplanted animals. c, Boxplot showing mean pseudotime for each sample group for GMPs (n = 2 mice per genotype). d, Heatmap showing scaled expression of selected transcription factors and regulators involved in blood cell differentiation (n = 2 mice per genotype). e, Top 5 haematologic biofunctions and diseases altered at 3 w.p.i. in KLS Daxx KO cells. f, Top 5 haematologic biofunctions and diseases altered at 24 w.p.i. in KLS Daxx KO cells. g, Top 5 haematologic biofunctions and diseases altered in KLS Daxx KO cells isolated from transplanted animals. h, Top 5 haematologic biofunctions and diseases altered in GMP Daxx KO cells collected at 3 w.p.i., 24 w.p.i. and from transplanted animals. i, Boxplots of mean normalized read counts of ERV subtypes and satellite repeats (n = 2 mice per genotype) in GMP cells. j, Heatmap showing scaled expression of interferon response genes and the dsRNA recognition machinery for GMPs. Data in box plots are min to max and mean. Numerical source data can be found in the accompanying source data. Source data
Extended Data Fig. 8
Extended Data Fig. 8. Changes in the RNA-sensing machinery and TERRA expression following Daxx loss.
a, IF images of spleens stained for B220, Mda5 and dsRNA (n = 2 independent experiments), scale bar = 20 µm. b, Northern blot autoradiograph showing TERRA levels and quantification analysis (n = 3 mice per genotype, unpaired t-test with Welch’s correction). c, Barplot showing the overlap of differentially expressed genes in TERRA knockdown cells with DEG in our KLS and GMP Daxx KO datasets (transplantation) compared to random genes (Fisher’s Exact Test; **p-value < 0.01, ns, not significant). d, Quantification of B cells and neutrophils in bone marrow, spleen and peripheral blood at 3 weeks post induction (n = 2 mice per genotype). e, Quantification of B cells and neutrophils in bone marrow, spleen and peripheral blood at 24 weeks post induction (n = 2 mice per genotype). Data in box plots are min to max and mean. Exact p-values and numerical source data can be found in the accompanying source data. Source data
Extended Data Fig. 9
Extended Data Fig. 9. RNA-seq data from wild-type, Daxx single KO, Daxx Pu.1 double KO and Pu.1 single KO KLS and GMP cells collected at 3 w.p.i.
a, Venn diagrams of differentially upregulated and downregulated genes in comparison to wild-type KLS. b, Venn diagrams of differentially upregulated and downregulated genes in comparison to wild-type GMP cells. c, IPA graphical summary for KLS Daxx Pu.1 double knock-out specific and Pu.1 single KO specific gene expression changes. d, IPA graphical summary for GMP Daxx Pu.1 double knock-out specific and Pu.1 single KO specific gene expression changes. e, Heatmap showing scaled expression of selected transcription factors and regulators involved in blood cell differentiation (n = 2 mice per genotype). f, Heatmap showing scaled expression of transcription factors regulated by Pu.1 (n = 2 mice per genotype). g, Heatmap showing scaled expression of interferon response genes and the dsRNA recognition machinery (n = 2 mice per genotype). Numerical source data provided in Source data. Source data
Extended Data Fig. 10
Extended Data Fig. 10. Changes in gene expression are associated with increased accessibility at TERRA-BS in sex chromosomes.
a, ATAC-seq coverage around TERRA-BS across all chromosomes or across sex chromosomes at 3 w.p.i. b, Genome browser tracks for wild-type (blue), Daxx KO (red) and Daxx/Pu.1 KO (green) KLS cells at 3 w.p.i. around Erdr1 and Mid1; TERRA CHIRT-seq based on published data. Light-blue regions are called TERRA-BS. c, Proposed model: Daxx contributes to epigenetic barriers restricting fate/identity in haematopoietic stem cells and progenitors thus contributing to balanced differentiation output. Upon Daxx loss, stem cells enter differentiation and produce both myeloid and lymphoid-biased progenitors. However, while myeloid differentiation towards neutrophils is enhanced leading to inflammation, generation of mature B cells is strongly impaired. By inhibiting the pioneer TF Pu.1, the block of B-cell differentiation is partly relieved, while peripheral accumulation of neutrophils is hampered. Given that Pu.1/Daxx DKO progenitors display unique chromatin and transcriptome features and that both Daxx and Pu.1. inactivation/repression are linked to myeloid leukaemia, we hypothesize that loss of both genes may make progenitor cells susceptible to neoplastic transformation.

Comment in

References

    1. Kunarso G, et al. Transposable elements have rewired the core regulatory network of human embryonic stem cells. Nat. Genet. 2010;42:631–634. - PubMed
    1. Chuong EB, Rumi MA, Soares MJ, Baker JC. Endogenous retroviruses function as species-specific enhancer elements in the placenta. Nat. Genet. 2013;45:325–329. - PMC - PubMed
    1. Mita P, Boeke JD. How retrotransposons shape genome regulation. Curr. Opin. Genet. Dev. 2016;37:90–100. - PMC - PubMed
    1. Volkman HE, Stetson DB. The enemy within: endogenous retroelements and autoimmune disease. Nat. Immunol. 2014;15:415–422. - PMC - PubMed
    1. Tugnet N, Rylance P, Roden D, Trela M, Nelson P. Human endogenous retroviruses (HERVs) and autoimmune rheumatic disease: is there a link? Open Rheumatol. J. 2013;7:13–21. - PMC - PubMed

Publication types

MeSH terms

Supplementary concepts