. 2021 Dec;23(12):1314-1328.
doi: 10.1038/s41556-021-00796-6. Epub 2021 Dec 7.

A single-cell transcriptomic landscape of the lungs of patients with COVID-19

Affiliations

A single-cell transcriptomic landscape of the lungs of patients with COVID-19

Si Wang et al. Nat Cell Biol. 2021 Dec.

Abstract

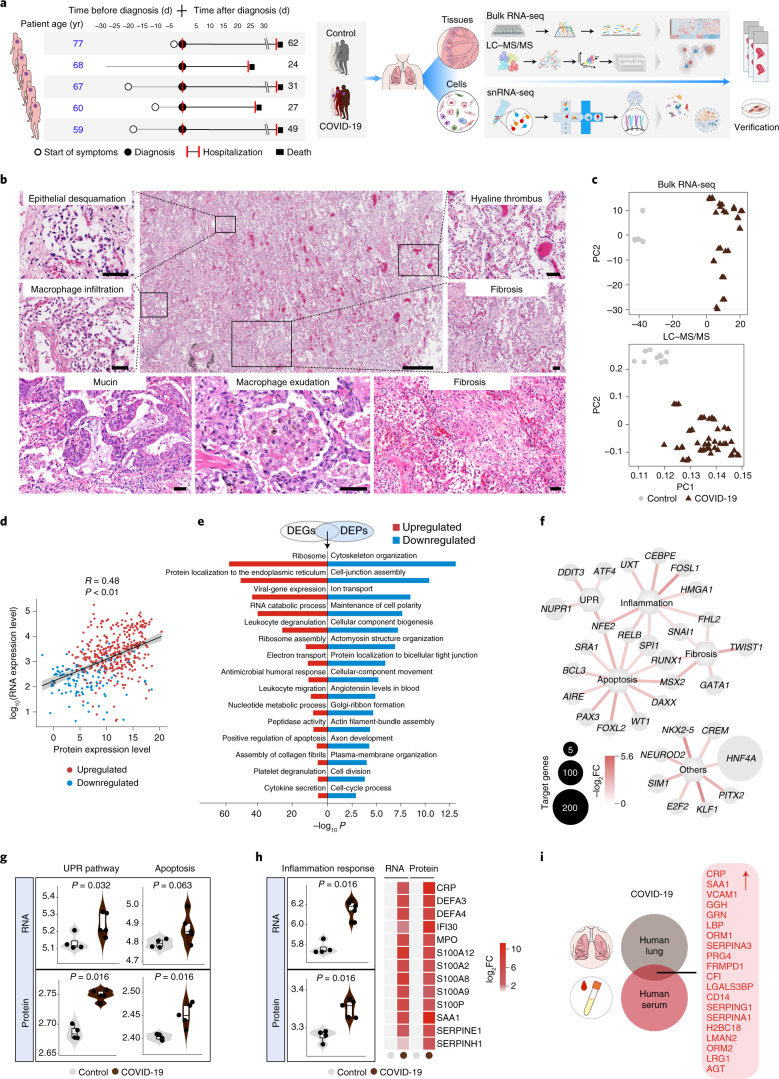
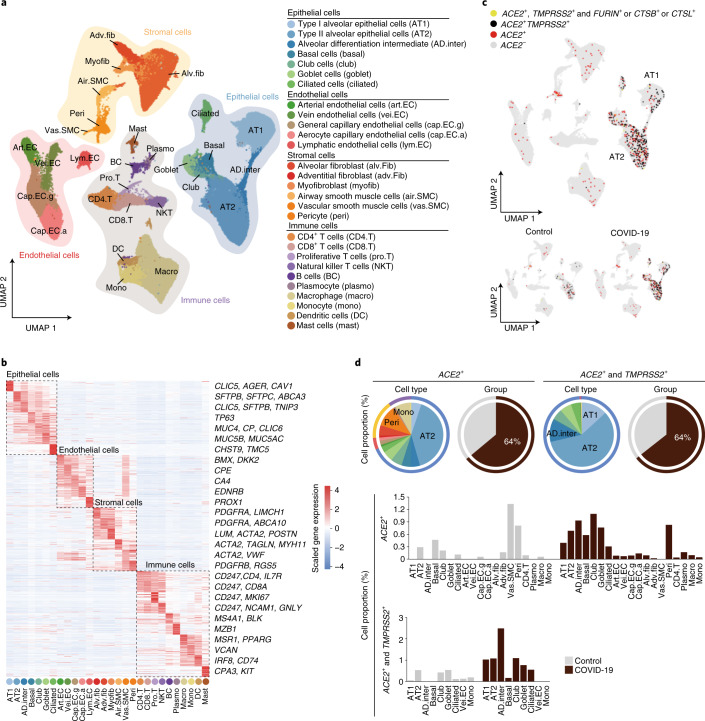
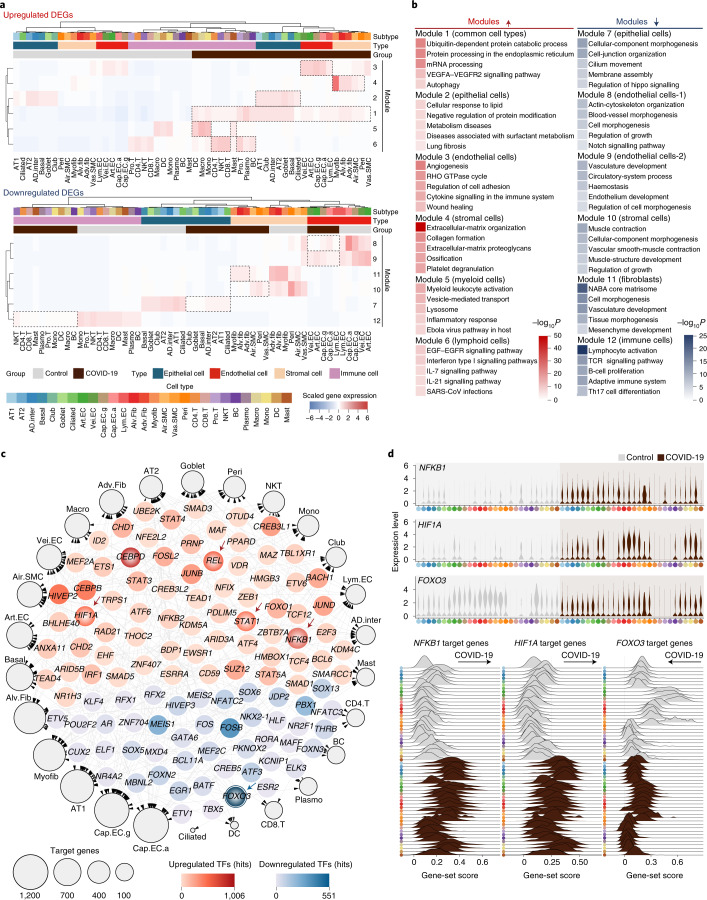
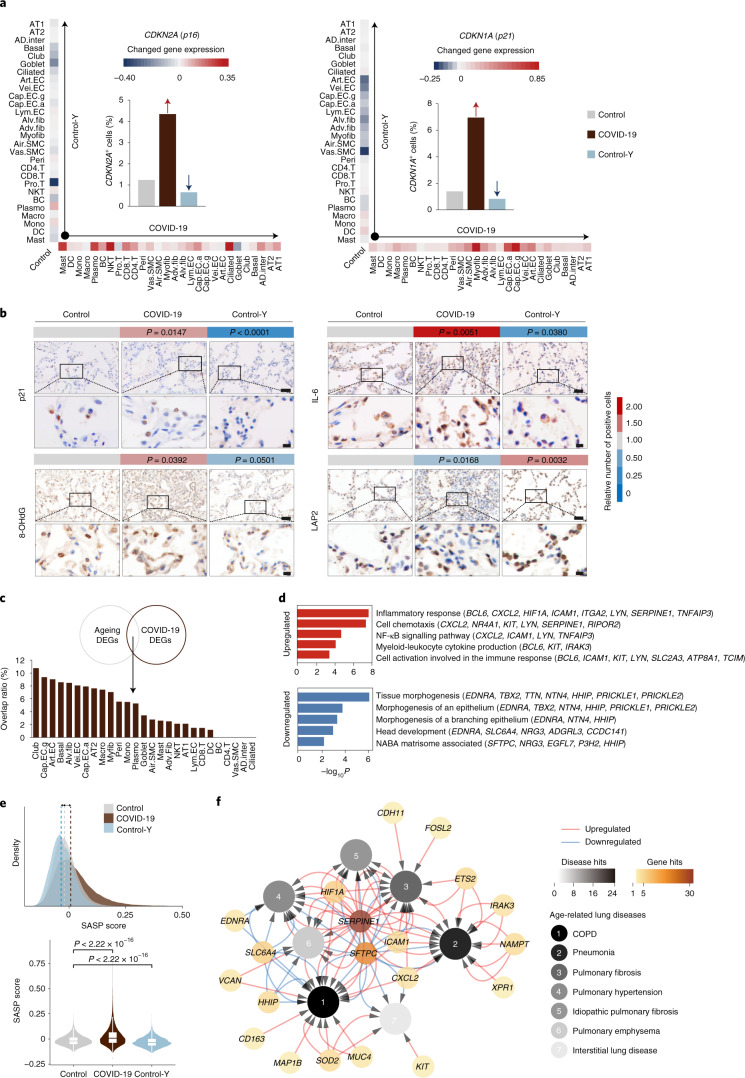
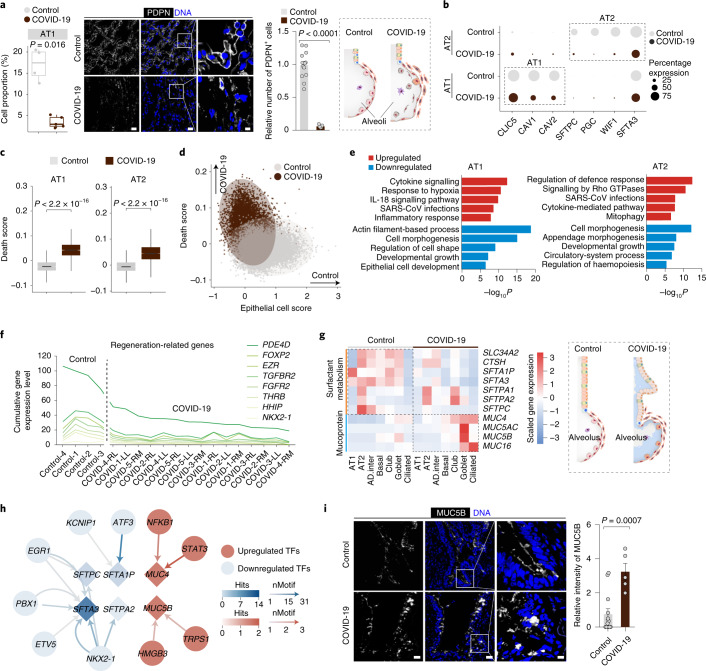
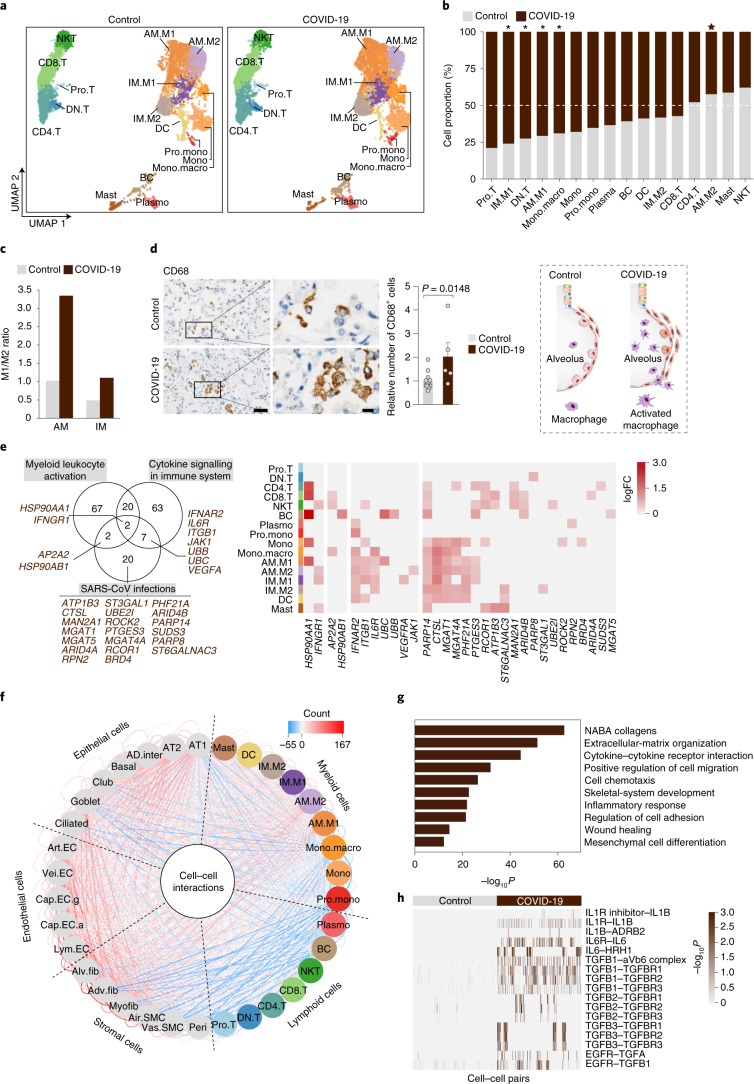
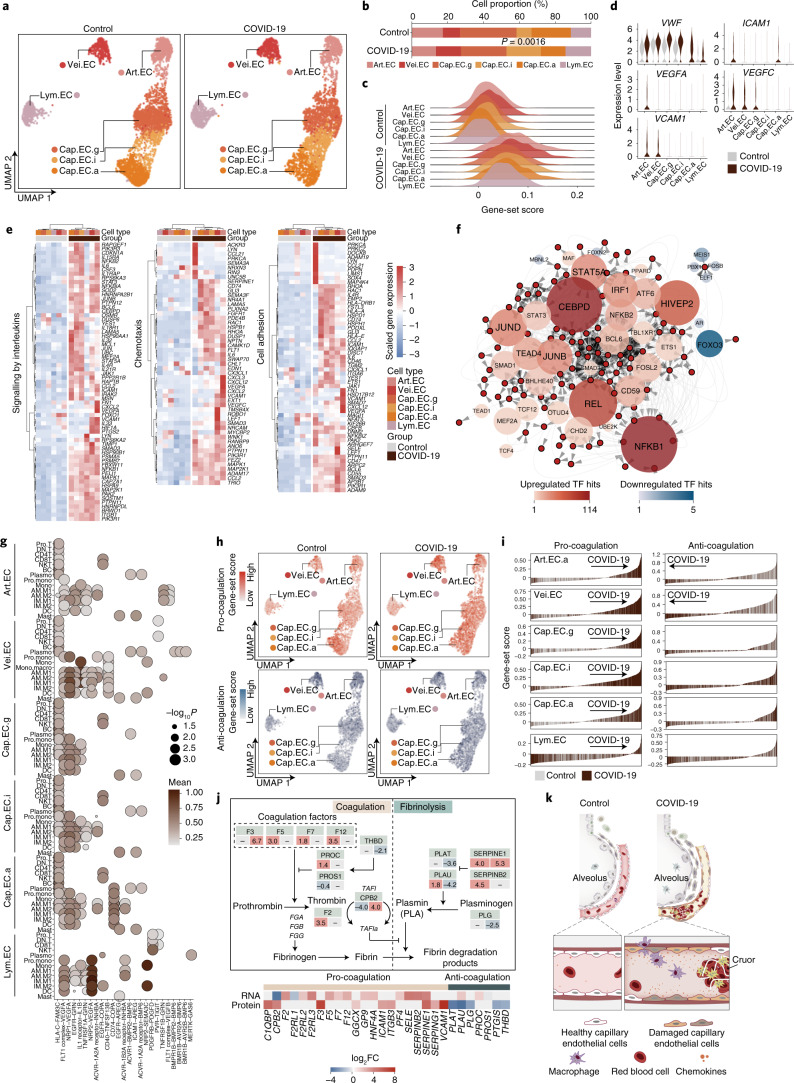
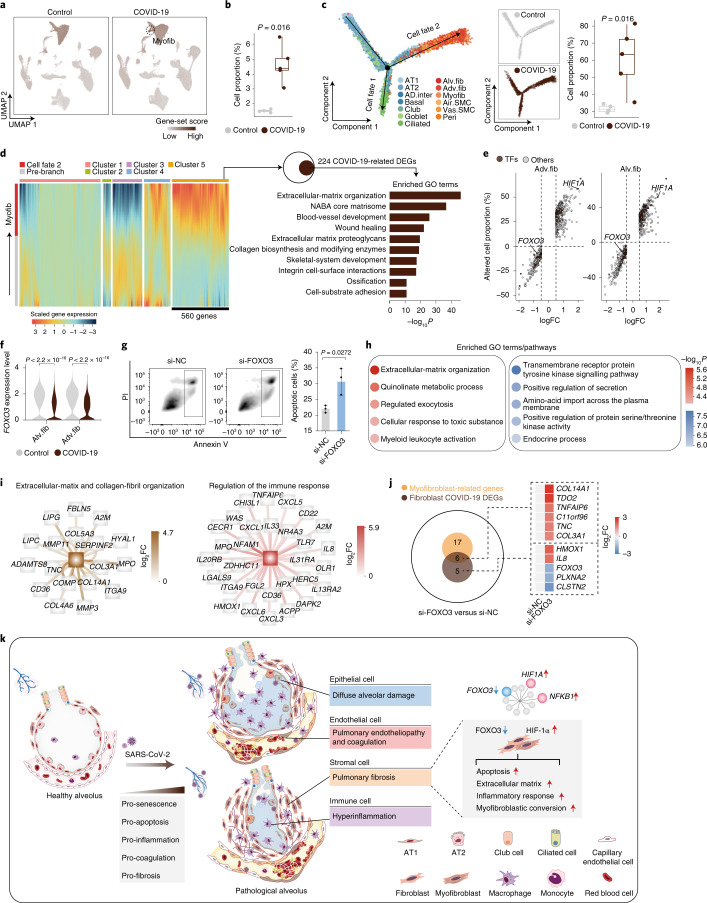
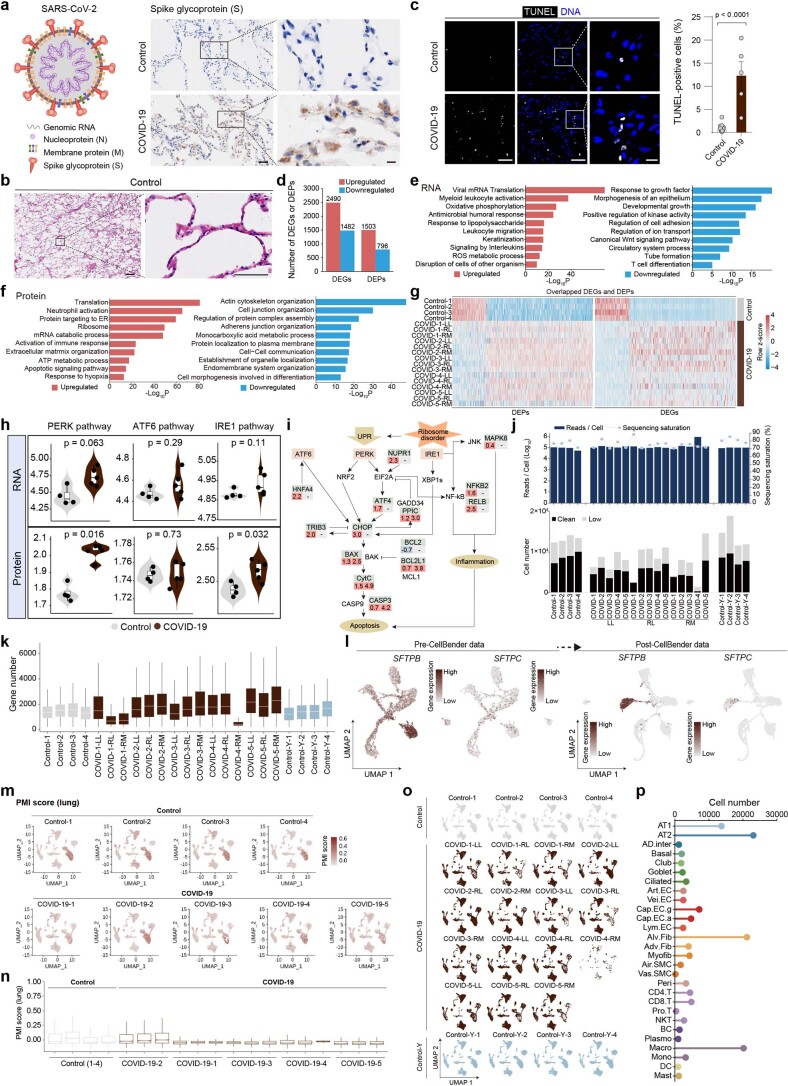
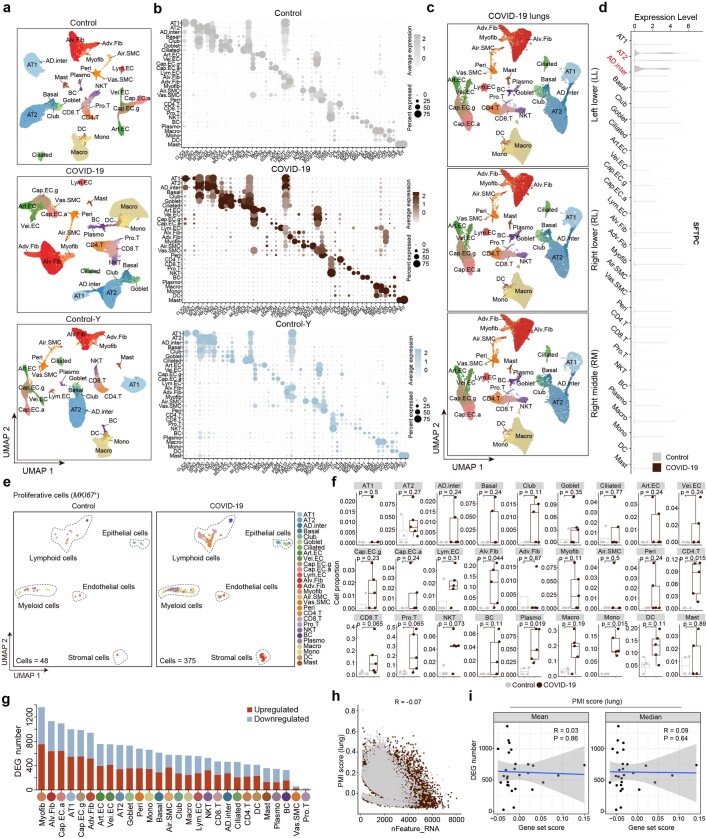
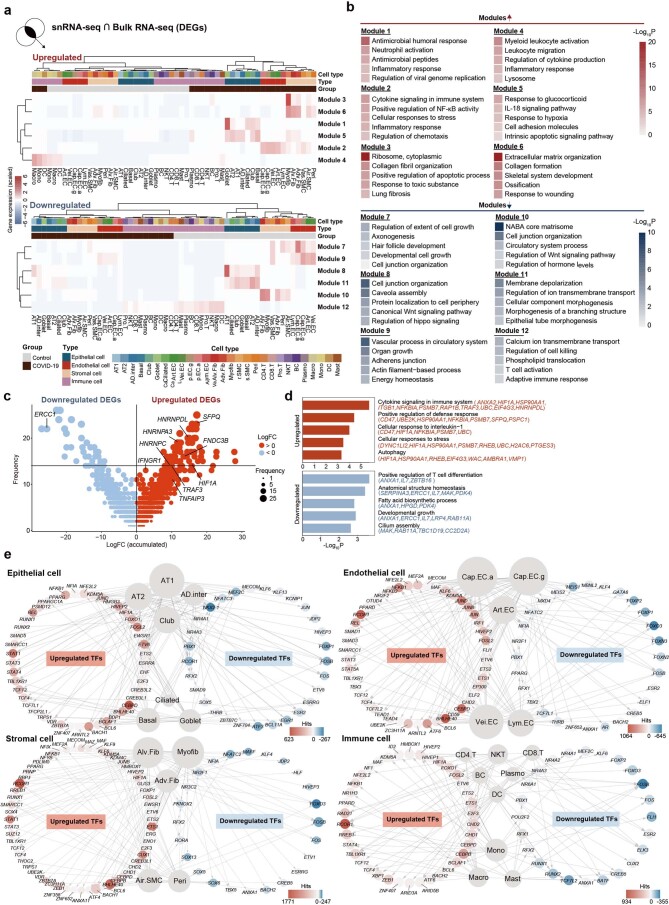
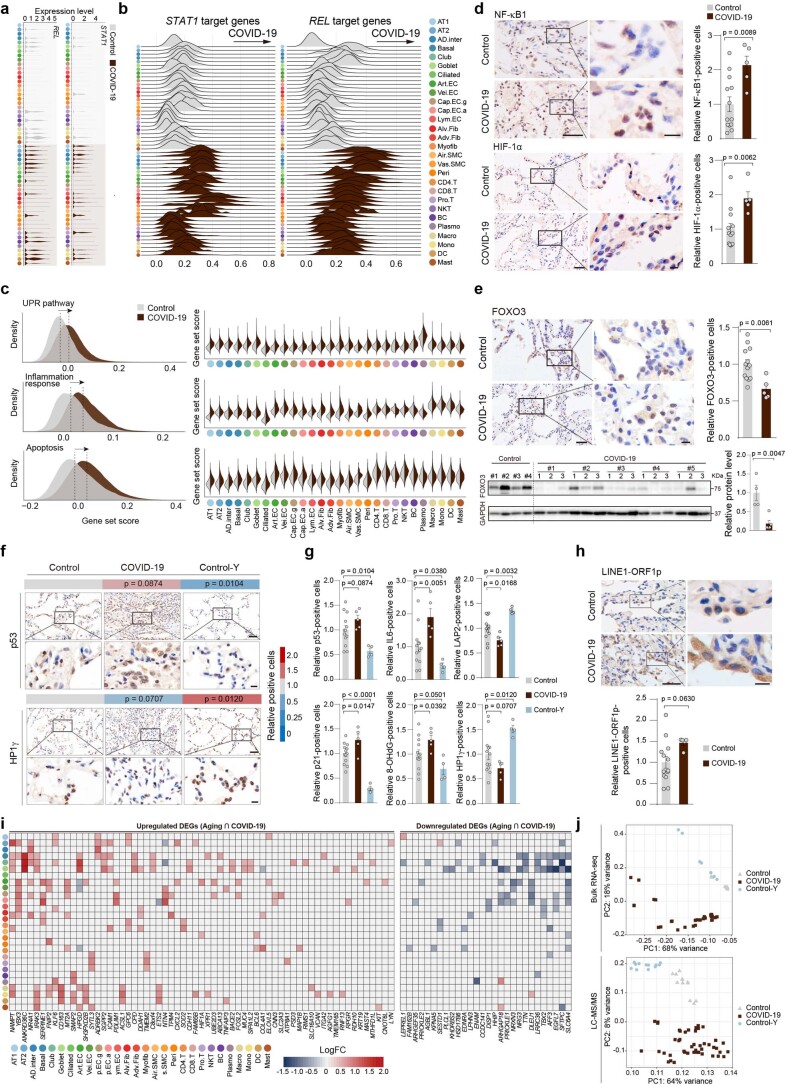
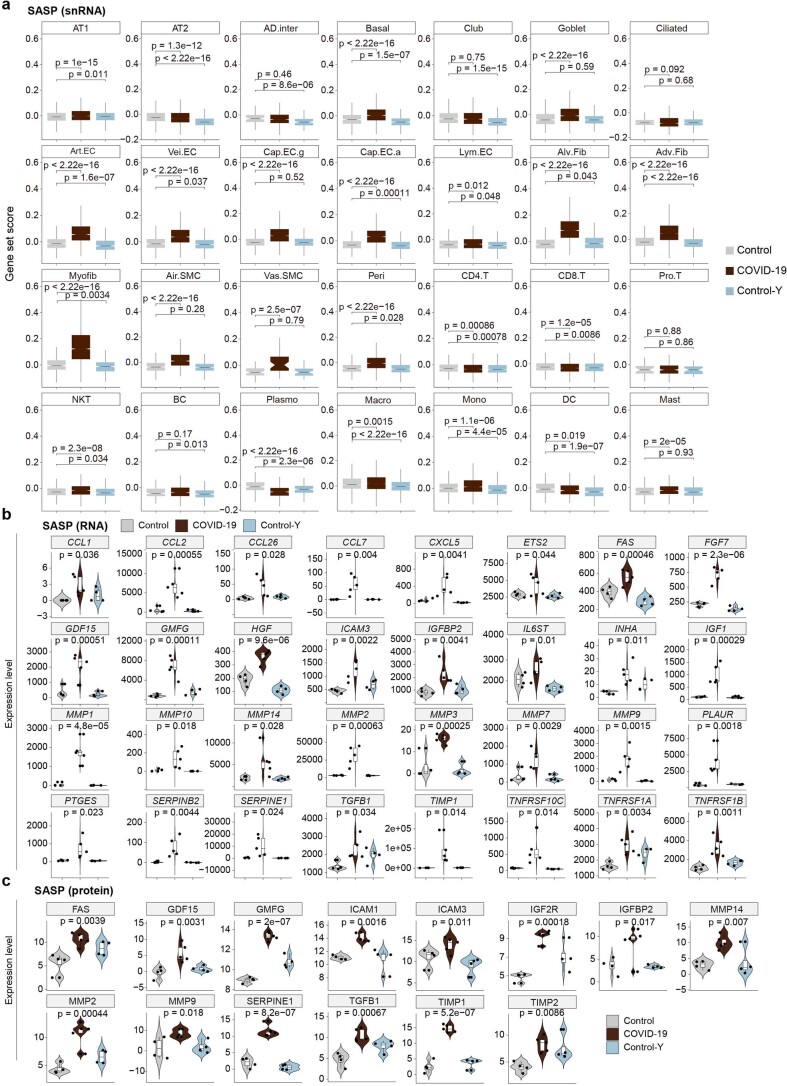
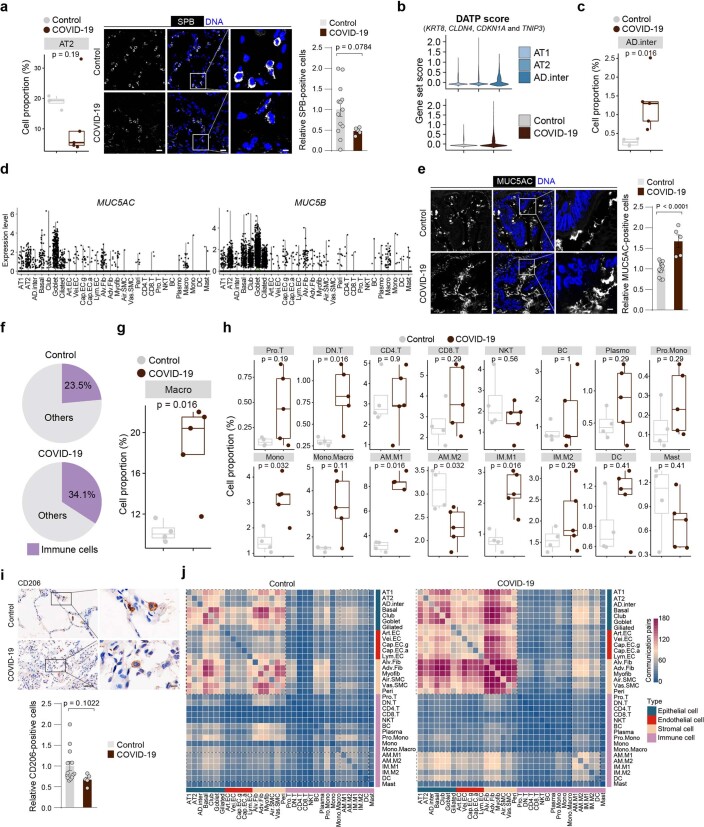
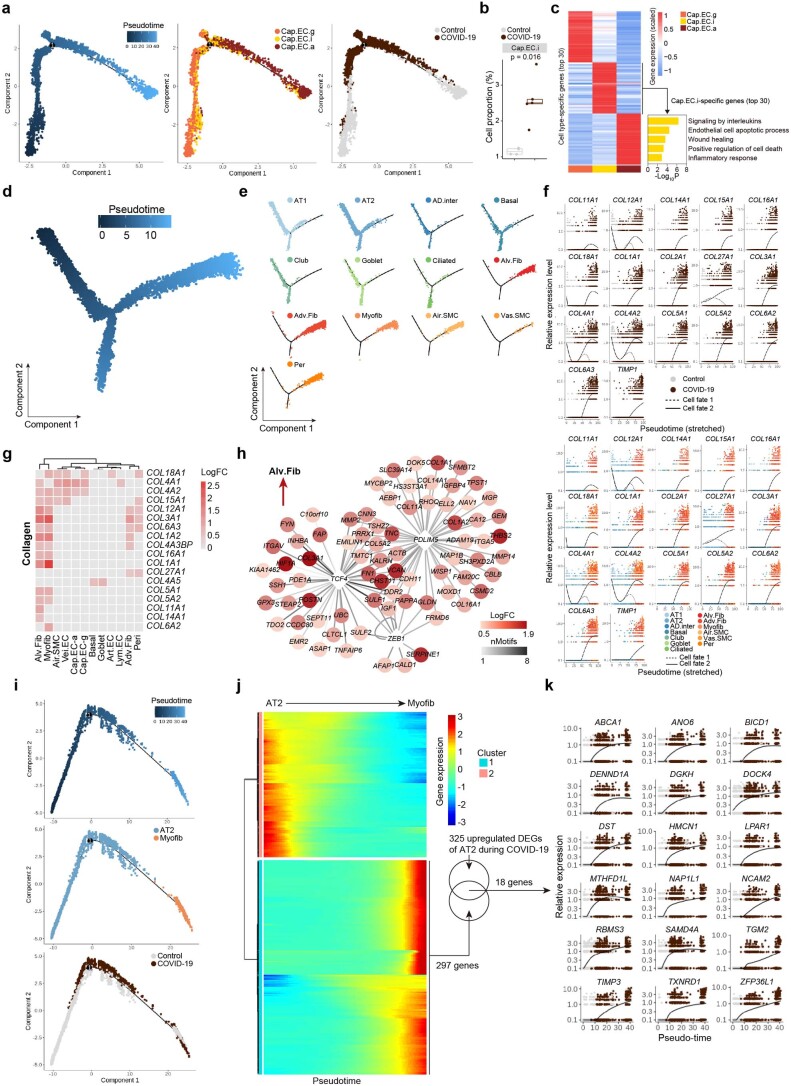
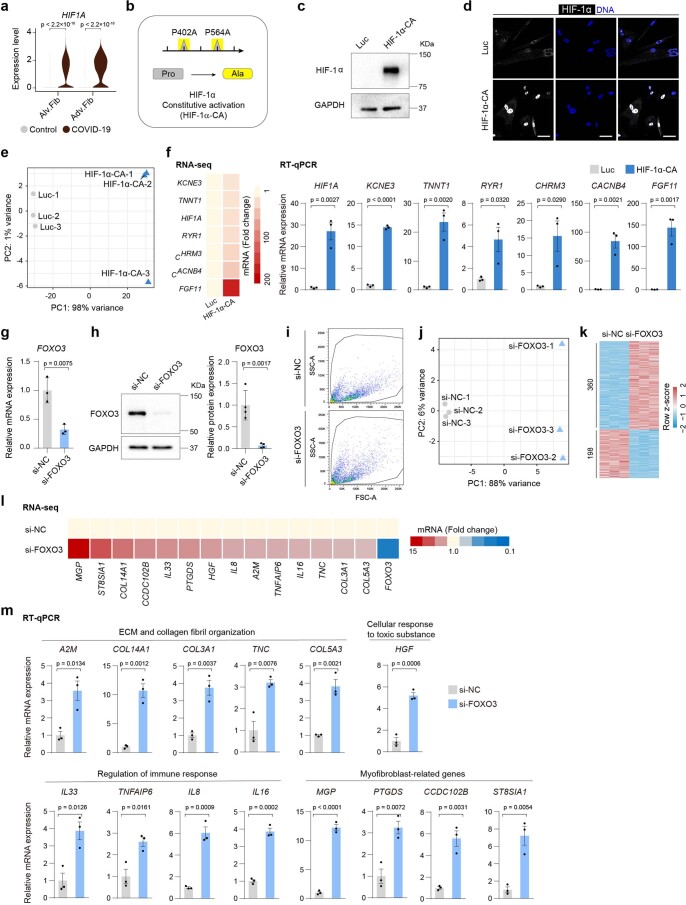
The lung is the primary organ targeted by severe acute respiratory syndrome coronavirus 2 (SARS-CoV-2), making respiratory failure a leading coronavirus disease 2019 (COVID-19)-related mortality. However, our cellular and molecular understanding of how SARS-CoV-2 infection drives lung pathology is limited. Here we constructed multi-omics and single-nucleus transcriptomic atlases of the lungs of patients with COVID-19, which integrate histological, transcriptomic and proteomic analyses. Our work reveals the molecular basis of pathological hallmarks associated with SARS-CoV-2 infection in different lung and infiltrating immune cell populations. We report molecular fingerprints of hyperinflammation, alveolar epithelial cell exhaustion, vascular changes and fibrosis, and identify parenchymal lung senescence as a molecular state of COVID-19 pathology. Moreover, our data suggest that FOXO3A suppression is a potential mechanism underlying the fibroblast-to-myofibroblast transition associated with COVID-19 pulmonary fibrosis. Our work depicts a comprehensive cellular and molecular atlas of the lungs of patients with COVID-19 and provides insights into SARS-CoV-2-related pulmonary injury, facilitating the identification of biomarkers and development of symptomatic treatments.


Conflict of interest statement

The authors declare no competing interests.

Figures

Fig. 1
Fig. 1. Integrated analysis of COVID-19 pulmonary pathology.
a, Study overview. Information on the patients with COVID-19 and the pathological processes (left). Schematic of the experimental process of the analysis of five COVID-19 and four normal (Control) lung tissues by bulk RNA-seq, liquid chromatography with tandem mass spectrometry (LC-MS/MS), snRNA-seq and experimental verification (right). b, Representative images of haematoxylin-and-eosin staining of lung sections from patients with COVID-19 (n = 5 lungs with samples from three lung lobes each). Scale bars, 400 μm (main image; centre top) and 50 μm (magnified images). c, Principle component (PC) analysis showing the differences between the lungs of Controls and patients with COVID-19 based on the expression patterns from the RNA-seq (top) and LC-MS/MS analyses (bottom). d, Spearman’s correlation analysis of the expression levels of overlapping genes and proteins that were differentially expressed between the COVID-19 and Control lungs (|log2(fold change, FC)| > 1.5, adjusted P < 0.05). Linear fitting is indicated by a black line with confidence intervals represented in grey shading. e, GO term and pathway enrichment analysis of overlaps between COVID-19 DEGs and DEPs. f, Network plot showing upregulated transcription factors identified by ingenuity pathway analysis of the bulk RNA-seq. The small and large node sizes indicate low and high numbers of target genes, respectively. g, Gene-set scores of UPR pathway- and apoptosis-related genes at the RNA (top) and protein (bottom) level. h, Gene-set scores of inflammation response-related genes at RNA and protein levels (left). Heatmap showing inflammation-related genes upregulated at both the RNA and protein level (right). g,h, Control, n = 4 lungs; and COVID-19, n = 5 lungs, with samples from three lung lobes each. The boxes show the median (centre line) and the quartile range (25-75%), and the whiskers extend from the quartile to the minimum and maximum values. P values are indicated; Wilcoxon signed-rank test. i, Venn plot showing the DEPs that are common to the lungs and sera of patients with COVID-19. The upregulated proteins are listed (right).
Fig. 2
Fig. 2. Construction of single-nucleus atlases of the human lung by snRNA-seq.
a, Human lung single-nucleus transcriptional atlas. Uniform manifold approximation and projection (UMAP) plots showing different cell types by snRNA-seq (left). Table of abbreviations used in all panels for the different cell types (right). b, Heatmap showing the gene expression signatures of the top 30 marker genes corresponding to each cell type in human lungs (left). Each column represents a cell type, each row indicates the expression of one gene and each colour represents one cell type as illustrated in a. Representative marker genes for each cell type are shown (right). c, UMAP plots showing ACE2 and TMPRSS2 double positive cells with positivity for FURIN, CTSB or CTSL, other ACE2 and TMPRSS2 double positive cells, other ACE2+ cells and ACE2 cells in the human lung atlas. Bottom panels show the distribution of cells from Control and COVID-19 groups. d, Cell-type (colour coded as per the legend in a) composition of cells that express genes associated with SARS-CoV-2 entry and their percentages in the lungs of the two groups-COVID-19 and Control (top). Percentages of different cell types expressing the corresponding SARS-CoV-2 entry-associated genes (bottom).
Fig. 3
Fig. 3. Transcriptional characteristics of the lungs of patients with COVID-19.
a, Heatmap showing DEGs (|logFC| > 0.5, adjusted P < 0.05), which were clustered into 12 modules by k-means analysis, across different cell types in the lungs of the COVID-19 and Control groups. Modules 1-6 indicate the specific upregulated modules in the lungs of patients with COVID-19 (top) and modules 7-12 indicate the specific upregulated modules in Control lungs (bottom). Dotted lines represent different cell types (e.g. epithelial, endothelial, stromal or immune cells). b, GO term-enrichment analysis of DEGs from different modules as shown in a. Pathways of upregulated and downregulated DEGs are indicated in red and blue, respectively. c, Transcriptional network showing the core transcription factors identified based on COVID-19 DEGs using SCENIC. The outer nodes represent different cell types and the sizes of the outer nodes indicate the number of target genes involved in this cell type. The inner nodes represent upregulated and downregulated transcription factors. The intensities of the colours indicate the number of target genes regulated by these transcription factors. d, Violin plots showing the expression levels of NFKB1, HIF1A and FOXO3 in the lungs of the two study groups (top). Ridge maps showing the gene-set scores of targets genes of the same transcription factors (bottom). Cell-type abbreviations and colour codes as per Fig. 2a.
Fig. 4
Fig. 4. Dissection of the relationships between ageing and COVID-19 DEGs in human lungs.
a, Hallmarks of senescence. Heatmaps (periphery, along the y and x axes) showing the relative expression levels of CDKN2A (left) and CDKN1A (right) in each cell type in the lungs of the COVID-19 and Control-Y groups compared with the Control group. The proportions of CDKN2A- (left) and CDKN1A-positive (right) cells in the lungs of the COVID-19 and Control-Y groups compared the Control group are shown (bar graphs). b, Immunohistochemical analysis of p21, IL-6, 8-OHdG and LAP2 in the indicated groups. Scale bars, 50 μm (main images; top) and 10 μm (magnified images; bottom). Quantitative data are shown as the mean. Control, n = 13 lungs; COVID-19, n = 5 lungs, with samples from three lung lobes each; and Control-Y, n = 4 lungs. One-tailed Student’s t-test P values are indicated. c, Genes shared by the ageing and COVID-19 DEGs. The proportion of DEGs shared by the ageing and COVID-19 groups are shown for the different cell types. d, GO term and pathway enrichment analyses for genes shared by the ageing and COVID-19 DEGs. e, Ridge map showing the density of distribution of the SASP scores of all of the cells in the Control, COVID-19 and Control-Y lungs (top). The medians of SASP scores of different groups are indicated with vertical lines. Violin and box-and-whisker plot showing the SASP scores of the Control (n = 34,974 cells), COVID-19 (n = 73,116 cells) and Control-Y (n = 33,062 cells) lungs. The boxes in the box-and-whisker plots show the median (centre line) and the quartile range (25–75%), and the whiskers extend from the quartile to the minimum and maximum values. P values, determined using a Wilcoxon signed-rank test, are indicated. f, Network plot showing the genes that altered concomitantly in Control and COVID-19 lungs and genes in the age-related lung disease database (https://www.disgenet.org/home/). The white-to-black legend on the left indicates the number of genes- from low to high, respectively-related to the indicated diseases; whereas the white-to-dark brown legend on the right indicates the number of cell types expressing the indicated genes from low to high, respectively. COPD, chronic obstructive pulmonary disease. Cell-type abbreviations as per Fig. 2a. Source data
Fig. 5
Fig. 5. Cellular and molecular features underlying diffuse alveolar damage in the lungs of patients with COVID-19.
a, Proportions of AT1 cells in the lungs of the Control (n = 4 donors) and COVID-19 (n = 5 donors) groups (left). Immunofluorescence analysis of PDPN in the lungs of the Control and COVID-19 groups (middle). Alveolar diagrams on the right showing the shedding of lung alveolar epithelial cells in patients with COVID-19. b, Proportions of cells expressing AT1- or AT2-representative markers (CLIC5, CAV1 and CAV2; and SFTPC, PGC, WIF1 and SFTA3, respectively) in the indicated samples. c, Death scores of AT1 and AT2 cells in Control (AT1, n = 5,918 cells; and AT2, n = 6,576 cells) and COVID-19 (AT1, n = 2,536 cells; and AT2, n = 8,612 cells) lungs. a,c, The boxes in the box-and-whisker plots show the median (centre line) and the quartile range (25-75%), and the whiskers extend from the quartiles to the minimum and maximum values. P values, determined using a Wilcoxon signed-rank test, are indicated. d, Gene-set scores of cell-death and epithelial cell markers in AT1 and AT2 cells in the lungs of the Control (n = 12,494 cells) and COVID-19 (n = 11,148 cells) groups. Each dot represents one cell. e, GO term and pathway enrichment analysis of COVID-19 DEGs in AT1 (left) and AT2 (right) cells. f, Expression levels of regeneration-related genes in the AT2 cells of COVID-19 and Control lungs. RL, right lower lobe; RM, right middle lobe; and LL, left lower lobe. g, Heatmap showing the expression levels of surfactant- and mucoprotein-related genes in Control and COVID-19 samples (left). Alveolar diagrams on the right show the accumulation of mucus in lung alveoli of patients with COVID-19. Cell-type abbreviations as per Fig. 2a. h, Network plot showing core transcription factors (TFs) in the regulation of surfactant-related COVID-19 DEGs in lung epithelial cells. The diamonds indicate the surfactant-related genes and the nodes denote transcription factors. nMotif denotes the number of motifs for each gene by the indicated transcription factor. i, Immunofluorescence analysis of MUC5B in the bronchiole and alveolar ducts of Control and COVID-19 lungs. a,i, Control, n = 13 lungs; and COVID-19, n = 5 lungs, with samples from three lung lobes each. Scale bars, 20 μm (main images) and 5 μm (magnified images). Quantitative data are shown as the mean ± s.e.m. Two-tailed t-test P values are indicated. Source data
Fig. 6
Fig. 6. The disturbed immune system in the lungs of patients with COVID-19.
a, UMAP plots showing immune cells in the lungs of the Control (left) and COVID-19 (right) groups; n = 8,000 cells each. b, Proportions of different immune cell types in the lungs of the Control and COVID-19 groups. Asterisks indicate significant differences in the cell proportions between the two groups. The dashed line denotes a cell proportion of 50%. c, M1/M2 ratios in alveolar (AM) and interstitial (IM) macrophages in the lungs of the Control and COVID-19 groups. d, Immunohistology analysis of the macrophage marker CD68 (left) in the lungs of the Control and COVID-19 groups. Scale bars, 50 μm (main images) and 10 μm (magnified images). Quantitative data are shown as the mean ± s.e.m. Control, n = 13 lungs; and COVID-19, n = 5 lungs, with samples from three lung lobes each. Two-tailed t-test P values are indicated. Alveolar diagrams showing the infiltration of immune cells and macrophage polarization in the lungs of patients with COVID-19 (right). e, Venn diagram showing the genes that are shared by the groups of genes related to ‘myeloid leukocyte activation’, ‘cytokine signalling in immune system’ and ‘SARS-CoV infections’ (left). Heatmap showing COVID-19 DEGs related to SARS-CoV infections in different immune cell types (right). f, Network showing the cell-cell communications across all cell types in the lungs of patients with COVID-19 compared with those in the Control group. Red lines indicate increased cell–cell interactions in the COVID-19 group. Blue lines indicate decreased cell-cell interactions in the COVID-19 group. g, GO term and pathway enrichment analysis of specific cell-cell communications in the lungs of patients with COVID-19. h, Heatmap showing the cell–cell communications in the lungs of patients with COVID-19 compared with the Control group. AM.M1, M1 alveolar macrophage; AM.M2, M2 alveolar macrophage; IM.M1, M1 interstitial macrophage; IM.M2, M2 interstitial macrophage; Pro.mono, proliferative monocyte; Mono.macro, mononuclear macrophage; DN.T, doublet negative (CD4-CD8-) T cells; and the remaining cell-type abbreviations as per Fig. 2a. Source data
Fig. 7
Fig. 7. Molecular basis underlying pulmonary endotheliopathy in the lungs of patients with COVID-19.
a, UMAP plots showing subtypes of CLDN5+ endothelial cells in the lungs of the Control and COVID-19 groups; n = 4,500 cells in each. b, Proportions of endothelial cell subtypes in the lungs of the Control and COVID-19 groups. The P value, determined using a Wilcoxon signed-rank test, is indicated. c, Ridge map showing increased death scores in different endothelial cell subtypes in the lungs of patients with COVID-19 compared with those of the Control group. d, Expression levels of endothelial damage-related genes in different endothelial cell subtypes. e, Heatmaps showing the upregulated COVID-19 DEGs related to inflammation in the different endothelial cell subtypes. f, Reconstruction of the transcriptional regulon network linking core regulatory transcription factors to potential target genes of the indicated pathways. g, Cell-cell interactions between immune cells and various endothelial cell subtypes. h, UMAP plots showing the expression levels of genes related to pro- (top) and anti-coagulation (bottom) in different endothelial cell subtypes in the lungs of the Control and COVID-19 groups. i, Gene-set core analysis of pro- (left) and anti-coagulation (right) pathways in individual cells of distinct endothelial cell subtypes. j, Diagram of the coagulation (left) and fibrinolysis (right) pathways (top). The values below the gene names indicate the log2FC value at the RNA (left) and protein (right) levels. Heatmap showing the expression levels of the indicated genes in the lungs of patients with COVID-19 (bottom). k, Schematic showing the vascular pathological changes in the lungs of patients with COVID-19. AM.M1, M1 alveolar macrophage; AM.M2, M2 alveolar macrophage; IM.M1, M1 interstitial macrophage; IM.M2, M2 interstitial macrophage; Pro.mono, proliferative monocyte; Mono.macro, mononuclear macrophage; and the remaining cell-type abbreviations as per Fig. 2a.
Fig. 8
Fig. 8. Activation of myofibroblasts eliciting the pathobiology of pulmonary fibrosis.
a, UMAP plots showing the gene-set scores of extracellular matrix-related genes in Control (left) and COVID-19 (right) lungs. b, Proportions of myofibroblasts in the lungs of individuals in the Control and COVID-19 groups. c, Pseudotime trajectory analysis of epithelial and stromal cells in Control and COVID-19 samples (left). Proportions of cells in cell fate 2 (except for myofibroblasts) from the Control and COVID-19 groups (right). b,c, Cell-type abbreviations as per Fig. 2a. Controls; n = 4 donors; and COVID-19; n = 5 donors. The boxes in the box-and-whisker plots show the median (centre line) and the quartile range (2575%) and the whiskers extend from the quartile to the minimum and maximum values. P values, determined using a Wilcoxon signed-rank test, are indicated. d, Heatmap showing the top 2,000 DEGs in cell fate 2 during pseudotime trajectory (left). GO analysis of the genes that overlap between upregulated DEGs implicated in myofibroblast formation (cluster 5) and COVID-19 DEGs. e, Relative cell proportions and gene expression levels of Adv. fib (left) and Alv. fib (right) in the lungs of patients with COVID-19 compared with those in the Control group. TFs, transcription factors. f, Expression levels of FOXO3 in the lung fibroblasts of the Control and COVID-19 groups. P values, determined using a Wilcoxon signed-rank test, are indicated. g, Apoptosis analysis of human fibroblasts following FOXO3 knockdown (si-FOXO3) by flow cytometry. Quantitative data are shown as the mean ± s.e.m. of n = 3 biologically independent samples per condition. The two-tailed t-test P value is indicated; si-NC, siRNA to a negative control duplex. h, GO term and pathway enrichment analysis of DEGs following FOXO3 knockdown in human fibroblasts. Red denotes upregulation and blue denotes downregulation. i, Network plots showing DEGs related to the indicated terms and pathways following FOXO3 knockdown in human fibroblasts. j, Venn diagram showing the genes shared by the DEGs following FOXO3 knockdown in human fibroblasts, COVID-19 DEGs in fibroblasts and myofibroblast-related genes (left). Myofibroblast-related genes were defined as myofibroblast-marker genes and upregulated genes implicated in myofibroblast formation based on pseudotime analysis. Heatmap showing the relative expression levels of the indicated genes (right). k, Schematic showing the systemic pathological changes in the lung tissues of patients with COVID-19. Source data
Extended Data Fig. 1
Extended Data Fig. 1. Pathological analysis and transcriptional and proteomic profiles of the lung tissues of patients with COVID-19.
a, Left, schematic diagram of SARS-CoV-2. Right, representative images of immunostaining of spike glycoprotein (S) in Control (n = 4) and COVID-19 lungs (n = 5 patient lungs sampled from three lung lobes each). Scale bars, 50 μm and 10 μm (zoomed-in images). b, Representative images of H&E staining of Control lungs (n = 4 donors) related to Fig. 1b. Scale bars, 400 μm and 50 μm (zoomed-in images). c, TUNEL staining of lungs. Quantitative data are shown as mean ± s.e.m. Control, n = 13; COVID-19, n = 5 patient lungs sampled from three lung lobes each. Scale bars, 50 μm and 10 μm (zoomed-in image). Two-tailed t-test P values are indicated. d, Bar plot showing the numbers of DEGs and DEPs between Control and COVID-19 groups. e-f, GO term and pathway enrichment analysis of DEGs (e) or DEPs (f) between Control and COVID-19 groups. g, Heatmap showing the overlapped genes of DEGs and DEPs between Control and COVID-19 groups. h-o, Transcriptional, proteomic, and single-nucleus RNA sequencing analyses of Control, COVID-19 and Control-Y groups. Gene set scores of indicated pathway-related genes at RNA and protein levels. P values by Wilcoxon test are indicated (h). Diagram of UPR pathway. Values below indicate log2FC for RNA (left) and protein (right) levels (i). Bar plot showing the reads per cell, sequencing saturation (Top) and cell numbers (Bottom) of each sample in snRNA-seq (j). Box plot showing the detected gene numbers across cells of different samples (k). UMAP plots showing the levels of SFTPB and SFTPC across different cell types before and after the data were processed by CellBender (l). UMAP (m) and box (n) plots showing comparable gene set scores of 19 genes (lung) likely affected by different post-mortem intervals (PMI). UMAP plots showing cell distributions in different samples of human lung tissues (o). Control, n = 4 lungs; COVID-19, n = 5 patient lungs sampled from three lung lobes each; Control-Y, n = 4 lungs. Box shows the median (centre line) and the quartile range (25-75%) and the whiskers extend from the quartiles to the minimum and maximum values. p, Cell numbers of different cell types in human lung tissues. Source data
Extended Data Fig. 2
Extended Data Fig. 2. Data quality control and cell type identification by snRNA-seq.
(a) UMAP plots showing cell distributions of different cell types in Control, COVID-19, and Control-Y groups. (b) Dot plots showing the expression levels of cell type-specific marker genes in Control, COVID-19, and Control-Y groups. (c) UMAP plots showing cell distributions of different cell types in left lower (LL), right middle (RM), and right lower (RL) lobes of the lungs of patients with COVID-19. (d) Violin plot showing expression levels of SFTPC across different cell types in Control and COVID-19 lungs. (e) UMAP plots showing MKI67-positive proliferative cells in Control and COVID-19 groups. (f) Box plots showing cell proportions of proliferative cells across different cell types in human lung between Control and COVID-19 groups. Control, n = 4 lungs; COVID-19, n = 5 lungs with samples from three lung lobes each. Box shows the median (centre line) and the quartile range (25-75%) and the whiskers extend from the quartiles to the minimum and maximum values. (g) Bar plot showing numbers of DEGs (|logFC | > 0.5, adjusted P value < 0.05) in different cell types between COVID-19 and Control lungs. (h) Scatter plot showing gene set scores of PMI-related genes (lung) (Y-axis) and detected gene numbers (X-axis) across cells of Control and COVID-19 lungs. Control, n = 34,974 cells; COVID-19, n = 73,116 cells. R value from spearman’s correlation analysis is as indicated. (i) The dot plots showing the Spearman’s correlations between PMI scores and DEG numbers across different cell types of lung. Mean, the mean values of PMI scores across cells of each type. Median, the median values of PMI scores across cells of each cell types. R value from spearman’s correlation analysis is as indicated.
Extended Data Fig. 3
Extended Data Fig. 3. Global transcriptional changes underlying COVID-19 pulmonary pathobiology.
(a) Heatmaps showing DEGs shared by bulk RNA-seq and snRNA-seq data and clustered into modules by k-means analysis across different cell types in Control and COVID-19 lungs. (b) GO terms enrichment analysis of DEGs from different modules as shown in Extended Data Fig. 3a. Colour of red and blue indicates pathways of upregulated and downregulated genes, respectively. (c) Bubble plot showing the DEGs (|logFC | > 0.5, adjusted P value < 0.05) between COVID-19 and Control groups, with x-axis indicating the accumulated logFC from different cell types and y-axis representing their frequencies in different cell types. P values were determined using Wilcoxon signed-rank test. The red and blue nodes indicate the upregulated and downregulated DEGs, respectively. The node size from small to large indicates the low to high frequency of each DEG, respectively. (d) GO and pathway enrichment analysis of overlapped genes in more than 14 cell types between COVID-19 and Control DEGs. (e) Transcriptional network showing the core transcription factors (TFs) identified in snRNA-seq from different cell types by SCENIC analysis. The node size indicates the number of target genes in the indicated cell types.
Extended Data Fig. 4
Extended Data Fig. 4. Transcriptional networks and core TFs implicated in COVID-19 lung pathology.
(a) Violin plots showing the expression levels of REL and STAT1 across different cell types in Control and COVID-19 lungs. (b) Ridge plots showing the gene set scores of targets genes of REL and STAT1. (c) Gene set scores of indicated pathways in all the cells (left) or different cell types (right) of Control and COVID-19 groups. (d) Immunostaining analysis of NF-κB1 (top), HIF-1α (bottom) in Control and COVID-19 lungs, respectively. Scale bars, 50 μm and 10 μm (zoomed-in image). Quantitative data are shown as mean ± s.e.m. Control, n = 13; COVID-19, n = 5 patients with samples from three lung lobes each. Two-tailed t-test P values are indicated. (e) Immunostaining (top) and Western blotting (bottom) analysis of FOXO3 in Control and COVID-19 lungs, Scale bars, 50 μm and 10 μm (zoomed-in image). Quantitative data are shown as mean ± s.e.m. Control, n = 13 for immunostaining and n = 4 for Western blotting; COVID-19, n = 5 patients with samples from three lung lobes each. Two-tailed t-test P values are indicated. (f) Immunohistochemical analysis of p53 and HP1γ in Control, COVID-19, and Control-Y lungs. Quantitative data are shown as the mean. Scale bars, 50 μm and 10 μm (zoomed-in image). Control, n = 13 lungs; COVID-19, n = 5 lungs with samples from three lung lobes each; Control-Y, n = 4 lungs. One-tailed t-test P values are indicated. (g) Quantitative data of immunostaining of senescence markers in lung tissues. Data are shown as mean ± s.e.m. Control, n = 13; COVID-19, n = 5 patients with samples from three lung lobes each, Control-Y, n = 4. One-tailed t-test P values are indicated. (h) Immunohistochemical staining of LINE1-ORF1p in Control and COVID-19 lungs. Scale bars, 50 μm and 10 μm (zoomed-in image). Quantitative data are shown as mean ± s.e.m. Control, n = 13; COVID-19, n = 5 patients with samples from three lung lobes each. Two-tailed t-test P values are indicated. (i) Heatmaps showing the upregulated and downregulated DEGs shared between aging and COVID-19 DEGs in different cell types. (j) PCA of RNA-seq (top) and LC-MS/MS (bottom) data for different samples from Control, COVID-19, and Control-Y lungs. Source data
Extended Data Fig. 5
Extended Data Fig. 5. Cellular senescence in the lungs of patients with COVID-19.
(a) Gene set scores of SASP genes in different cell types from Control (n = 34,974 cells), COVID-19 (n = 73,116 cells), and Control-Y (n = 33,062 cells) groups. Box shows the median (centre line) and the quartile range (25-75%) and the whiskers extend from the quartiles to the minimum and maximum values. P values by Wilcoxon test are indicated. (b) Violin plots showing the SASP gene expression levels increased in the lungs of patients with COVID-19 compared to those in Control lungs. Control, n = 4 lungs; COVID-19, n = 5 lungs with samples from three lung lobes each; Control-Y, n = 4 lungs. Box shows the median (centre line) and the quartile range (25-75%) and the whiskers extend from the quartiles to the minimum and maximum values. P values from ANOVA are as indicated. (c) Violin plots showing the SASP protein expression levels increased in the lungs of patients with COVID-19 compared to those in Control lungs. Control, n = 4 lungs; COVID-19, n = 5 lungs with samples from three lung lobes each; Control-Y, n = 4 lungs. Box shows the median (centre line) and the quartile range (25-75%) and the whiskers extend from the quartiles to the minimum and maximum values. P values from ANOVA are as indicated.
Extended Data Fig. 6
Extended Data Fig. 6. Cell proportion and gene expression changes of epithelial cells and immune cells in the lungs of patients with COVID-19.
(a) Left, boxplot showing cell proportions of AT2 in Control (n = 4) and COVID-19 (n = 5) lungs. Box shows the median (centre line) and the quartile range (25-75%) and the whiskers extend from the quartiles to the minimum and maximum values with P values indicated (Wilcoxon test). Middle, immunofluorescence analysis of SPB in lungs. Scale bars, 20 and 5 μm (zoomed-in image). Right, quantitative data of relative SPB-positive cells shown as mean ± s.e.m with P values indicated (t-test). Control, n = 13 lungs; COVID-19, n = 5 patient lungs sampled from three lung lobes each. (b) Violin plots showing the damage-related transient progenitor (DATP) scores in AT1, AT2 and AD.inter. (top) along with those in Control and COVID-19 lungs (bottom). (c) Boxplot showing cell proportions of AD.inter in Control (n = 4) and COVID-19 (n = 5) lungs. Box shows the median (centre line) and the quartile range (25-75%) and the whiskers extend from the quartiles to the minimum and maximum values with P values indicated (Wilcoxon test). (d) Violin plots showing the levels of MUC5AC and MUC5B in human lungs. (e) Immunofluorescence analysis of MUC5AC in the bronchiole and alveolar ducts of lungs. Scale bars, 20 μm and 5 μm (zoomed-in image). Quantitative data are shown as mean ± s.e.m with P values indicated (t-test). Control, n = 13 lungs; COVID-19, n = 5 patient lungs sampled from three lung lobes each. (f) Pie plots showing cell proportions of immune cells in lungs. (g-h), Boxplots showing cell proportions of macrophages (g) or different immune cells (h) from Control (n = 4) and COVID-19 (n = 5) lungs. Box shows the median and the quartile range (25-75%) and the whiskers extend from the quartiles to the minimum and maximum values with P values indicated (Wilcoxon test). (i) Immunohistology analysis of macrophage marker CD206 in lungs. Scale bars, 50 μm and 10 μm (zoomed-in image). Quantitative data are shown as mean ± s.e.m with P values indicated (t-test). Control, n = 13 lungs; COVID-19, n = 5 patient lungs sampled from three lung lobes each. (j) Heatmaps showing the numbers of cell-cell communication pairs in lungs. Source data
Extended Data Fig. 7
Extended Data Fig. 7. Transcriptomic signatures of endothelial cells and molecular hints for lung fibrosis in COVID-19.
(a) Left, pseudotime scores of capillary endothelial cells in human lung tissues. Middle, pseudotime trajectory of different capillary endothelial cell subtypes. Right, pseudotime trajectory of capillary endothelial cells from Control and COVID-19 samples. Cells are coloured by different cell types (middle) and groups (right). (b) Boxplot showing cell proportions of Cap.EC.i from Control (n = 4 donors) and COVID-19 (n = 5 donors) lungs. Box shows the median (centre line) and the quartile range (25-75%) and the whiskers extend from the quartiles to the minimum and maximum values. P values by Wilcoxon test are indicated. (c) Left, heatmap showing the gene expression signatures of the top 30 marker genes corresponding to each capillary endothelial cell type in human lungs. Right, bar plot showing the GO-term enrichment analysis of marker genes for Cap.EC.i. (d) Pseudotime scores of epithelial cells and stromal cells in human lung tissues. (e) Distributions of different epithelial cells and stromal cells in human lung tissues in pseudotime trajectory. (f) The relative gene expression patterns of the indicated genes over pseudotime of cell fate 1 (AT1) and cell fate 2 (myofib) in Control and COVID-19 lungs. Cells are coloured by groups (top) and different cell types (bottom). (g) Heatmap showing the expression signatures of collagen-related DEGs between COVID-19 and Control groups in different cell types. (h) Transcriptional network showing the core TFs identified in snRNA-seq from myofibroblasts by SCENIC analysis. (i) Pseudotime trajectory analysis of AT2 and myofibroblast in human lung coloured by pseudotime score, cell type and sample group. (j) Heatmap showing differentially expressed genes (q-value < 0.01) along the trajectory from AT2 to myofibroblast. (k) The relative gene expression patterns of the indicated genes along the pseudotime.
Extended Data Fig. 8
Extended Data Fig. 8. Constitutive activation of HIF-1α and knockdown of FOXO3 in human lung fibroblasts.
(a) Violin plot showing the gene expression levels of HIF1Α in fibroblasts from Control and COVID-19 lungs. P values by Wilcoxon test are indicated. (b) Schematic illustration showing the strategy of constitutive activation of HIF-1α. (c) Western blot showing the increased protein levels of HIF-1α after lentiviral transduction of HIF-1α-CA expressing vectors in human fibroblasts for three days. The experiment was repeated three times independently with similar results. (d) Immunofluorescence analysis of HIF-1α in human fibroblasts upon HIF-1α-CA overexpression. Scale bars, 50 μm. The experiment was repeated three times independently with similar results. (e) PCA of samples of human fibroblasts upon the transduction with Luc or HIF-1α-CA lentiviral vectors for six days. (f) Heatmap (left) and bar plots (right) showing the expression levels of indicated genes in human fibroblasts after lentiviral transduction of HIF-1α-CA for six days by RNA-seq (left) and RT-qPCR (right). Quantitative data are shown as mean ± s.e.m. n = 3 biologically independent samples per condition. Two-tailed t-test P values are indicated. (g) RT-qPCR analysis of FOXO3 in human fibroblasts upon FOXO3 knockdown. Cells were transfected with indicated siRNAs for three days. Quantitative data are shown as mean ± s.e.m. n = 3 biologically independent samples per condition. Two-tailed t-test P values are indicated. (h) Left, western blot showing the decreased protein levels of FOXO3 upon FOXO3 knockdown with siRNA. Right, the quantitative data are shown as mean ± s.e.m, n = 4 biologically independent samples per condition. Two-tailed t-test P values are indicated. (i) Gating strategy for the apoptosis analysis for human fibroblasts upon FOXO3 knockdown. (j) PCA of samples of human fibroblasts transfected with si-Negative Control (si-NC) and si-FOXO3 duplex for six days. (k) Heatmap showing the numbers and expression levels of DEGs upon FOXO3 knockdown identified by RNA-seq. (l) Heatmap showing the transcript levels of indicated DEGs by RNA-seq analysis. (m) Transcript level analysis of indicated genes in human fibroblasts upon FOXO3 knockdown by RT-qPCR. Quantitative data are shown as mean ± s.e.m, n = 3 biologically independent samples per condition. Two-tailed t-test P values are indicated. Source data

References

    1. Travaglini KJ, et al. A molecular cell atlas of the human lung from single-cell RNA sequencing. Nature. 2020;587:619–625. doi: 10.1038/s41586-020-2922-4. - DOI - PMC - PubMed
    1. Liu Q, et al. Pathological changes in the lungs and lymphatic organs of 12 COVID-19 autopsy cases. Natl Sci. Rev. 2020;7:1868–1878. doi: 10.1093/nsr/nwaa247. - DOI - PMC - PubMed
    1. Carsana L, et al. Pulmonary post-mortem findings in a series of COVID-19 cases from northern Italy: a two-centre descriptive study. Lancet Infect. Dis. 2020;20:1135–1140. doi: 10.1016/S1473-3099(20)30434-5. - DOI - PMC - PubMed
    1. Yao X-H, et al. Pathological evidence for residual SARS-CoV-2 in pulmonary tissues of a ready-for-discharge patient. Cell Res. 2020;30:541–543. doi: 10.1038/s41422-020-0318-5. - DOI - PMC - PubMed
    1. Xu Z, et al. Pathological findings of COVID-19 associated with acute respiratory distress syndrome. Lancet Respir. Med. 2020;8:420–422. doi: 10.1016/S2213-2600(20)30076-X. - DOI - PMC - PubMed

Publication types