. 2021 Nov 30:14:9031-9049.
doi: 10.2147/IJGM.S336757. eCollection 2021.

An Immune-Related lncRNA Signature to Predict the Biochemical Recurrence and Immune Landscape in Prostate Cancer

Affiliations

An Immune-Related lncRNA Signature to Predict the Biochemical Recurrence and Immune Landscape in Prostate Cancer

Guian Zhang et al. Int J Gen Med. .

Abstract

Purpose: This study aims to construct an immune-related signature to provide comprehensive insights into the immune landscape of prostate cancer, which can predict biochemical recurrence (BCR) and clinical treatment.

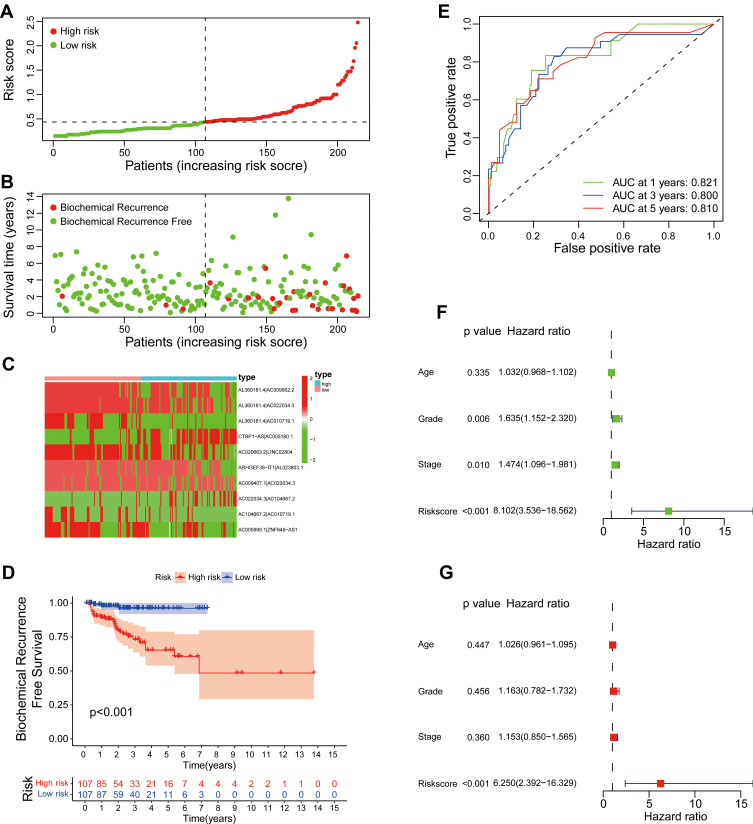
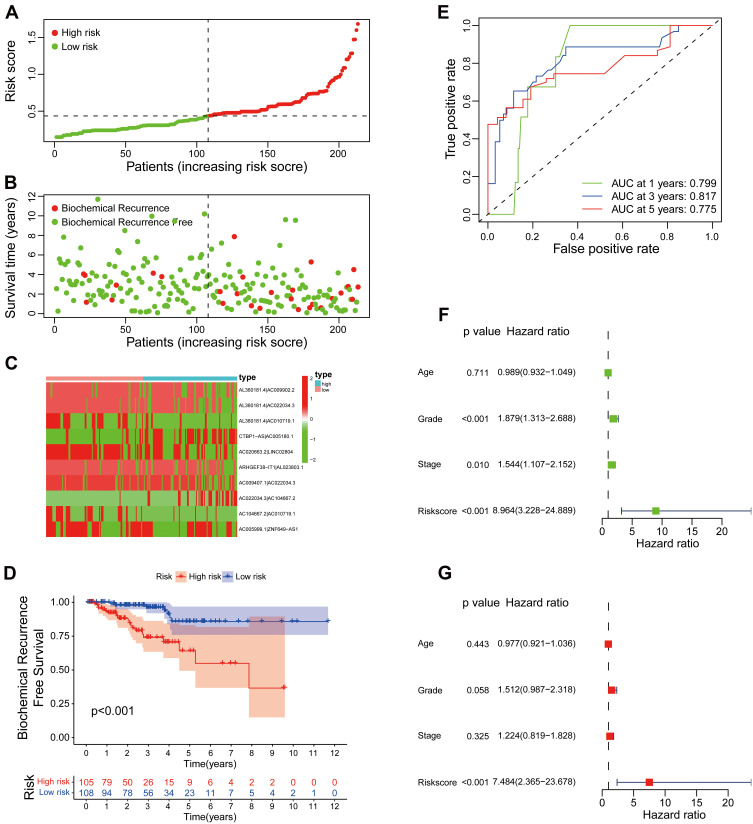
Methods: Based on The Cancer Genome Atlas (TCGA) dataset, a signature constructed by DEirlncRNAs pairs was determined. The receiver operating characteristic curve analysis, Kaplan-Meier analysis, nomogram, and decision curve analysis were used to analyze it. Then, immunophenoscore (IPS), immune cell infiltration, tumor mutation burden (TMB), and immune function were investigated. Finally, we evaluated the role of the signature in medical treatment.

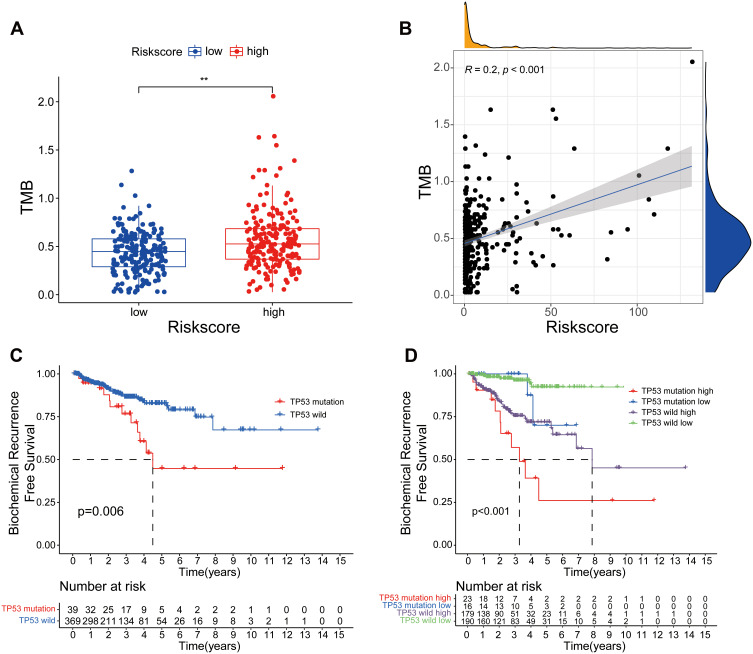
Results: A signature constructed by 10 valid DEirlncRNAs pairs was identified in the training set and validated well in the testing and entire set. The signature was a reliable and independent prognostic indicator to predict the BCR of prostate cancer, which was better than the clinicopathological characteristics. After dividing the patients into low- and high-risk groups by median value, we found that the high-risk group had shorter BCR-free time and higher TMB levels. Furthermore, the high-risk group was negatively associated with plasma B cells and CD+8 T cells. IPS and immune functions, such as immune checkpoints and human leukocyte antigen, were significantly different between the two groups. Low-risk group was more sensitive to endocrine therapy and immunotherapy, while high-risk group was more inclined to targeted drugs. Both groups had their own sensitive chemotherapy.

Conclusion: We established a novel signature to predict BCR and validated its role in the immune landscape of prostate cancer, which could help patients receive personalized medical treatment.

Keywords: TMB; biochemical recurrence; immune landscape; lncRNA; medical treatment; prostate cancer.


Conflict of interest statement

The authors report no conflicts of interest in this work.

Figures

Figure 1
Figure 1
The flow diagram of this study.
Figure 2
Figure 2
Construction of a prognostic signature for prostate cancer. The heatmap (A) and volcano (B) showed the DEirlncRNAs in TCGA database. (C) Process of variable selection in LASSO regression with 10-fold cross-validation. (D) Confidence interval in every lambda of LASSO regression.
Figure 3
Figure 3
Evaluation of a risk model for prostate cancer in the training set. (A) The risk curve of each sample reordered by risk score. (B) The scatter plot of the samples of BCR. (C) Heatmap showed the expression profiles of the signature in the low-risk group and high-risk group. (D) Biochemical recurrence analysis for the signature. (E) Time-dependent ROC analysis curve for the signature. (F) Forest plot for univariate Cox regression analysis. (G) Forest plot for multivariate Cox regression analysis.
Figure 4
Figure 4
Evaluation of a risk model for prostate cancer in the testing set. (A) The risk curve of each sample reordered by risk score. (B) The scatter plot of the samples of BCR. (C) Heatmap showed the expression profiles of the signature in the low-risk group and high-risk group. (D) Biochemical recurrence analysis for the signature. (E) Time-dependent ROC analysis curve for the signature. (F) Forest plot for univariate Cox regression analysis. (G) Forest plot for multivariate Cox regression analysis.
Figure 5
Figure 5
The relationship between the signature and different clinical features. A strip chart (A) along with the scatter diagram showed the relationship among (B) age, (C) tumor grade, (D) stage, (E) BCR, (F) T stage, (G) N stage, (H) M stage and the risk score. . *P< 0.05, **P< 0.01, and ***P< 0.001.
Figure 6
Figure 6
Stratification survival analyses. (AH) Kaplan–Meier curve analyses of BCR-free time in subgroups stratified by different clinical features.
Figure 7
Figure 7
Construction and validation of nomogram. (A) Time-dependent ROC analysis curve for the signature and clinical factors in the entire set. (B) Decision curve analysis of the signature and different clinical factors. (C) The nomogram predicted the probability of the 1-, 2-, and 3-year BCR-free time. (DF) Calibration plot for the validation of the nomogram.
Figure 8
Figure 8
Landscape of mutation profiles between low- and high-risk groups. (A and B) Mutation information of the genes with high mutation frequencies in the low- and high-risk groups. (C and D) Variant classification, variant type, SNV classification, variants in per sample, and summary of variant classification in the two groups. (E and F) Co-expression analysis of Top 20 mutant genes in the two groups. *P< 0.05 and **P< 0.01.
Figure 9
Figure 9
The relationship between TMB and the signature. (A) The level of TMB in the low- and high-risk groups. (B) Pearson correlation analysis between TMB and risk score. (C) Kaplan–Meier curve analysis of BCR-free time for patients with TP53 wild or TP53 mutation. (D) Kaplan–Meier curve analyses of BCR-free time for patients with different TP53 status and risk groups. **P< 0.01.
Figure 10
Figure 10
Tumor immune microenvironment between low- and high-risk groups. (A) The relationship between the signature and tumor-infiltrating immune cells. (B) Heatmap of abundance of immune cells in the low- and high-risk groups. (CJ) Correlation between the signature and the infiltration of immune cell subtypes: (C) CD4+ T cells, (D) CD8+ T cells, (E) neutrophils, (F) macrophage, (G) myeloid dendritic cells, (H) B naive cells, (I) B cells, and (J) B memory cells. **P< 0.01.
Figure 11
Figure 11
Immune cell infiltration and immune function by ssGSEA algorithm. (A) The differences in the immune cells in the low- and high-risk groups. (B) Immune function in the two groups. (C) The expression of HLA family in the two groups. (D) The expression of immune checkpoint in the two groups. (E) The difference analysis of IPS between the two groups. *P< 0.05, **P< 0.01, and ***P< 0.001.
Figure 12
Figure 12
Assessment of medical treatment in low- and high-risk groups. (AF) Correlation between the signature and the IC50 of the drugs: (A) Bicalutamide, (B) Docetaxel, (C) Mitomycin C, (D) Doxorubicin, (E) Etoposide, and (F) Olaparib. *P< 0.05 and **P< 0.01.

Similar articles

Cited by

References

    1. Sung H, Ferlay J, Siegel RL, et al. Global cancer statistics 2020: GLOBOCAN estimates of incidence and mortality worldwide for 36 cancers in 185 countries. CA Cancer J Clin. 2021;71(3):209–249. doi:10.3322/caac.21660 - DOI - PubMed
    1. Siegel RL, Miller KD, Fuchs HE, Jemal A. Cancer statistics, 2021. CA Cancer J Clin. 2021;71(1):7–33. doi:10.3322/caac.21654 - DOI - PubMed
    1. Mccormick B, Mahmoud A, Williams S, Davis J. Biochemical recurrence after radical prostatectomy: current status of its use as a treatment endpoint and early management strategies. Indian J Urol. 2019;35(1):6–17. doi:10.4103/iju.IJU_355_18 - DOI - PMC - PubMed
    1. Carroll PH, Mohler JL. NCCN guidelines updates: prostate cancer and prostate cancer early detection. J Natl Compr Canc Netw. 2018;16(5S):620–623. doi:10.6004/jnccn.2018.0036 - DOI - PubMed
    1. Montironi R, Mazzucchelli R, Scarpelli M, et al. Prostate carcinoma II: prognostic factors in prostate needle biopsies. BJU Int. 2006;97(3):492–497. doi:10.1111/j.1464-410X.2006.05973.x - DOI - PubMed