. 2021 Nov 30:14:9067-9081.
doi: 10.2147/IJGM.S341345. eCollection 2021.

Exploring Prognosis-Associated Biomarkers of Estrogen-Independent Uterine Corpus Endometrial Carcinoma by Bioinformatics Analysis

Affiliations

Exploring Prognosis-Associated Biomarkers of Estrogen-Independent Uterine Corpus Endometrial Carcinoma by Bioinformatics Analysis

Youchun Ye et al. Int J Gen Med. .

Abstract

Background: Uterine corpus endometrial carcinoma (UCEC) is one of the most common female cancers with high incidence and mortality rates. In particular, the prognosis of type II UCEC is poorer than that of type I. However, the molecular mechanism underlying type II UCEC remains unclear.

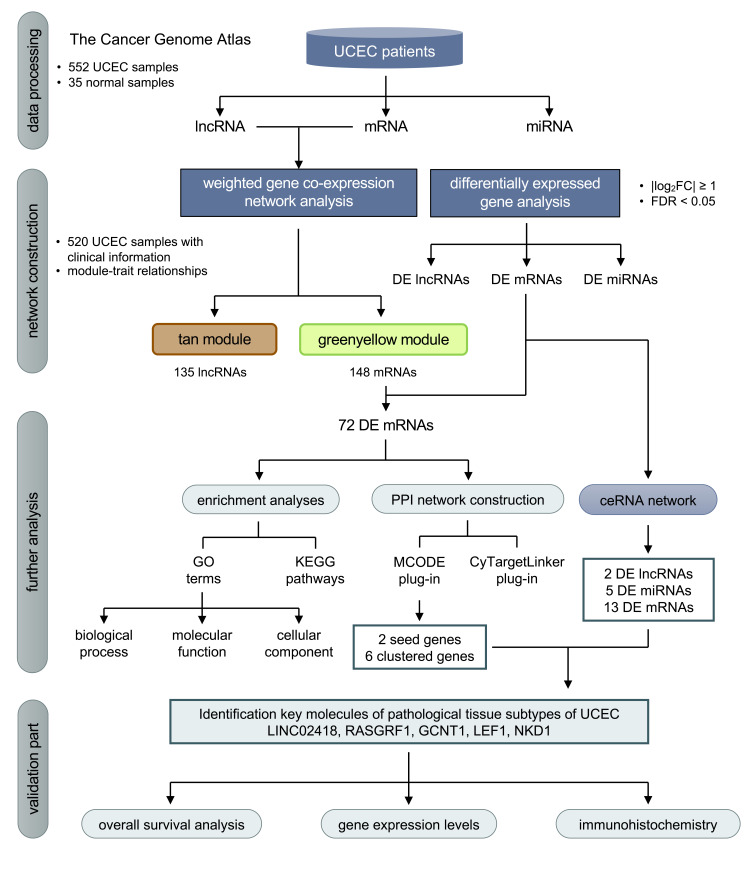
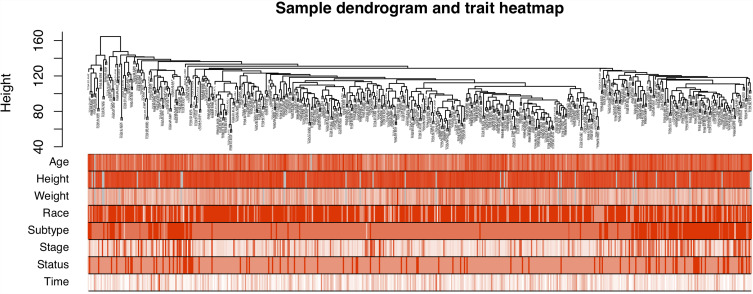
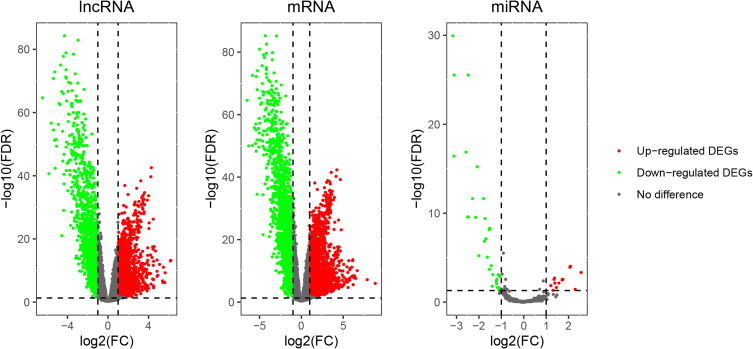
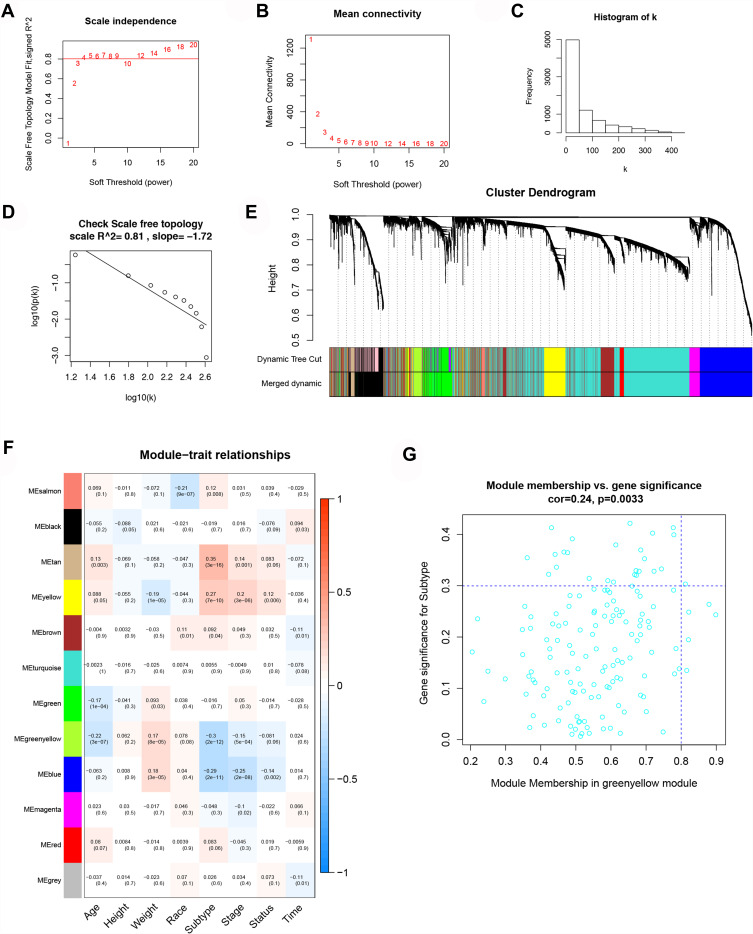
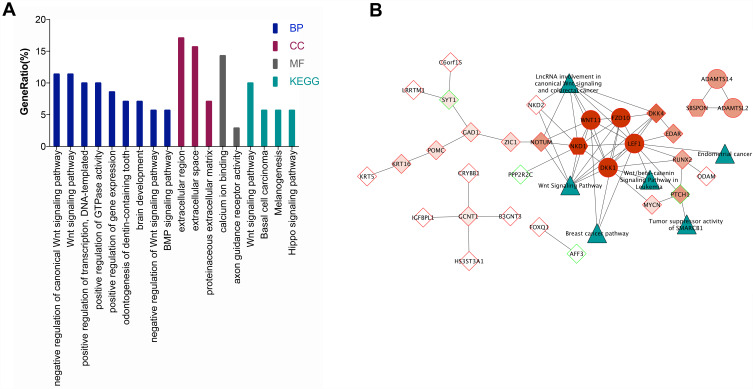
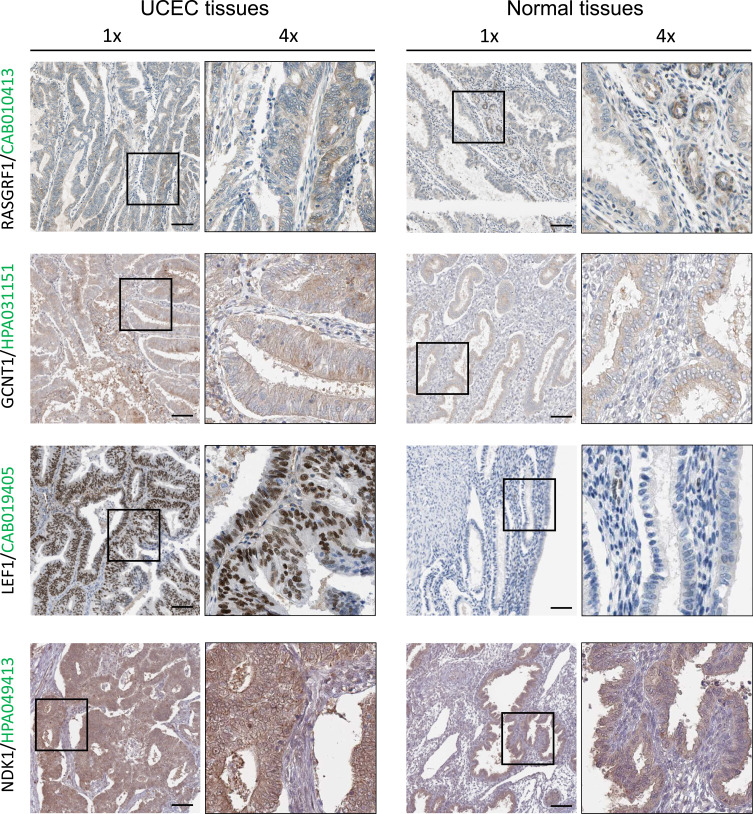
Methods: RNA-seq data and corresponding clinical information on UCEC patients were downloaded from The Cancer Genome Atlas database, which were then separated into mRNA, lncRNA, and miRNA gene expression profile matrix to perform differentially expressed gene analysis. Weighted gene co-expression network analysis (WGCNA) was used to identify key modules associated with different UCEC subtypes based on mRNA and lncRNA expression matrix. Following that, a subtype-associated competing endogenous RNA (ceRNA) regulatory network was constructed. In addition, GO functional annotation and KEGG pathway analysis were performed on subtype-related DE mRNAs, and STRING database was utilized to predict the interaction network between proteins and their biological functions. The key mRNAs were validated at the protein and gene expression levels in endometrial cancerous tissues as compared with normal tissues.

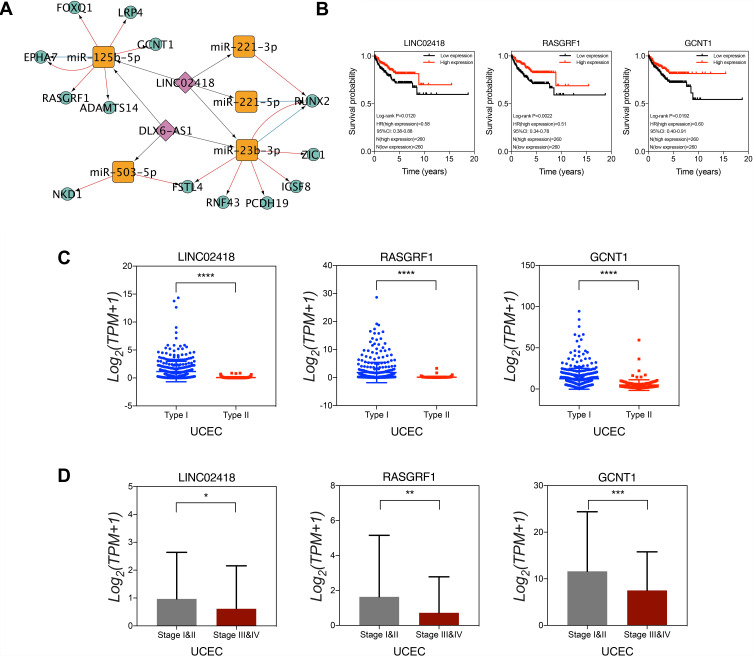
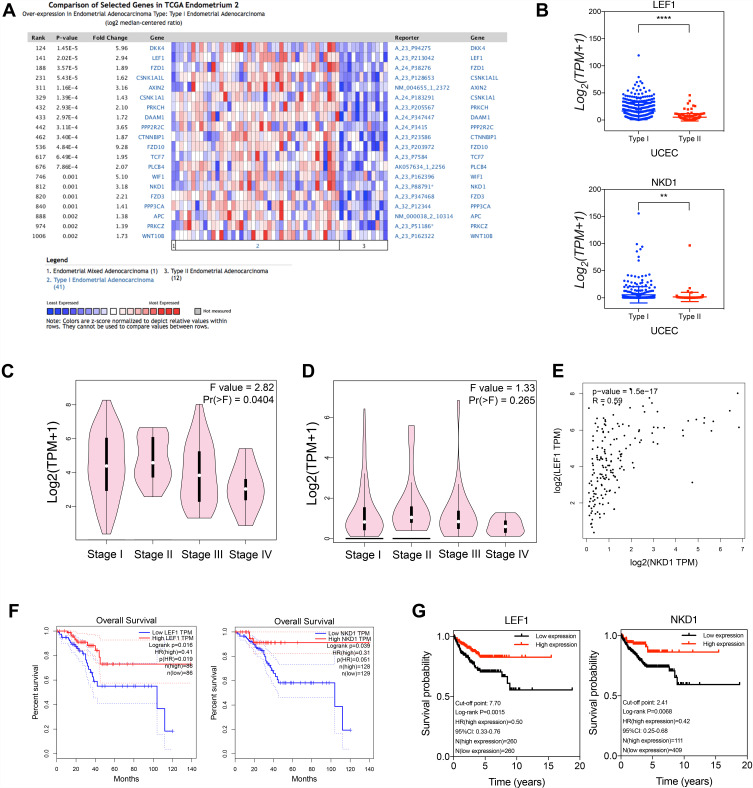
Results: In summary, we identified 4611 mRNA, 3568 lncRNAs, and 47 miRNAs as differentially expressed between endometrial cancerous tissues and normal endometrial tissues. WGCNA demonstrated that 72 mRNAs and 55 lncRNAs were correlated with pathological subtypes. In the constructed ceRNA regulatory network, LINC02418, RASGRF1, and GCNT1 were screened for their association with poor prognosis of type II UCEC. These DE mRNAs were linked to Wnt signaling pathway, and lower expression of LEF1 and NKD1 predicted advanced clinical stages and worse prognosis of UCEC patients.

Conclusion: This study revealed five prognosis-associated biomarkers that can be used to predict the worst prognosis of type II UCEC.

Keywords: WGCNA; competing endogenous RNA; estrogen-independent; prognosis; uterine corpus endometrial carcinoma.


Conflict of interest statement

The authors declare that they have no competing interests.

Figures

Figure 1
Figure 1
Flow chart of data processing, network construction, analysis and validation in the present study.
Figure 2
Figure 2
Hierarchical clustering tree and corresponding clinical feature information heat map of 520 samples, and the color depth only represents the value.
Figure 3
Figure 3
The volcano map of differentially expressed lncRNA, mRNA and miRNA. The green dots on the abscissa axis (log2FC) less than or equal to 1 represented downregulated genes and the red dots greater than or equal to 1 represented upregulated genes.
Figure 4
Figure 4
WGCNA of mRNA. (A) The relationship between SFT.R.sq and soft threshold (power). (B) The relationship between average connection degree and soft threshold (power). (C) Frequency distribution histogram of connection degree k in the case of ß=4. (D) The square (R2=0.81) and slope relationship of the correlation between each parameter log(p(k)) and log(k). (E) Module gene clustering dendrogram and dynamic cutting module heat map. (F) Heat map of the correlation between the module and the clinical characteristics of the sample. On the left is the ME value of the module and the bottom column is the different clinical features. The box shows the correlation coefficient and p value of each ME and clinical feature. (G) Scatter plot of the correlation between GS and MS and green yellow module was considered to be significantly related module.
Figure 5
Figure 5
CeRNA regulatory network construction and key molecular verification. (A) ceRNA regulatory network. (B) Low expression of LINC02418, RASGRF1 and GCNT1 was associated with poor prognosis of endometrial cancer. LINC02418, RASGRF1 and GCNT1 were significantly low expression in type II endometrial cancer (C) and advanced cancer (D). *p<0.05. **p<0.01. ***p<0.001. ****p<0.0001.
Figure 6
Figure 6
Functional enrichment analyses and PPI network construction. (A) The results of GO and KEGG enrichment analysis of 72 DE mRNAs in the GreenYellow module. (B) The protein interaction network of DE mRNAs in the GreenYellow module. The dark green triangles represent each pathway, the red represents the MCODE score from dark to light, the hexagon represents the seed gene, the circle represents the clustered gene, and the diamond represents the unclustered gene, the red frame indicates the upregulation of DE mRNAs and the green frame indicates the downregulation of DE mRNAs.
Figure 7
Figure 7
Key molecules’ verification of the expression level and survival analysis. (A) Gene expression profile of Wnt signaling pathway related molecules in type I and type II UCEC in Oncomine database. (B) RNA-seq data verified that the level of gene expression of LEF1 and NKD1 in type I and type II UCEC. LEF1 (C) and NKD1 (D) gene expression levels and their correlation (E) in different clinical stages. Both in the GEPIA database (F) and in the RNA-seq data (G), patients with low expression of LEF1 and NKD1 had a poor prognosis. **p<0.01. ****p<0.0001.
Figure 8
Figure 8
RASGRF1, GCNT1, LEF1 and NKD1 expression validation. Protein expression levels in UCEC as compared to those in normal tissues by IHC staining from the Human Protein Atlas database. Black square boxes represent typical normal and UCEC tissues, respectively. Scale bars represent 100 μm.

Similar articles

Cited by

References

    1. Morice P, Leary A, Creutzberg C, Abu-Rustum N, Darai E. Endometrial cancer. Lancet. 2016;387(10023):1094–1108. doi:10.1016/S0140-6736(15)00130-0 - DOI - PubMed
    1. Siegel RL, Miller KD, Jemal A. Cancer statistics, 2020. CA Cancer J Clin. 2020;70(1):7–30. doi:10.3322/caac.21590 - DOI - PubMed
    1. Wartko P, Sherman ME, Yang HP, Felix AS, Brinton LA, Trabert B. Recent changes in endometrial cancer trends among menopausal-age U.S. women. Cancer Epidemiol. 2013;37(4):374–377. doi:10.1016/j.canep.2013.03.008 - DOI - PMC - PubMed
    1. Bokhman JV. Two pathogenetic types of endometrial carcinoma. Gynecol Oncol. 1983;15(1):10–17. doi:10.1016/0090-8258(83)90111-7 - DOI - PubMed
    1. Emons G, Fleckenstein G, Hinney B, Huschmand A, Heyl W. Hormonal interactions in endometrial cancer. Endocr Relat Cancer. 2000;7(4):227–242. doi:10.1677/erc.0.0070227 - DOI - PubMed