

Textures vs Non-Textures: A Simple Computational Method for Classifying Perceived 'Texturality' in Natural Images
- PMID: 34876972
- PMCID: PMC8645308
- DOI: 10.1177/20416695211054540
Textures vs Non-Textures: A Simple Computational Method for Classifying Perceived 'Texturality' in Natural Images
Abstract
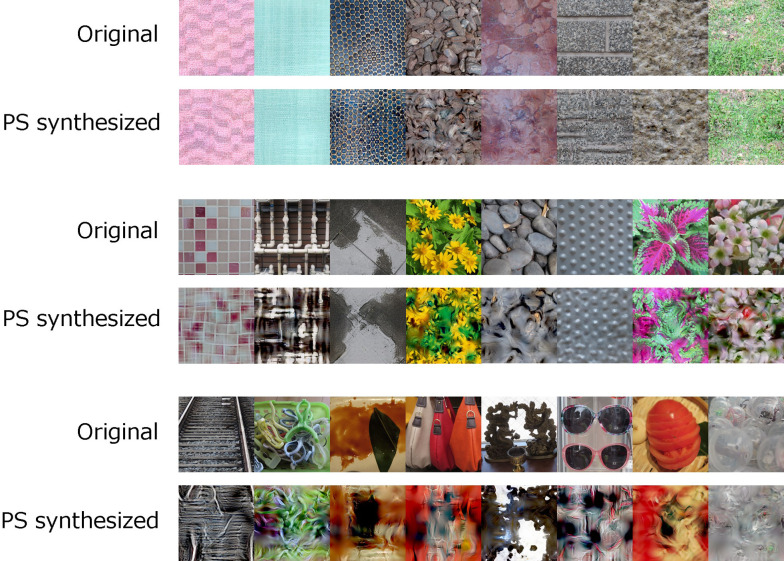
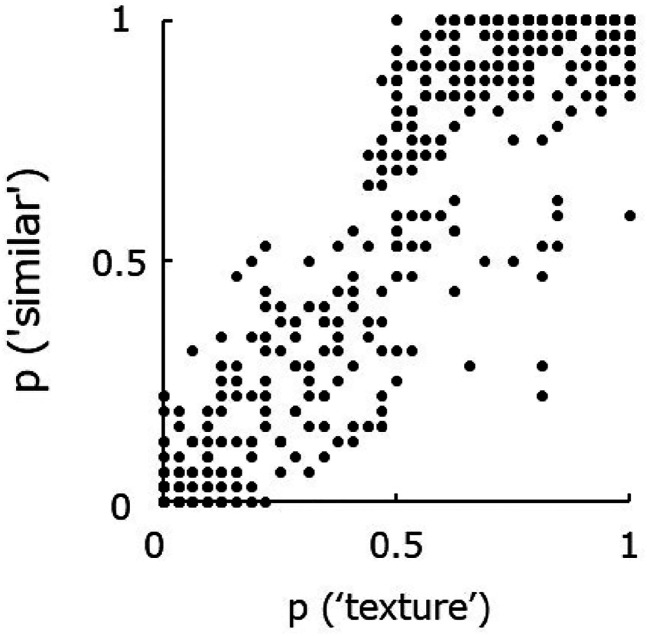
The visual system represents textural image regions as simple statistics that are useful for the rapid perception of scenes and surfaces. What images 'textures' are, however, has so far mostly been subjectively defined. The present study investigated the empirical conditions under which natural images are processed as texture. We first show that 'texturality' - i.e., whether or not an image is perceived as a texture - is strongly correlated with the perceived similarity between an original image and its Portilla-Simoncelli (PS) synthesized image. We found that both judgments are highly correlated with specific PS statistics of the image. We also demonstrate that a discriminant model based on a small set of image statistics could discriminate whether a given image was perceived as a texture with over 90% accuracy. The results provide a method to determine whether a given image region is represented statistically by the human visual system.
Keywords: natural image statistics; spatial vision; surfaces/materials; texture.
© The Author(s) 2021.
Conflict of interest statement
Declaration of Conflicting Interests: The author(s) declared no potential conflicts of interest with respect to the research, authorship, and/or publication of this article.
Figures


References
-
- Gibson J. J. (1979). The ecological approach to visual perception. Houghton Mifflin.
-
- Heeger D. J., Bergen J. R. (1995). Pyramid-based texture analysis/synthesis. Proceedings of the 22nd annual conference on Computer graphics and interactive techniques, pp. 229–238.
LinkOut - more resources
Full Text Sources
