. 2021 Aug 16;8(11):nwab148.
doi: 10.1093/nsr/nwab148. eCollection 2021 Nov.

Mobility in China, 2020: a tale of four phases

Affiliations

Mobility in China, 2020: a tale of four phases

Suoyi Tan et al. Natl Sci Rev. .

Abstract

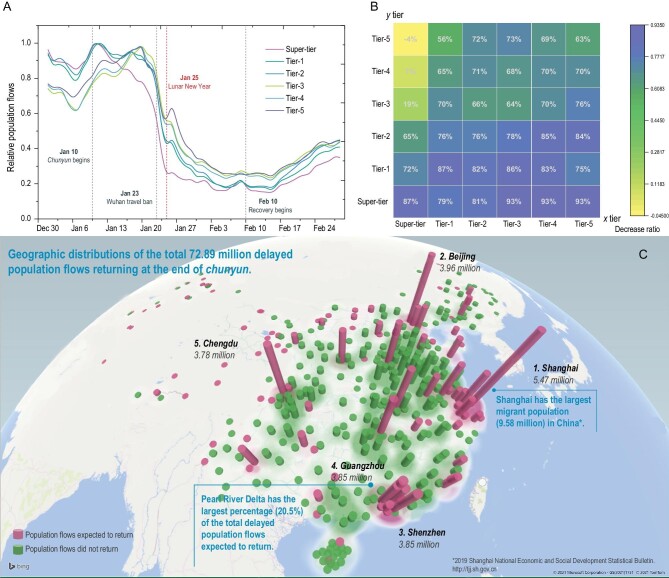
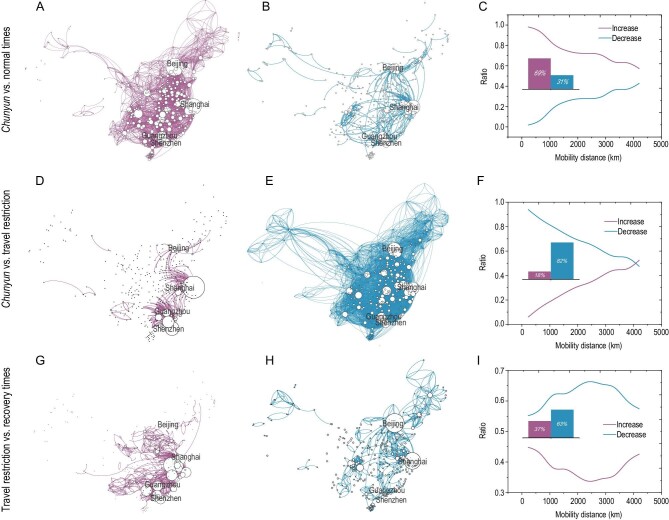
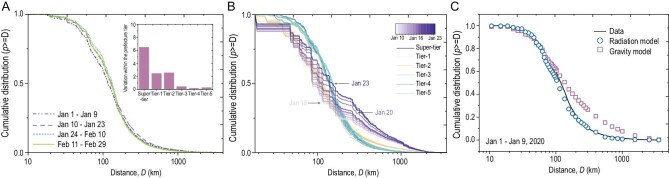
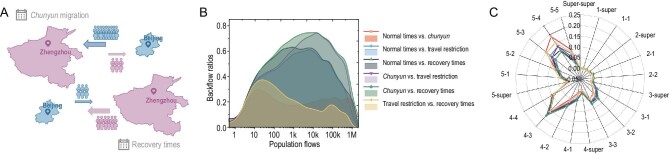
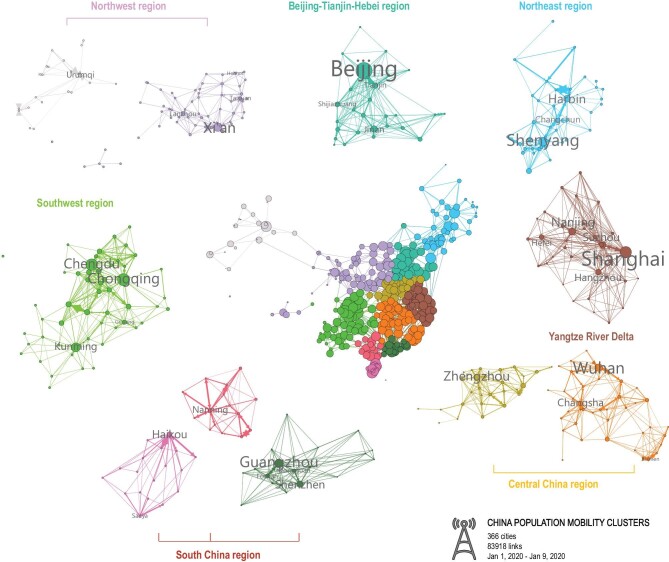
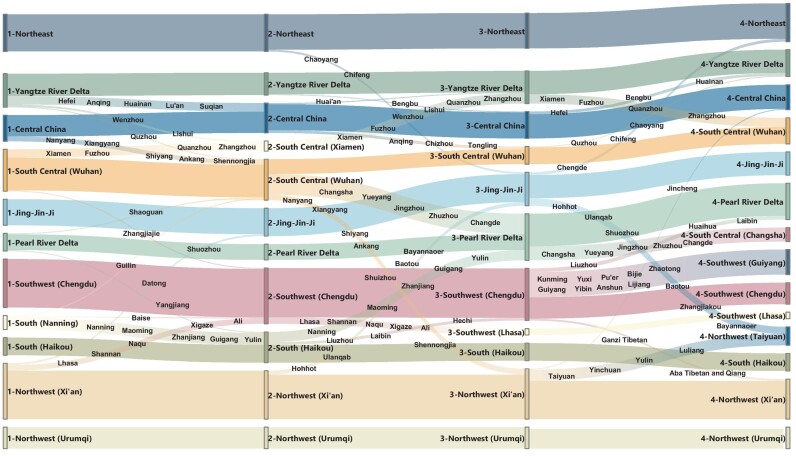
2020 was an unprecedented year, with rapid and drastic changes in human mobility due to the COVID-19 pandemic. To understand the variation in commuting patterns among the Chinese population across stable and unstable periods, we used nationwide mobility data from 318 million mobile phone users in China to examine the extreme fluctuations of population movements in 2020, ranging from the Lunar New Year travel season (chunyun), to the exceptional calm of COVID-19 lockdown, and then to the recovery period. We observed that cross-city movements, which increased substantially in chunyun and then dropped sharply during the lockdown, are primarily dependent on travel distance and the socio-economic development of cities. Following the Lunar New Year holiday, national mobility remained low until mid-February, and COVID-19 interventions delayed more than 72.89 million people returning to large cities. Mobility network analysis revealed clusters of highly connected cities, conforming to the social-economic division of urban agglomerations in China. While the mass migration back to large cities was delayed, smaller cities connected more densely to form new clusters. During the recovery period after travel restrictions were lifted, the netflows of over 55% city pairs reversed in direction compared to before the lockdown. These findings offer the most comprehensive picture of Chinese mobility at fine resolution across various scenarios in China and are of critical importance for decision making regarding future public-health-emergency response, transportation planning and regional economic development, among others.

Keywords: COVID-19; behavioral response; human mobility; mobile phone data; travel restrictions.


Figures

Figure 1.
Figure 1.
Temporal patterns of population flow in China in early 2020. (A) Aggregated population flows for all prefectures from 1 January to 29 February 2020. Each curve represents changes in flows for each prefecture tier over 60 days. Data were normalized by the maximum flow value in each tier. (B) The mobility decrease ratio before (from 17 to 23 January, the week prior to the implementation of lockdown measures) and after (from 1 to 7 February, the week after the Lunar New Year holiday) Wuhan travel ban. Each cell (x tier, y tier) represents the ratio for flow from cities in tier y to tier x. (C) The geographic distribution of the delayed population flows due to travel restrictions. These flows were expected to return at the end of chunyun.
Figure 2.
Figure 2.
A comparison of spatial patterns of mobility across four periods. The mobility network is visualized with links that decrease/increase by more than 200 in average daily flows. (A, D and G) Links that exhibited increases in population flow in comparison with the previous period. The size of the node is proportional to total outflows for (A), and total inflows for (D and G). (B, E and H) Links that exhibited decreases in population flow in comparison with the previous period. The size of the node is proportional to total inflows for (B and H), and total outflows for (E). (C, F and I) The association of mobility distance with the ratio of links with increased or decreased travel. Each bar shows the ratio of links with increased or decreased travel, and each curve shows the variation tendency.
Figure 3.
Figure 3.
Overall population movements. (A) Plots of cumulative probability distribution against daily travel distance (log) across all four periods. The subgraph shows the variability of movement within prefecture tiers across all four periods. The cumulative probability distribution of daily travel distances is denoted by p, and the mean distribution over all 60 days is denoted byformula image. For each day k, we calculate the proximity of formula image to formula image to express the variability of movement, and then we arrive at the sum of 60 days’ variation. (B) Plots of the cumulative probability distribution of movements grouped by prefecture tiers against distance (log) for chunyun (10–23 January). Each line represents the probability distribution per day. (C) Plots of travel distance distributions produced by the gravity and radiation models, compared with real data during normal times.
Figure 4.
Figure 4.
Formalization of backflow variation modes in human mobility patterns. (A) An illustration of the hypothesized backflow pathways between two prefectures. (B) Plots of backflow ratios (the fraction between backflow links and total links occurring across all pairs of cities at the two compared periods) versus aggregate population flows (the total flow during two compared periods on the same link). Pairwise comparisons were made for every two periods. (C) Backflow ratios for all pairs of prefecture tiers.
Figure 5.
Figure 5.
The community structure of all prefectures during normal times in Chinese mainland. Nodes of the same color belong to the same community, as detected by the Louvain algorithm. Link weights indicate the directed average daily number of trips between the two connected nodes, which shows the strength of the interaction between two prefectures. The community structure network is visualized with links weighted over 10 000.
Figure 6.
Figure 6.
Alluvial diagram for mapping community dynamics in the mobility network. The height of a streamline between two stages is proportional to the number of movements that migrate between two communities.

Similar articles

Cited by

References

    1. Bassolas A, Barbosa-Filho H, Dickinson B, et al. Hierarchical organization of urban mobility and its connection with city livability. Nat Commun 2019; 10: 4817.10.1038/s41467-019-12809-y - DOI - PMC - PubMed
    1. Çolak S, Lima A, González MC. Understanding congested travel in urban areas. Nat Commun 2016; 7: 10793.10.1038/ncomms10793 - DOI - PMC - PubMed
    1. Kraemer MU, Yang C-H, Gutierrez B, et al. The effect of human mobility and control measures on the COVID-19 epidemic in China. Science 2020; 368: 493–7.10.1126/science.abb4218 - DOI - PMC - PubMed
    1. Barbosa H, Barthelemy M, Ghoshal G, et al. Human mobility: models and applications. Phys Rep 2018; 734: 1–74.10.1016/j.physrep.2018.01.001 - DOI
    1. González MC, Hidalgo CA, Barabási A-L. Understanding individual human mobility patterns. Nature 2008; 453: 779–82.10.1038/nature06958 - DOI - PubMed