

No Consistent Link Between Dust Storms and Valley Fever (Coccidioidomycosis)
- PMID: 34877441
- PMCID: PMC8628988
- DOI: 10.1029/2021GH000504
No Consistent Link Between Dust Storms and Valley Fever (Coccidioidomycosis)
Abstract
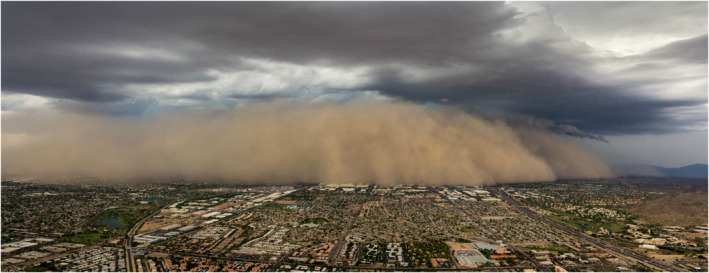
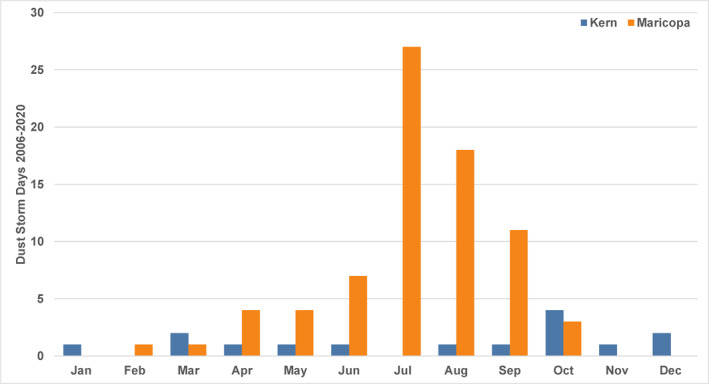
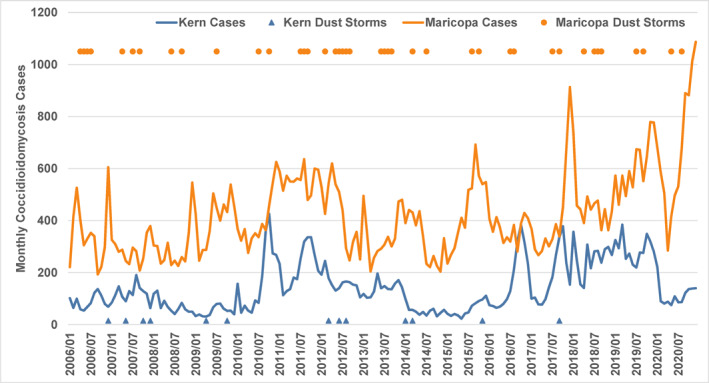
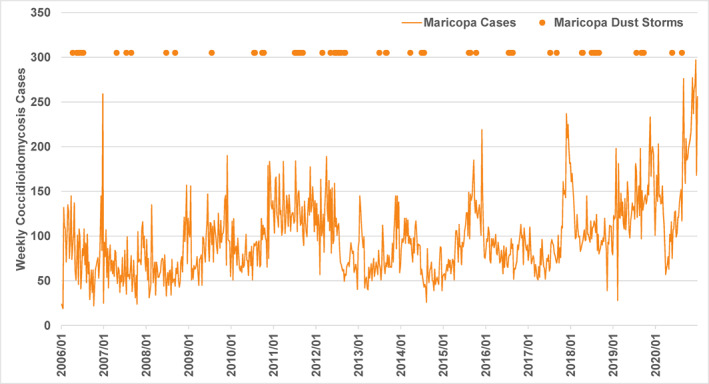
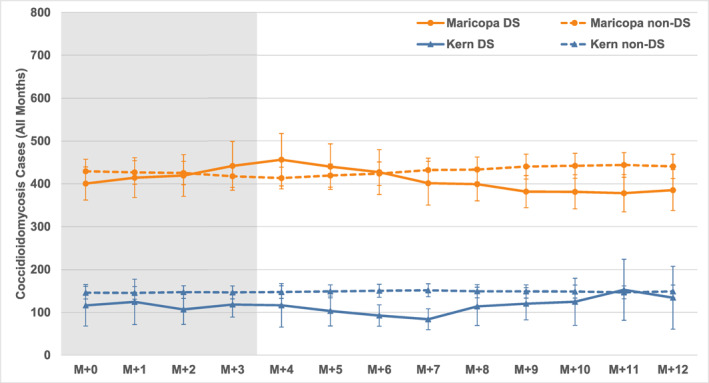
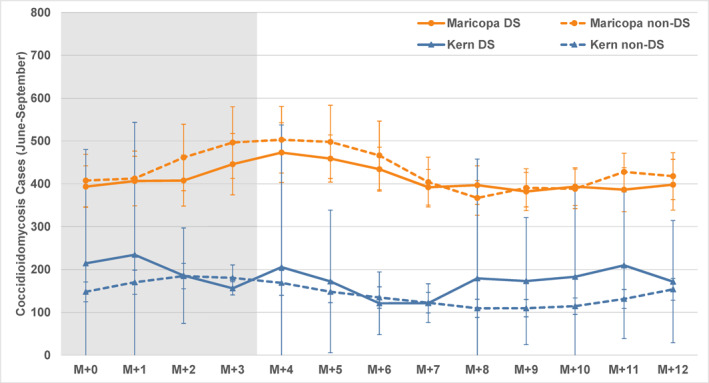
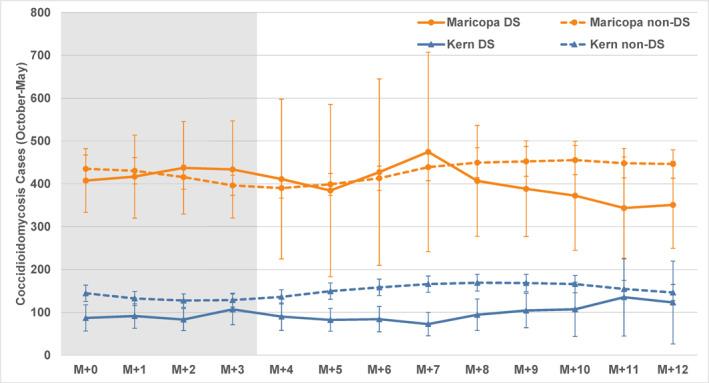
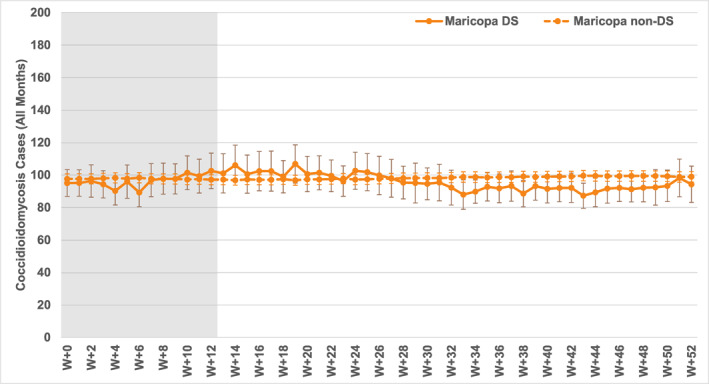
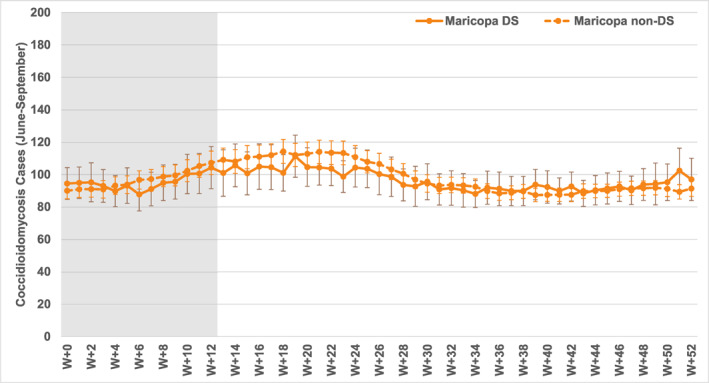
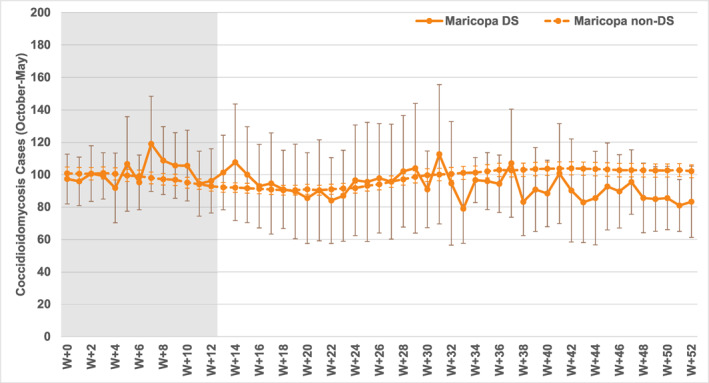
Dust storms, such as those associated with haboobs and strong regional winds, are frequently assumed to cause increases in cases of Valley fever (coccidioidomycosis). The disease is caused by inhaling arthroconidia of Coccidioides fungi that, after being disturbed from semi-desert subsoil, have become airborne. Fungal arthroconidia can be transported in low-wind conditions as well as in individual dust events, but there is no reliable evidence that all or most dust storms consistently lead to subsequent increases in coccidioidomycosis cases. Following a review of the relevant literature, this study examines the relationship between dust storms and coccidioidomycosis cases to determine if there is a consistent and general association between them. All recorded dust storms from 2006 to 2020 in and near the Phoenix area of Maricopa County, Arizona and the Bakersfield area of Kern County, California were used in a compositing analysis (superposed epoch analysis) of subsequent coccidioidomycosis cases in each area. Analyses of monthly and weekly disease case data showed no statistical differences in the patterns of coccidioidomycosis cases following dust storms versus non-dust storm conditions, for the entire data set as well as for seasonal subsets of the data. This study thoroughly analyzes post-dust storm coccidioidomycosis cases for a large set of dust storms, and it confirms and expands upon previous literature, including a recent study that measured airborne arthroconidia and found no consistent links connecting wind and dust conditions to increases in coccidioidomycosis.
Keywords: Valley fever; climate; coccidioidomycosis; disease; dust storms; haboobs; health; weather.
© 2021 The Authors. GeoHealth published by Wiley Periodicals LLC on behalf of American Geophysical Union.
Conflict of interest statement
The author declares no conflicts of interest relevant to this study.
Figures
Similar articles
-
PM10 and Other Climatic Variables Are Important Predictors of Seasonal Variability of Coccidioidomycosis in Arizona.Microbiol Spectr. 2022 Apr 27;10(2):e0148321. doi: 10.1128/spectrum.01483-21. Epub 2022 Mar 23. Microbiol Spectr. 2022. PMID: 35319247 Free PMC article.
-
Climate controls on valley fever incidence in Kern County, California.Int J Biometeorol. 2006 Jan;50(3):174-82. doi: 10.1007/s00484-005-0007-6. Epub 2005 Oct 26. Int J Biometeorol. 2006. PMID: 16249922
-
Investigating the Relationship Between Climate and Valley Fever (Coccidioidomycosis).Ecohealth. 2018 Dec;15(4):840-852. doi: 10.1007/s10393-018-1375-9. Epub 2018 Oct 3. Ecohealth. 2018. PMID: 30284073
-
Valley fever under a changing climate in the United States.Environ Int. 2024 Nov;193:109066. doi: 10.1016/j.envint.2024.109066. Epub 2024 Oct 11. Environ Int. 2024. PMID: 39432997 Review.
-
Fluctuations in climate and incidence of coccidioidomycosis in Kern County, California: a review.Ann N Y Acad Sci. 2007 Sep;1111:73-82. doi: 10.1196/annals.1406.028. Epub 2007 Mar 8. Ann N Y Acad Sci. 2007. PMID: 17347336 Review.
Cited by
-
Update on the Epidemiology, Diagnosis, and Treatment of Coccidioidomycosis.J Fungi (Basel). 2022 Jun 25;8(7):666. doi: 10.3390/jof8070666. J Fungi (Basel). 2022. PMID: 35887423 Free PMC article. Review.
-
Understanding the exposure risk of aerosolized Coccidioides in a Valley fever endemic metropolis.Sci Rep. 2024 Jan 15;14(1):1311. doi: 10.1038/s41598-024-51407-x. Sci Rep. 2024. PMID: 38225347 Free PMC article.
-
Infectious Diseases Associated with Desert Dust Outbreaks: A Systematic Review.Int J Environ Res Public Health. 2022 Jun 5;19(11):6907. doi: 10.3390/ijerph19116907. Int J Environ Res Public Health. 2022. PMID: 35682493 Free PMC article.
-
PM10 and Other Climatic Variables Are Important Predictors of Seasonal Variability of Coccidioidomycosis in Arizona.Microbiol Spectr. 2022 Apr 27;10(2):e0148321. doi: 10.1128/spectrum.01483-21. Epub 2022 Mar 23. Microbiol Spectr. 2022. PMID: 35319247 Free PMC article.
-
Was Coccidioides a Pre-Columbian Hitchhiker to Southcentral Washington?mBio. 2023 Apr 25;14(2):e0023223. doi: 10.1128/mbio.00232-23. Epub 2023 Mar 7. mBio. 2023. PMID: 36880777 Free PMC article. Review.
References
-
- ADHS–Arizona Department of Health Services . (2018). Valley Fever 2017 annual report. Retrieved from https://www.azdhs.gov/preparedness/epidemiology-disease-control/valley-f...
-
- Brown, H. E. , Comrie, A. C. , Tamerius, J. , Khan, M. , Tabor, J. A. , & Galgiani, J. N. (2014). Climate, wind storms, and the risk of Valley fever (coccidioidomycosis). In Institute of Medicine, The Influence of Global Environmental Change on Infectious Disease Dynamics: Workshop Summary (pp. 266–282). The National Academies Press. 10.17226/18800 - DOI - PubMed
LinkOut - more resources
Full Text Sources