

EEG source imaging concordance with intracranial EEG and epileptologist review in focal epilepsy
- PMID: 34877536
- PMCID: PMC8643498
- DOI: 10.1093/braincomms/fcab278
EEG source imaging concordance with intracranial EEG and epileptologist review in focal epilepsy
Abstract
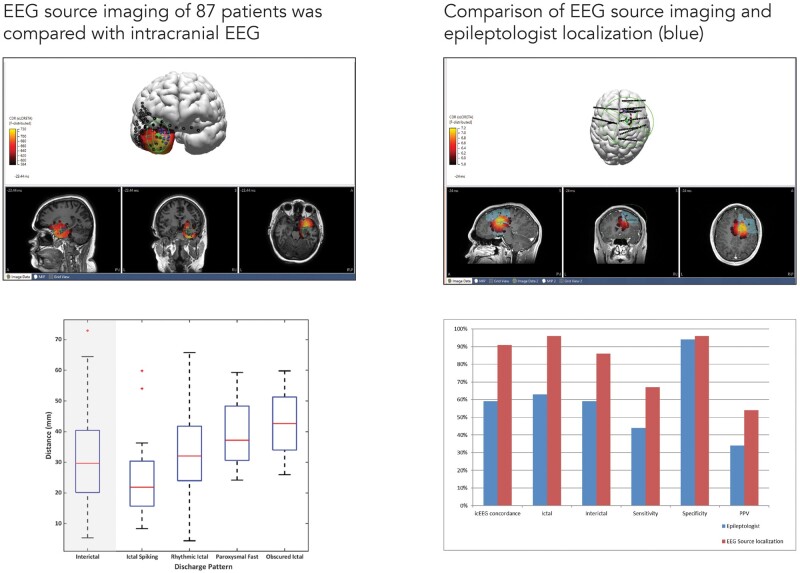
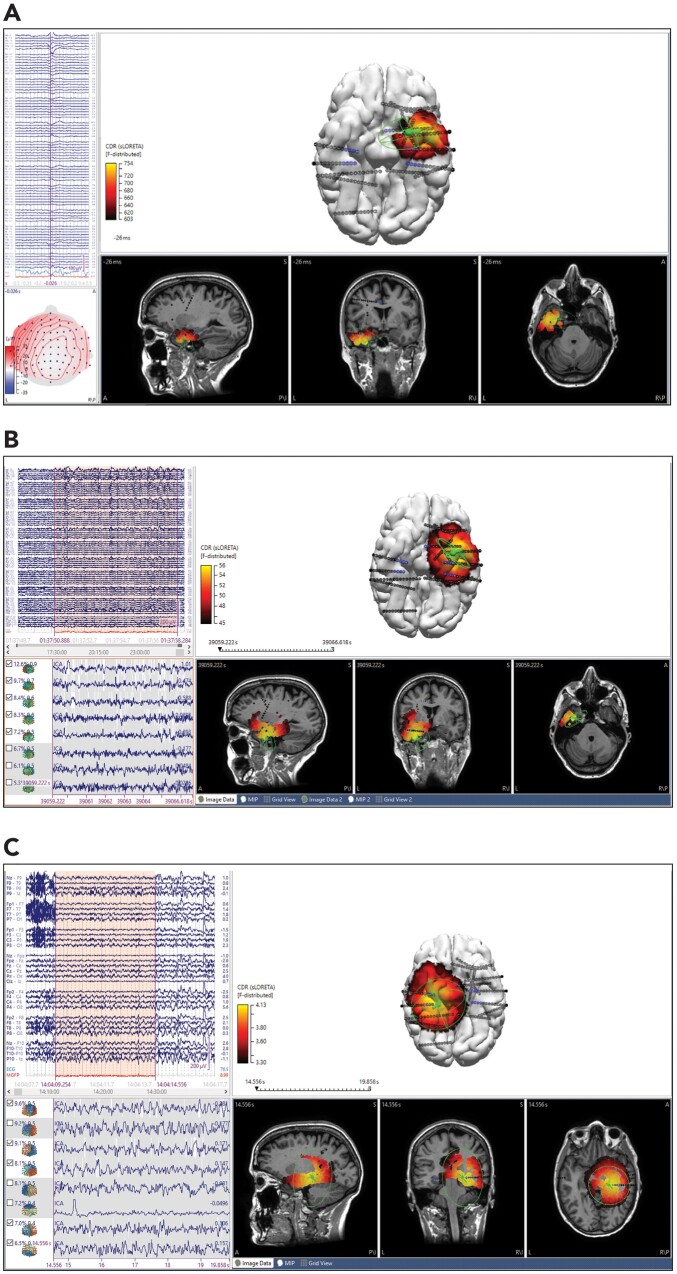
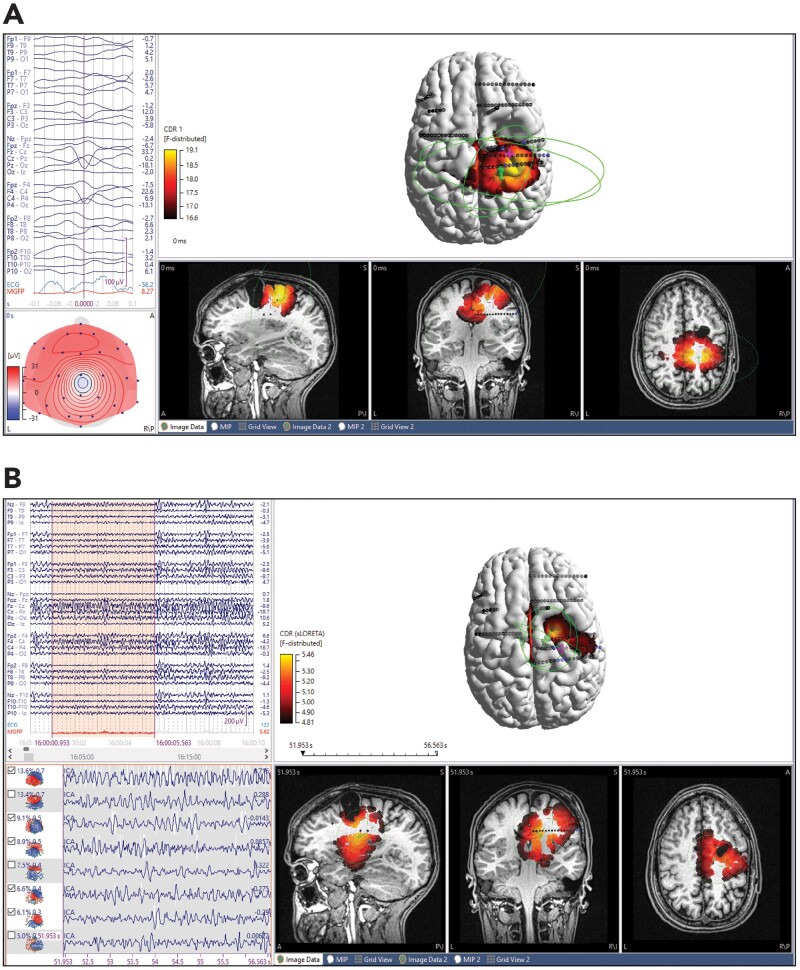
EEG source imaging is becoming widely used for the evaluation of medically refractory focal epilepsy. The validity of EEG source imaging has been established in several studies comparing source imaging to the surgical resection cavity and subsequent seizure freedom. We present a cohort of 87 patients and compare EEG source imaging of both ictal and interictal scalp EEG to the seizure onset zone on intracranial EEG. Concordance of EEG source imaging with intracranial EEG was determined on a sublobar level and was quantified by measuring the distance between the source imaging result and the centroid of the active seizure onset zone electrodes. The EEG source imaging results of a subgroup of 26 patients with high density 76-channel EEG were compared with the localization of three experienced epileptologists. Of 87 patients, 95% had at least one analysis concordant with intracranial EEG and 74% had complete concordance. There was a higher rate of complete concordance in temporal lobe epilepsy compared to extratemporal (89.3 and 62.8%, respectively, P = 0.015). Of the total 282 analyses performed on this cohort, higher concordance was also seen in temporal discharges (95%) compared to extratemporal (77%) (P = 0.0012), but no difference was seen comparing high-density EEG with standard (32-channel) EEG. Subgroup analysis of ictal waveforms showed greater concordance for ictal spiking, compared with rhythmic activity, paroxysmal fast activity, or obscured onset. Median distances from the dipole and maximum distributed source to a centroid of seizure onset zone electrodes were 30.0 and 32.5 mm, respectively, and the median distances from dipole and maximum distributed source to nearest seizure onset zone electrode were 22.8 and 21.7, respectively. There were significantly shorter distances in ictal spiking. There were shorter distances in patients with Engel Class 1 outcome from surgical resection compared to patients with worse outcomes. For the subgroup of 26 high-density EEG patients, EEG source localization had a significantly higher concordance (92% versus 65%), sensitivity (57% versus 35%) and positive predictive value (60% versus 36%) compared with epileptologist localization. Our study demonstrates good concordance between ictal and interictal source imaging and intracranial EEG. Temporal lobe discharges have higher concordance rates than extratemporal discharges. Importantly, this study shows that source imaging has greater agreement with intracranial EEG than visual review alone, supporting its role in surgical planning.
Keywords: EEG source imaging; epilepsy surgery; intracranial EEG; source localization.
© The Author(s) (2021). Published by Oxford University Press on behalf of the Guarantors of Brain.
Figures
Similar articles
-
Interictal and ictal source localization for epilepsy surgery using high-density EEG with MEG: a prospective long-term study.Brain. 2019 Apr 1;142(4):932-951. doi: 10.1093/brain/awz015. Brain. 2019. PMID: 30805596 Free PMC article.
-
Source localization of ictal epileptic activity investigated by high resolution EEG and validated by SEEG.Neuroimage. 2010 Jun;51(2):642-53. doi: 10.1016/j.neuroimage.2010.02.067. Epub 2010 Mar 4. Neuroimage. 2010. PMID: 20206700
-
Contribution of Ictal Source Imaging for Localizing Seizure Onset Zone in Patients With Focal Epilepsy.Neurology. 2021 Jan 19;96(3):e366-e375. doi: 10.1212/WNL.0000000000011109. Epub 2020 Oct 23. Neurology. 2021. PMID: 33097598 Free PMC article.
-
Surgical approaches in nonlesional neocortical epilepsy.J Epilepsy Res. 2011 Dec 30;1(2):47-51. doi: 10.14581/jer.11009. eCollection 2011 Dec. J Epilepsy Res. 2011. PMID: 24649445 Free PMC article. Review.
-
Long-term outcomes after nonlesional extratemporal lobe epilepsy surgery.JAMA Neurol. 2013 Aug;70(8):1003-8. doi: 10.1001/jamaneurol.2013.209. JAMA Neurol. 2013. PMID: 23732844 Free PMC article. Review.
Cited by
-
Sleep-wake states change the interictal localization of candidate epileptic source generators.Sleep. 2022 Jun 13;45(6):zsac062. doi: 10.1093/sleep/zsac062. Sleep. 2022. PMID: 35279715 Free PMC article.
-
Feasibility of high-density electric source imaging in the presurgical workflow: Effect of number of spikes and automated spike detection.Epilepsia Open. 2023 Sep;8(3):785-796. doi: 10.1002/epi4.12732. Epub 2023 Jun 1. Epilepsia Open. 2023. PMID: 36938790 Free PMC article.
-
Interictal magnetoencephalography abnormalities to guide intracranial electrode implantation and predict surgical outcome.Brain Commun. 2023 Oct 25;5(6):fcad292. doi: 10.1093/braincomms/fcad292. eCollection 2023. Brain Commun. 2023. PMID: 37953844 Free PMC article.
-
Validating EEG source imaging using intracranial electrical stimulation.Brain Commun. 2023 Feb 7;5(1):fcad023. doi: 10.1093/braincomms/fcad023. eCollection 2023. Brain Commun. 2023. PMID: 36824389 Free PMC article.
-
Low-density scalp electrical source imaging of the ictal onset zone network using source coherence maps.Front Neurol. 2024 Dec 19;15:1483977. doi: 10.3389/fneur.2024.1483977. eCollection 2024. Front Neurol. 2024. PMID: 39748857 Free PMC article.
References
-
- Ramantani G, Maillard L, Koessler L.. Correlation of invasive EEG and scalp EEG. Seizure. 2016;41:196–200. - PubMed
-
- Ebersole JS, Hawes-Ebersole S.. Clinical application of dipole models in localization of epilpetiform activity. J Clin Neurophysiol. 2007;24(2):120–129. - PubMed
-
- Ebersole JS, Wade PB.. Spike voltage topography and equivalent dipole localization in complex partial epilepsy. Brain Topogr. 1990;3(1):21–34. - PubMed
-
- Gavaret M, Badier J-M, Marquis P, et al.Electric source imaging in frontal lobe epilepsy. J Clin Neurophysiol. 2006;23(4):358–370. - PubMed
-
- Lantz G, Ryding E, Rosén I.. Three-dimensional localization of interictal epileptiform activity with dipole analysis: Comparison with intracranial recordings and SPECT findings. J Epilepsy. 1994;7(2):117–129.
LinkOut - more resources
Full Text Sources