. 2022 Feb;13(1):728-742.
doi: 10.1002/jcsm.12882. Epub 2021 Dec 8.

Msi2-mediated MiR7a-1 processing repression promotes myogenesis

Affiliations

Msi2-mediated MiR7a-1 processing repression promotes myogenesis

Wenjun Yang et al. J Cachexia Sarcopenia Muscle. 2022 Feb.

Erratum in

Abstract

Background: Most of the microRNAs (MiRs) involved in myogenesis are transcriptional regulated. The role of MiR biogenesis in myogenesis has not been characterized yet. RNA-binding protein Musashi 2 (Msi2) is considered to be one of the major drivers for oncogenesis and stem cell proliferation. The functions of Msi2 in myogenesis have not been explored yet. We sought to investigate Msi2-regulated biogenesis of MiRs in myogenesis and muscle stem cell (MuSC) ageing.

Methods: We detected the expression of Msi2 in MuSCs and differentiated myotubes by quantitative reverse transcription PCR (RT-qPCR) and western blot. Msi2-binding partner human antigen R (HuR) was identified by immunoprecipitation followed by mass spectrometry analysis. The cooperative binding of Msi2 and HuR on MiR7a-1 was analysed by RNA immunoprecipitation and electrophoresis mobility shift assays. The inhibition of the processing of pri-MiR7a-1 mediated by Msi2 and HuR was shown by Msi2 and HuR knockdown. Immunofluorescent staining, RT-qPCR and immunoblotting were used to characterize the function of MiR7a-1 in myogenesis. Msi2 and HuR up-regulate cryptochrome circadian regulator 2 (Cry2) via MiR7a-1 was confirmed by the luciferase assay and western blot. The post-transcriptional regulatory cascade was further confirmed by RNAi and overexpressing of Msi2 and HuR in MuSCs, and the in vivo function was characterized by histopathological and molecular biological methods in Msi2 knockout mice.

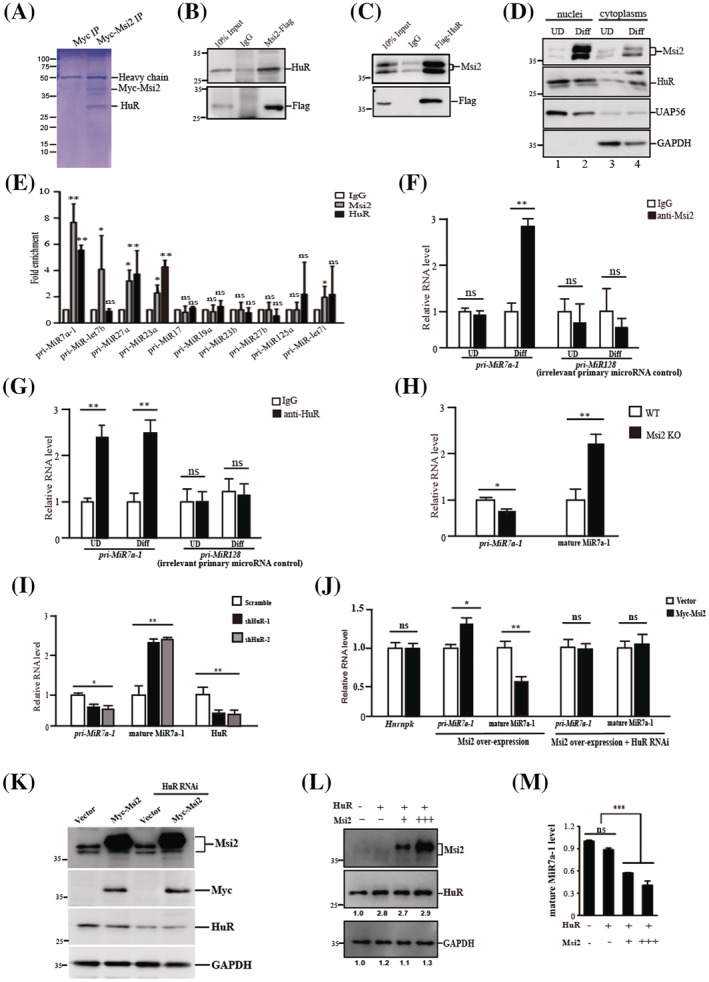
Results: We identified a post-transcription regulatory cascade governed by a pair of RNA-binding proteins Msi2 and HuR. Msi2 is enriched in differentiated muscle cells and promotes MuSC differentiation despite its pro-proliferation functions in other cell types. Msi2 works synergistically with another RNA-binding protein HuR to repress the biogenesis of MiR7a-1 in an Msi2 dose-dependent manner to regulate the translation of the key component of the circadian core oscillator complex Cry2. Down-regulation of Cry2 (0.6-fold, vs. control, P < 0.05) mediated by MiR7a-1 represses MuSC differentiation. The disruption of this cascade leads to differentiation defects of MuSCs. In aged muscles, Msi2 (0.3-fold, vs. control, P < 0.01) expression declined, and the Cry2 protein level also decreases (0.5-fold, vs. control, P < 0.05), suggesting that the disruption of the Msi2-mediated post-transcriptional regulatory cascade could attribute to the declined ability of muscle regeneration in aged skeletal muscle.

Conclusions: Our findings have identified a new post-transcriptional cascade regulating myogenesis. The cascade is disrupted in skeletal muscle ageing, which leads to declined muscle regeneration ability.

Keywords: HuR; MiR7a-1 processing; Msi2; Myogenesis; Skeletal muscle ageing.


Conflict of interest statement

The authors declare no conflicts of interests.

Figures

Figure 1
Figure 1
Msi2 expression increased in differentiated MuSCs and required for MuSC differentiation. (A) Expression levels of Msi2 in primary MuSCs before and after differentiation, respectively. RT‐qPCR was performed with RNA extracted from the primary MuSCs before or after differentiation. The results were normalized to GAPDH. Error bars indicated standard deviation and were based on three independent experiments. *** indicated P < 0.001. (B) Protein levels of Msi2 in primary MuSCs before and after differentiation, respectively. Immunoblotting assays were performed with whole cell extracts from primary MuSCs or myotubes differentiated from MuSCs. MyHC indicated the differentiation status of MuSCs. GAPDH served as an internal control. The numbers below each panel indicated relative signal intensity. (C) Protein levels of Msi2 in undifferentiated and differentiated primary MuSCs treated by control or two pieces of Msi2‐specific shRNAs. Immunoblotting assays were performed with whole cell extracts. GAPDH served as an internal control. The numbers below each panel indicated relative signal intensity. (D) Immunofluorescent staining of MyHC in myotubes differentiated from MuSCs treated with scramble or two Msi2‐specific shRNAs. Green indicated MyHC; blue indicated DAPI staining of nuclei; merge indicated the merged images of green and blue. Scale bars: 50 μm. (E) Statistical analysis of the average length of myotubes. Error bars indicated standard deviation calculated based on four independent experiments. *** indicated P < 0.001. (F) Statistical analysis of the fusion index of myotubes. The number of nuclei in each myotube was counted and analysed. Five hundred myotubes were counted in each sample. (G) Expression levels of Msi2 and MyHC in MuSCs described in (D). RT‐qPCR assays were performed with RNA extracted from differentiated MuSCs. Error bars indicated standard deviation and were based on three independent experiments. ** indicated P < 0.01. (H) Immunoblotting of Msi2 in MuSCs before and after differentiation. MuSCs were infected with adenovirus encoding Myc‐tagged Msi2 or vector. The whole cell protein extracts from the undifferentiated MuSCs or differentiated myotubes were subjected for immunoblotting assays using antibodies against Msi2, MyHC, Myc and GAPDH. GAPDH served as an internal control. The numbers below each panel indicated relative signal intensity. (I) Immunofluorescent staining of MyHC in myotubes overexpressing Msi2. MuSCs were infected with adenovirus encoding Msi2 followed by differentiation. Red indicated MyHC; blue indicated DAPI staining of nuclei; merge indicated the merged images of red and blue. Scale bars: 100 μm. (J) Statistical analysis of the average length of myotubes. Error bars indicated standard deviation calculated based on four independent experiments and ** indicated P < 0.01. (K) Statistical analysis of the fusion index of myotubes. The number of nuclei in each myotube was counted and analysed. Five hundred myotubes were counted in each sample. Expression levels of Msi2 and MyHC in MuSCs described in (I). (L) RT‐qPCR assays were performed with RNA extracted from differentiated myotubes. Error bars indicated standard deviation and were based on three independent experiments. ** indicated P < 0.01. Msi2, Musashi 2; MuSCs, muscle stem cells; MyHC, Myosin heavy chain; RT‐qPCR, quantitative reverse transcription PCR.
Figure 2
Figure 2
Msi2 and HuR inhibited the biogenesis of MiR7a‐1. (A) Coomassie blue staining of Msi2 immunoprecipitation. C2C12 cells were infected by adenovirus encoding Myc‐tagged Msi2 and differentiated. Whole cell protein extracts from differentiated myotubes were subjected for immunoprecipitation using anti‐Myc antibody. The immunoprecipitated proteins were subjected for SDS‐PAGE analysis followed by Coomassie staining, and each band was identified by mass spectrometry. The protein names were labelled according to mass spectrometry results. (B) Immunoprecipitation followed by immunoblotting to confirm the protein–protein interaction between Msi2 and HuR. MuSCs were infected by adenovirus encoding Flag‐tagged Msi2. Whole cell protein extracts from the infected cells were subjected to anti‐Flag immunoprecipitation followed by HuR immunoblotting. IgG immunoprecipitation serves as the control. (C) Immunoprecipitation followed by immunoblotting to confirm the protein–protein interaction between Msi2 and HuR. MuSCs were infected by adenovirus encoding Flag‐tagged HuR. Whole cell protein extracts from the infected cells were subjected to anti‐Flag immunoprecipitation followed by Msi2 immunoblotting. IgG immunoprecipitation serves as the control. (D) Subcellular distribution of Msi2 and HuR. Undifferentiated and differentiated MuSCs were harvested, and nuclear and cytoplasmic proteins were fractionated, respectively. Immunoblottings of Msi2, HuR, UAP56 and GAPDH were performed. UAP56 was localized in nuclei and served as a control for proper isolation of nuclei. GAPDH was a cytoplasmic localized protein and served as a control for the proper isolation of cytoplasm. (E) RIP PCR analysis using Msi2 or HuR antibody. RIP PCR assays were performed using MuSCs ectopically expressing Myc‐tagged Msi2 and Flag‐tagged HuR. Error bars indicated standard deviation and were based on three independent experiments. * indicated P < 0.05. ** indicated P < 0.01. ns indicated no significant changes. (F) RIP PCR analysis using anti‐Msi2. MuSCs and differentiated myotubes were harvested for RIP assays. Pri‐MiR7a‐1 and pri‐MiR128 were detected by RT‐qPCR. Pri‐MiR128 was an irrelative MiRNA serving as a negative control. Error bars indicated standard deviation and were based on three independent experiments. ** indicated P < 0.01. ns indicated no significant changes. (G) RIP PCR analysis using anti‐HuR. MuSCs and differentiated myotubes were harvested for RIP assays. Pri‐MiR7a‐1 and pri‐MiR128 were detected by RT‐qPCR. Pri‐MiR128 was an irrelative MiRNA serving as a negative control. Error bars indicated standard deviation and were based on three independent experiments. ** indicated P < 0.01. ns indicated no significant changes. (H) The expression level of pri‐MiR7a‐1 and mature MiR7a‐1 in WT and Msi2 knockout muscle cells. MuSCs were isolated from WT and Msi2 knockout mice followed by differentiation. RT‐qPCR assays were performed using total RNAs extracted from the differentiated cells. Error bars indicated standard deviation and were based on three independent experiments. * indicated P < 0.05. ** indicated P < 0.01. (I) The expression levels of pri‐MiR7a‐1, mature MiR7a‐1 and HuR in differentiated MuSCs treated with shRNA against HuR. MuSCs were infected by adenovirus encoding shRNA against HuR and differentiated for 3 days. Two pieces of shRNAs were used. The expression levels of pri‐MiR7a‐1, MiR7a‐1 and HuR were detected by RT‐qPCR. Error bars indicated standard deviation and were based on three independent experiments. * indicated P < 0.05. ** indicated P < 0.01. (J) The expression levels of Hnrnpk, pri‐MiR7a‐1 and mature MiR7a‐1 in MuSCs ectopically expressing Myc‐tagged Msi2. RT‐qPCR assays were performed to detect the expression levels of MiR7a‐1 host gene Hnrnpk, pri‐MiR7a‐1 and mature MiR7a‐1. ShRNA against HuR was further introduced to MuSCs overexpressing Msi2. The expression levels of pri‐MiR7a‐1 and mature MiR7a‐1 were examined by RT‐qPCR assays. Error bars indicated standard deviation and were based on three independent experiments. * indicated P < 0.05. ** indicated P < 0.01. ns indicated no significant changes. (K) The protein levels of Msi2 and HuR in MuSCs ectopically expressing Myc‐tagged Msi2. Immunoblottings were performed to detect the protein level of Msi2 and HuR. ShRNA against HuR was further introduced to MuSCs overexpressing Msi2. The protein levels of Msi2 and HuR were detected by immunoblotting. GAPDH served as the internal control. (L) The protein levels of Msi2 and HuR in MuSCs overexpressing Msi2. MuSCs were infected by increasing amounts of adenovirus encoding Myc‐tagged Msi2 and the same amount of Flag‐tagged HuR. Whole cell extracts proteins were subjected for immunoblotting with anti‐Msi2, anti‐HuR and anti‐GAPDH antibodies. GAPDH served as an internal control. (M) The relative level of mature MiR7a‐1. MuSCs were infected by increasing amounts of adenovirus encoding Myc‐tagged Msi2 and the same amount of Flag‐tagged HuR. The level of mature MiR7a‐1 was examined by RT‐qPCR. Error bars indicated standard deviation and were based on three independent experiments. *** indicated P < 0.001. ns indicated no significant changes. HuR, human antigen R; Msi2, Musashi 2; MuSCs, muscle stem cells; RT‐qPCR, quantitative reverse transcription PCR; RIP, RNA immunoprecipitation; WT, wild type.
Figure 3
Figure 3
Msi2 and HuR bind the consensus HuR recognition site at the flanking region of pri‐MiR7a‐1. (A) The sequence of Hnrnpk minigene. Red indicted the predicted Msi2 recognition sites. Blue indicated the predicted HuR recognition sites. Green box indicated the sequence of pre‐MiR7a‐1. (B) The scheme of the Mir7a‐1 minigene with intact or mutated potential Msi2 recognition sites. The predicted Msi2 recognition sites and the mutated sequences were listed below the schematic graph. Red indicated the predicted Msi2 recognition sites. (C) The expression level of mature MiR7a‐1 with intact Msi2 recognition sites or mutated Msi2 recognition sites. Msi2 and Mir7a‐1 minigene containing WT or mutated Msi2 recognition sites were co‐transfected to MuSCs. RT‐qPCR assays were performed to determine the level of mature MiR7a‐1. Error bars indicated standard deviation and were based on three independent experiments. ** indicated P < 0.01. ns indicated no significant changes. (D) The scheme of the Mir7a‐1 minigene with intact or mutated potential HuR recognition sites. The predicted HuR recognition sites and the mutated sequences were listed below the schematic graph. Blue indicated the predicted Msi2 recognition sites. Green indicated the sequence of mature MiR7a‐1. (E) The expression level of mature MiR7a‐1 with intact or mutated HuR recognition sites. HuR and Mir7a‐1 minigene containing WT or mutated HuR recognition sites were co‐transfected to MuSCs. RT‐qPCR assays were performed to determine the level of mature MiR7a‐1. Msi2, HuR and Mir7a‐1 minigene containing WT or mutated HuR recognition sites were co‐transfected to MuSCs. Error bars indicated standard deviation and were based on 3 independent experiments. ** indicated P < 0.01. ns indicated no significant changes. (F) Vector, Mir7a‐1 minigene or mutated Mir7a‐1 minigene were transfected to primary MuSCs, respectively. RIP PCR assays with anti‐HuR antibody were performed. * indicated P < 0.05. *** indicated P < 0.001. (G) HuR and Msi2 RNA EMSA assays. Synthesized RNA probe containing potential HuR‐binding site was labelled by Cy3. Recombinant Msi2 and HuR purified from HEK293T cells were utilized for electrophoretic mobility shift assay EMSA assays. WT Flanking indicated RNA probe containing the potential HuR recognition site at the flanking region of pri‐MiR7a‐1. HuR, human antigen R; Msi2, Musashi 2; MuSCs, muscle stem cells; RT‐qPCR, quantitative reverse transcription PCR; RIP, RNA immunoprecipitation; WT, wild type.
Figure 4
Figure 4
Msi2 and HuR up‐regulate Cry2 via MiR7a‐1 to promote myogenesis. (A) Immunofluorescent staining of MyHC in MuSCs overexpressing MiR7a‐1. MuSCs were infected by adenovirus encoding MiR7a‐1 and differentiated. The differentiated MuSCs were stained with anti‐MyHC. Red indicated MyHC; DAPI indicated nuclear staining; merge indicated the merged images of red and blue. Scale bars: 100 μm. (B) Statistics of the average length of myotubes overexpressing MiR7a‐1. Error bars indicated standard deviation and were based on three independent experiments. ** indicated P < 0.01. (C) The expression level of MyoG, MCK and MyHC in differentiated MuSCs overexpressing MiR7a‐1. RT‐qPCR assays were performed with RNA extracted from differentiated MuSCs. Error bars indicated standard deviation and were based on three independent experiments. * indicated P < 0.05. ** indicated P < 0.01. (D) Immunofluorescent staining of MyHC in MuSCs expressing MiR7a‐1 antagomir. MuSCs were infected by MiR7a‐1 antagomir and differentiated. The differentiated MuSCs were stained with anti‐MyHC. Red indicated MyHC; DAPI indicated nuclear staining; merge indicated the merged images of red and blue. Scale bars: 100 μm. (E) Statistical analysis of the fusion index of myotubes. The number of nuclei in each myotube was counted and analysed. Five hundred myotubes were counted in each sample. (F) The expression level of MyoG, MCK and MyHC in differentiated MuSCs expressing MiR7a‐1 antagomir. RT‐qPCR assays were performed with RNA extracted from differentiated MuSCs. Error bars indicated standard deviation and were based on three independent experiments. * indicated P < 0.05. ** indicated P < 0.01. (G) Scheme of luciferase assay construct for Cry2 3′ UTR. The sequences of MiR7a‐1 complementary to the 3′ UTR of the target gene are in red colour; the mutated sequences are in green colour. (H) The luciferase activity of reporter gene carrying MiR7a‐1 target sequence from Cry2 at the 3′ UTR region. Firefly luciferase activity regulated by MiR7a‐1 target sequence at the 3′ UTR. Renilla luciferase activity driven by CMV promoter served as an internal control. Error bars indicated standard deviation and were based on five independent experiments. ** indicated P < 0.01. ns indicated no significant changes. (I) Protein levels of Cry2 after MiR7a‐1 or MiR7a‐1 antagomir overexpression. MuSCs transfected with MiR7a‐1 or MiR7a‐1 antagomir were harvested, and the whole cell protein extracts were subjected foranti‐Cry 2 immunoblotting. GAPDH served as an internal control. Numbers under each lane indicated signal intensity. (J) The protein levels of Cry2 in Msi2 RNAi MuSCs. MuSCs were infected by adenovirus encoding shRNAs against Msi2 or scramble RNA and differentiated for 3 days. Two pieces of shRNAs were used. Whole cell protein extracts were subjected for immunoblottings using anti‐Msi2 and Cry2. GAPDH served as an internal control. The numbers below each lane indicated the signal intensity. (K) The protein levels of Cry2 in Msi2 overexpressing MuSCs. MuSCs were infected by adenovirus encoding Msi2. Whole cell protein extracts were subjected for immunoblottings using anti‐Msi2 and Cry2. GAPDH served as an internal control. The numbers below each lane indicated the signal intensity. (L) Immunofluorescent staining of MyHC. MuSCs were infected by adenovirus encoding Msi2 first; virus encoding MiR7a‐1 was utilized to further infect the Msi2 overexpressing cells. The MuSCs expressing ectopic Msi2, MiR7a‐1 or both were differentiated for 48 h. The differentiated cells were subjected for immunofluorescent staining with MyHC antibody. Red indicated MyHC; blue indicated DAPI; merge indicated the merge of red and blue images. Scale bars: 100 μm. (M) Expression levels of MCK and MyHC. RT‐qPCR assays were performed to examine the expression levels of differentiation markers. Error bars indicated standard deviation and were based on three independent experiments. ** indicated P < 0.01. ns indicated no significant changes. (N) Scheme of Msi2 and HuR driven post‐transcriptional regulatory cascade. HuR, human antigen R; Msi2, Musashi 2; MuSCs, muscle stem cells; RT‐qPCR, quantitative reverse transcription PCR.
Figure 5
Figure 5
The decline of Msi2 level attributes to ageing‐induced muscle regeneration defects. (A) Immunofluorescence staining of Laminin and DAPI on cryosections derived from WT or Msi2 KO mice (3 months) mice on Days 7 and 14 after injury. Green indicated Laminin; blue indicated DAPI staining of nuclei; scale bars: 100 μm. (B) Statistical analysis of the distribution of myofibre size on Day 14 after injury. (C) HE staining of muscle cryosections from mice overexpressing MiR7a‐1. Adenovirus encoding MiR7a‐1 or MLP vector were injected to TA muscle intramuscularly once a day for 5 days. On the first day of injection, CTX was also injected. TA muscles were harvested 7 days after CTX injection. HE staining was performed with cryosections derived from TA muscles. Scale bars: 50 μm. (D) Statistical analysis of the myofibres containing centrally located nuclei. One thousand fields were counted for each mouse. Error bars indicated standard deviation and were based on five independent experiments. ** indicated P < 0.01. (E) RNA levels of mature MiR7a‐1, Msi2, HuR and Cry2 in differentiated muscle cells from young and old mice, respectively. Primary MuSCs were isolated from young (3 months) or old (24 months) TA muscles. RT‐qPCR was performed with total RNAs extracted from the differentiated cells. The results were normalized to GAPDH. Error bars indicated standard deviation and were based on three independent experiments. * indicated P < 0.05. ** indicated P < 0.01. ns indicated no significant changes. (F) Protein levels of Msi2, HuR and Cry2 in differentiated MuSCs isolated from young and old mice, respectively. Primary MuSCs were isolated from young (3 months) or old (24 months) TA muscles. Immunoblotting assays were performed with whole cell protein extracts from the differentiated cells. The numbers under each lane indicated the signal intensity. (G) Immunofluorescent staining of MyHC. MuSCs were isolated from young or old mice and differentiated for 3 days. The differentiated cells were stained with anti‐MyHC antibody. Green indicated MyHC; blue indicated DAPI staining for nuclei; merge indicated the merge of blue and green images. Scale bars: 100 μm. (H) Statistical analysis of the fusion index. HuR, human antigen R; KO, knockout; Msi2, Musashi 2; MuSCs, muscle stem cells; RT‐qCPT, quantitative reverse transcription PCR; WT, wild type.

Similar articles

Cited by

References

    1. Wosczyna MN, Rando TA. A muscle stem cell support group: coordinated cellular responses in muscle regeneration. Dev Cell 2018;46:135–143. - PMC - PubMed
    1. Bentzinger CF, Wang YX, Rudnicki MA. Building muscle: molecular regulation of myogenesis. Cold Spring Harb Perspect Biol 2012;4:a008342. - PMC - PubMed
    1. Baghdadi MB, Tajbakhsh S. Regulation and phylogeny of skeletal muscle regeneration. Dev Biol 2018;433:200–209. - PubMed
    1. Zammit PS. Function of the myogenic regulatory factors Myf5, MyoD, Myogenin and MRF4 in skeletal muscle, satellite cells and regenerative myogenesis. Semin Cell Dev Biol 2017;72:19–32. - PubMed
    1. Asfour HA, Allouh MZ, Said RS. Myogenic regulatory factors: the orchestrators of myogenesis after 30 years of discovery. Exp Biol Med (Maywood) 2018;243:118–128. - PMC - PubMed

Publication types