. 2021 Dec 8;6(23):e146757.
doi: 10.1172/jci.insight.146757.

Increased long noncoding RNA LINK-A contributes to rheumatoid synovial inflammation and aggression

Affiliations

Increased long noncoding RNA LINK-A contributes to rheumatoid synovial inflammation and aggression

Jingnan Wang et al. JCI Insight. .

Abstract

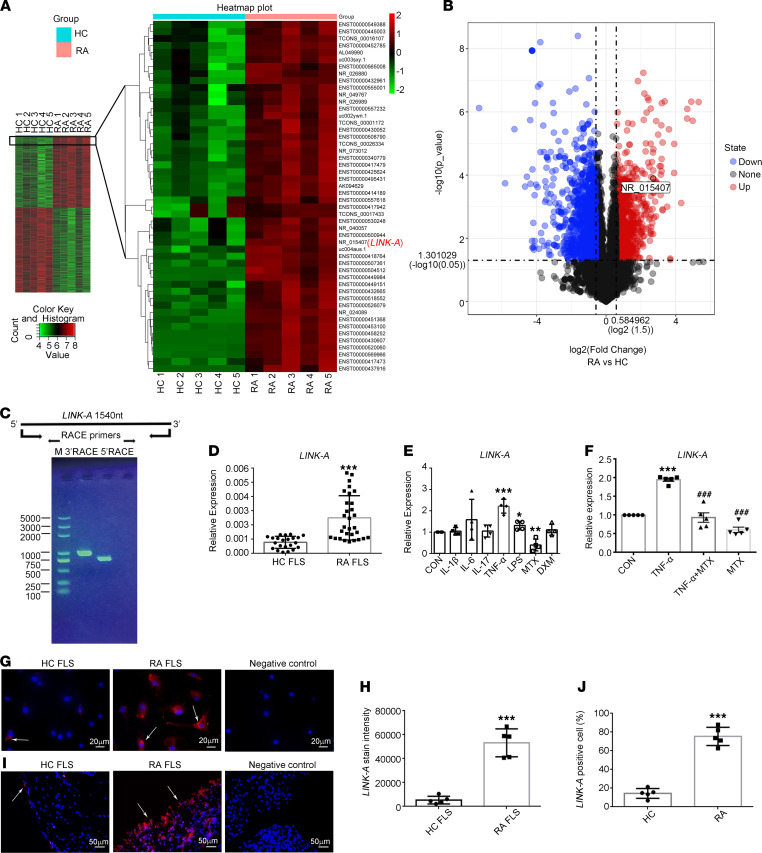
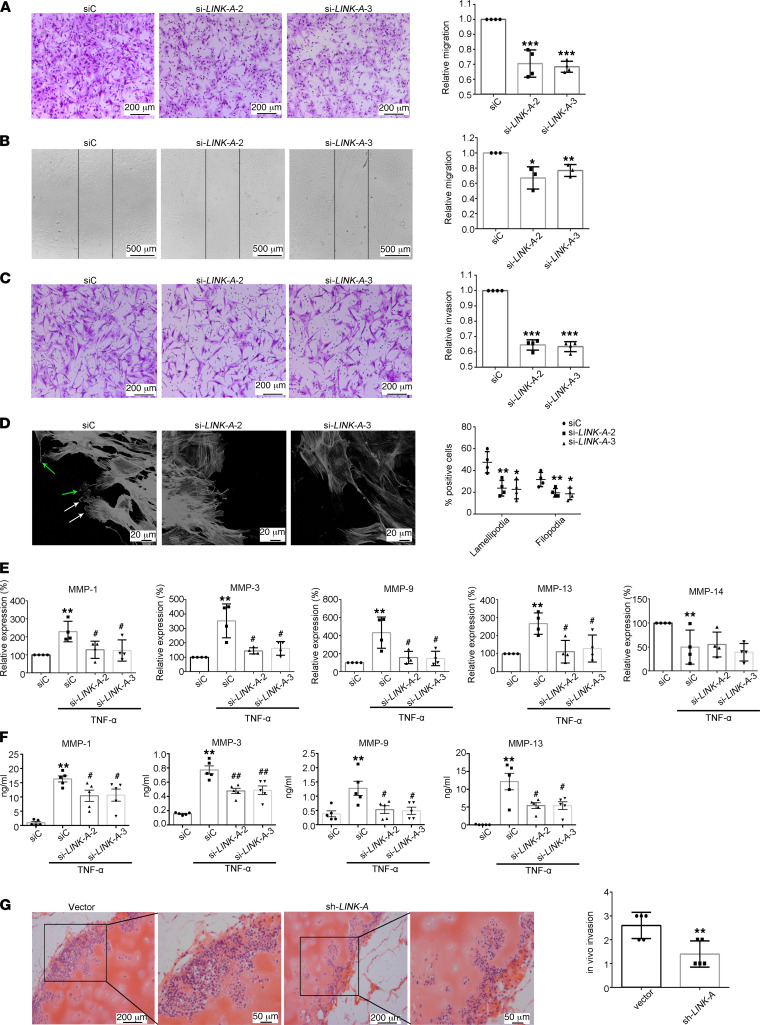
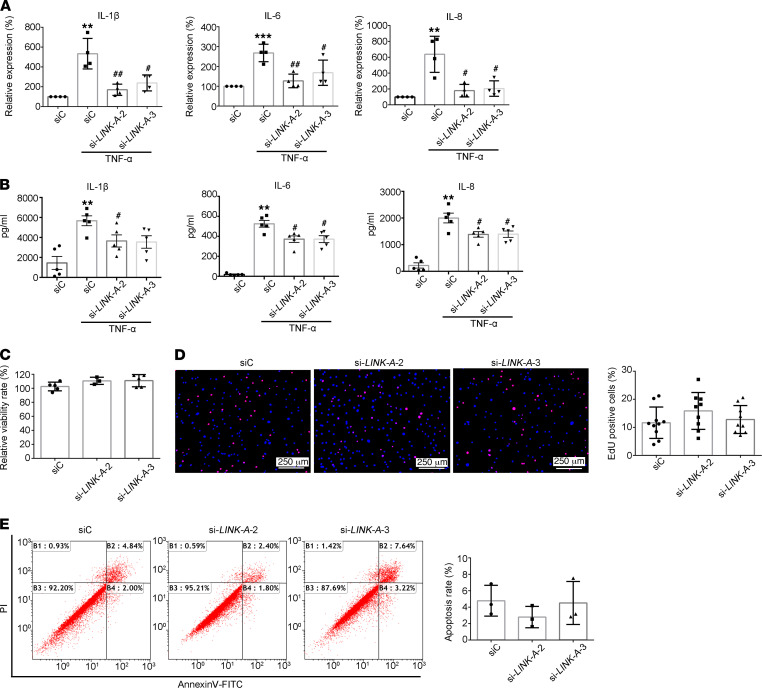
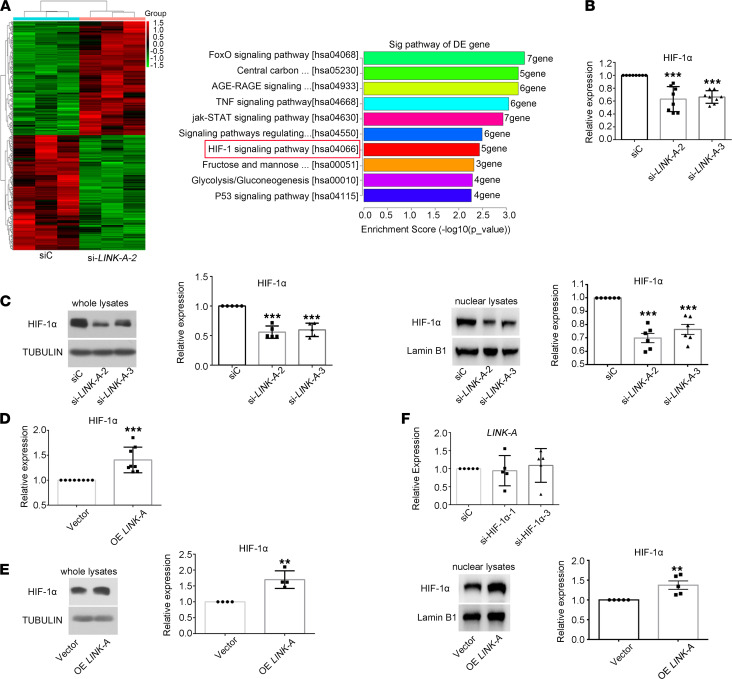
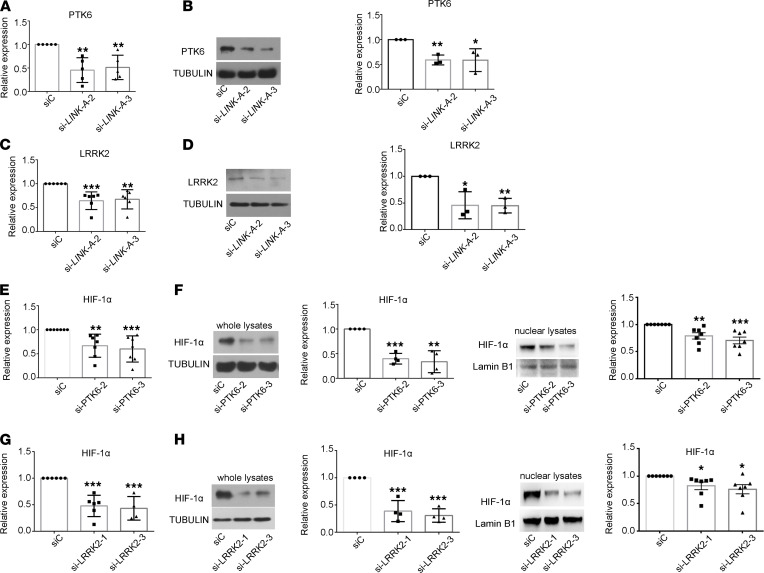
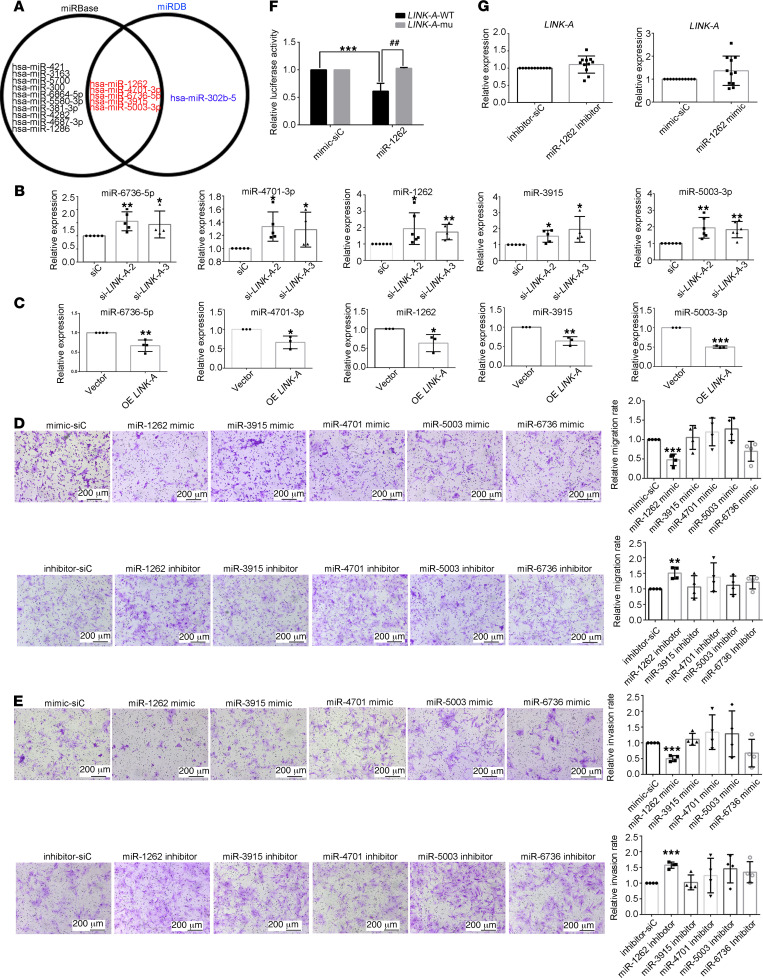
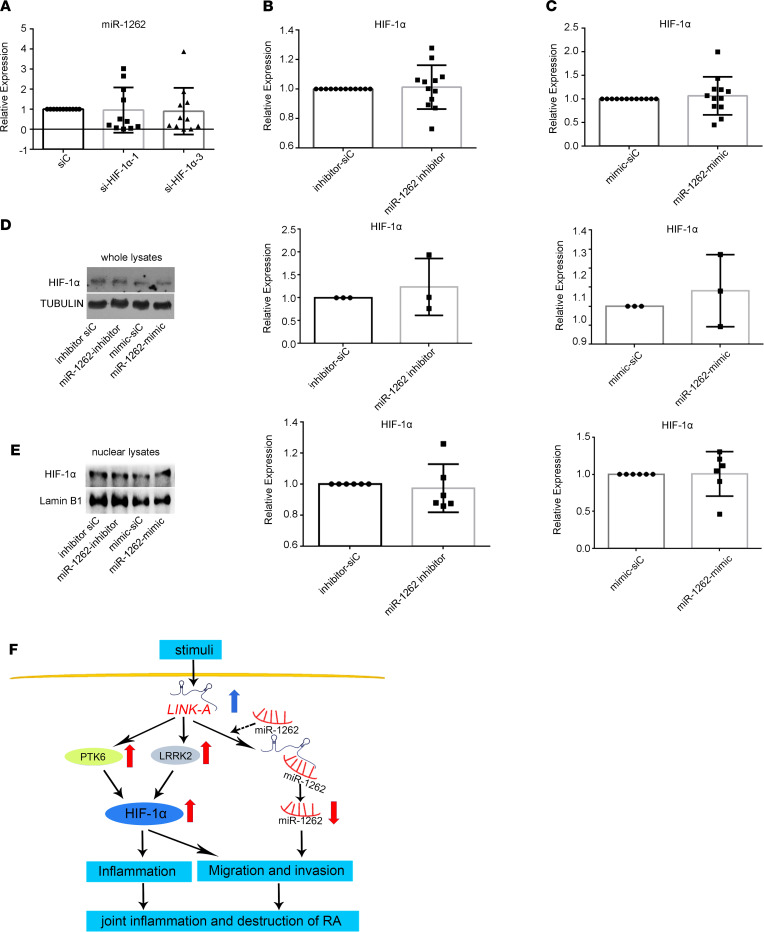
Fibroblast-like synoviocytes (FLSs) play a key role in controlling synovial inflammation and joint destruction in rheumatoid arthritis (RA). The contribution of long noncoding RNAs (lncRNAs) to RA is largely unknown. Here, we show that the lncRNA LINK-A, located mainly in cytoplasm, has higher-than-normal expression in synovial tissues and FLSs from patients with RA. Synovial LINK-A expression was positively correlated with the severity of synovitis in patients with RA. LINK-A knockdown decreased migration, invasion, and expression and secretion of matrix metalloproteinases and proinflammatory cytokines in RA FLSs. Mechanistically, LINK-A controlled RA FLS inflammation and invasion through regulation of tyrosine protein kinase 6-mediated and leucine-rich repeat kinase 2-mediated HIF-1α. On the other hand, we also demonstrate that LINK-A could bind with microRNA 1262 as a sponge to control RA FLS aggression but not inflammation. Our findings suggest that increased level of LINK-A may contribute to FLS-mediated rheumatoid synovial inflammation and aggression. LINK-A might be a potential therapeutic target for RA.

Keywords: Immunology; Noncoding RNAs; Rheumatology.


Figures

Figure 1
Figure 1. Increased levels of lncRNA LINK-A in FLSs and synovial tissues from patients with RA.
(A) Total RNA harvested from RA FLSs (n = 5) and HC FLSs (n = 5) was screened by microarray analysis. Microarray heatmap of distinguishable expression profiles of lncRNAs. (B) Volcano plot shows differentially expressed lncRNAs between RA FLSs and HC FLSs. P < 0.05, by Student’s t test. (C) RACE assay of LINK-A. The image shows amplification products of 5′ and 3′ ends of LINK-A. M, marker. (D) Verification of LINK-A by RT-qPCR in HC FLSs and RA FLSs. Ct values were normalized to GAPDH. Data are presented as the mean ± SD. (E) Expression of LINK-A in RA FLSs treated with IL-1β (10 ng/mL), TNF-α (10 ng/mL), IL-6 (10 ng/mL), IL-17 (10 ng/mL), LPS (10 ng/mL), methotrexate (MTX, 10 μg), and dexamethasone (DXM, 1 μg) for 24 hours. (F) Effect of MTX (10 μg) on TNF-α–induced LINK-A expression. (G and H) Cellular localization of LINK-A was measured by RNA FISH assay. Shown are representative images of LINK-A (red) and nuclei (blue) from 5 different RA patients and HCs. Graph (H) shows the quantification of staining intensity for 5 different RA patients and HCs. Original magnification, ×400. (I and J) LINK-A expression, evaluated by ISH staining, in synovial tissues from HCs and RA patients. Shown are representative images (I) and quantification of the percentage of LINK-A–positive cells (J) from 5 different RA patients and HCs. A scrambled probe was used as a negative control. White arrows indicate LINK-A–positive (red) cells. Original magnification, ×630. *P < 0.05, **P < 0.01, ***P < 0.001 versus HC FLSs or control (CON); ###P < 0.001 versus TNF-α, by Student’s 2-tailed t test or 1-way ANOVA (for E and F).
Figure 2
Figure 2. Effects of lncRNA LINK-A knockdown on migration and invasion of RA FLSs.
RA FLSs were transfected with LINK-A siRNA (si-LINK-A-2 or si-LINK-A-3) or control siRNA (siC) or LINK-A shRNA (sh-LINK-A) or vector control. (A) Chemotaxic migration was measured using a Transwell assay. Representative images (original magnification, ×100) are shown. Graphs show the relative migration rates. (B) The cell migration was evaluated using a wound-healing assay. Representative images are shown (original magnification, ×50). The relative migration rate represents the number of migrated cells normalized to the siC. (C) In vitro invasion was evaluated using inserts coated with Matrigel Basement Membrane Matrix (BD Biosciences). Representative images (original magnification, ×100) are shown. Graphs show the relative invasion rates. (D) Effect of LINK-A knockdown on the pseudopodium formation in RA FLSs. RA FLSs were wounded and then incubated with TNF-α (10 ng/mL) for 4 hours. Representative images are shown (original magnification, ×400). White arrows indicate lamellipodia formation; green arrows indicate filopodia formation. Graph shows the number of RA FLSs with positive lamellipodia or filopodia. (E and F) Effect of LINK-A knockdown on expression (E) and secretion (F) of MMPs. MMP expression or secretion was measured by RT-qPCR or ELISA. Data are presented as the mean ± SD. (G) Effect of LINK-A shRNA on RA FLS invasion into human cartilage implants transferred under the skin of SCID mice. Arrows show RA FLSs invaded into cartilage. Original magnification, ×200 (left); ×400 right (enlarged). Graph shows the invasion scores. Data are shown as the mean ± SD of 5 independent experiments involving 5 different RA patients. *P < 0.05, **P < 0.01, and ***P < 0.001 versus siC or vector control; #P < 0.05 versus TNF-α + siC, by Student’s 2-tailed t test (G) or 1-way ANOVA (AF).
Figure 3
Figure 3. Effects of lncRNA LINK-A knockdown on proinflammatory cytokines, proliferation, and apoptosis of RA FLSs.
RA FLSs were transfected with LINK-A siRNA (si-LINK-A-2 or si-LINK-A-3) or control siRNA (siC). (A) Effect of LINK-A knockdown on the expression of IL-1β, IL-6, and IL-8. Cytokine expression was detected using RT-qPCR assay. Ct values were normalized to β-actin values. Data are presented as the mean ± SD. (B) Effect of LINK-A knockdown on the secretion of IL-1β, IL-6, and IL-8. Cytokine levels were measured using ELISA. Data are presented as the mean ± SD. (C and D) Effect of LINK-A knockdown on proliferation of RA FLSs. CCK-8 (C) or EdU incorporation assay (D) was used to evaluate the growth or proliferation. Representative images show proliferation of RA FLSs labeled with EdU (red) and nuclei stained with Hoechst 33342 (blue) (original magnification, ×100). Graphs indicate the mean ± SD of more than 5 independent experiments involving different RA patients. (E) Effect of LINK-A knockdown on apoptosis of RA FLSs. The cellular apoptosis rate was evaluated by annexin V and propidium iodide (PI) staining and measured by flow cytometry. Representative flow plots are shown. The apoptosis graph represents the mean ± SD percentage of 3 independent experiments involving different RA patients. *P < 0.05 versus siC, **P < 0.01, and ***P < 0.001 versus siC; #P < 0.05, ##P < 0.01 versus TNF-α + siC, by 1-way ANOVA.
Figure 4
Figure 4. LINK-A functions through HIF-1α in RA FLSs.
RA FLSs were transfected with LINK-A siRNA (si-LINK-A-2 or si-LINK-A-3) or HIF-1α siRNA (si-HIF-1α-1 or si-HIF-1α-3) or control siRNA (siC) or were infected with LINK-A–overexpressed lentiviruses (OE LINK-A) or control vector (Vector). The mRNA and protein levels were measured using RT-qPCR and Western blot, respectively. (A) Heatmap of distinguishable expression profiles of mRNAs (upper panel) and the KEGG pathway analysis for RNA-Seq (right panel). The bar chart shows the top 10 mRNAs from Kyoto Encyclopedia of Genes and Genomes (KEGG) pathway enrichment analysis. (B) Effect of LINK-A knockdown with siRNA on the expression of the mRNA of HIF-1α. (C) Effect of LINK-A knockdown on the expression of total and nuclear protein of HIF-1α. (D) Effect of LINK-A overexpression on the expression of the mRNA HIF-1α. (E) Effect of LINK-A overexpression on the expression of total and nuclear protein of HIF-1α. (F) Effect of HIF-1α knockdown on the expression of LINK-A. Data (C and E, lower or right panel) are expressed as the mean ± SD of densitometry quantification of Western blot from at least 3 independent experiments. **P < 0.01, and ***P < 0.001 versus siC or vector control, by Student’s 2-tailed t test (D and E) or 1-way ANOVA (B and C).
Figure 5
Figure 5. PTK6 and LRRK2 mediate the role of LINK-A in regulating HIF-1α in RA FLSs.
RA FLSs were transfected with LINK-A siRNA (si-LINK-A-2 or si-LINK-A-3) or PTK6 siRNA (si-PTK6-2 or si-PTK6-3) or LRRK2 siRNA (si-LRRK2-1 or si-LRRK2-3) or control siRNA (siC). The mRNA and protein levels were measured using RT-qPCR and Western blot, respectively. (A and B) Effect of LINK-A knockdown with siRNA on the expression of the mRNA (A) and protein (B) of PTK6. (C and D) Effect of LINK-A knockdown on the expression of the mRNA (C) and protein (D) of LRRK2. (E and F) Effect of PTK6 knockdown with siRNA on the expression of the mRNA (E) and protein (F) of HIF-1α. (G and H) Effect of LRRK2 knockdown with siRNA on the expression of the mRNA (G) and protein (H) of HIF-1α. Data (B, D, F, and H, lower or right panel) are expressed as the mean ± SD of densitometry quantification of Western blot from at least 3 independent experiments. *P < 0.05, **P < 0.01, and ***P < 0.001 versus siC, by 1-way ANOVA.
Figure 6
Figure 6. Screening and validation of miRNAs regulated by LINK-A in RA FLSs.
RA FLSs were transfected with LINK-A siRNA (si-LINK-A-2 or si-LINK-A-3) or control siRNA (siC) or were infected with LINK-A–overexpressed lentiviruses (OE LINK-A) or control vector (Vector) or treated with miRNA inhibitors or mimics. (A) miRBase and miRDB were used to predict miRNAs that can bind to LINK-A. A total of 5 miRNAs, common to both databases, can bind to LINK-A. (B and C) Effect of LINK-A knockdown (B) or overexpression (C) on the expression of miRNAs. The miRNAs were detected using RT-qPCR. (D and E) Effects of miRNA mimics or inhibitors on migration (D) and invasion (E) of RA FLSs. Migration of RA FLSs was evaluated using a Transwell assay. Invasion was evaluated using inserts coated with Matrigel Basement Membrane Matrix. Representative images (original magnification, ×100) are shown. Graphs show the relative migration or invasion rates. (F) Luciferase reporter assay was conducted to verify the targeting effect of miR-1262 on LINK-A sequence. (G) Effect of miR-1262 inhibition or mimics on LINK-A expression. Data are presented as the mean ± SD from at least 3 independent experiments. *P < 0.05, **P < 0.01, ***P < 0.001; ##P < 0.01 versus siC or vector or normal control (NC), by Student’s 2-tailed t test (C and G) or 1-way ANOVA (B, D, E, and F).
Figure 7
Figure 7. The relationship between miR-1262 and HIF-1α in RA FLSs.
RA FLSs were treated with miRNA inhibitors or mimics or transfected with HIF-1α siRNA (si-HIF-1α-1 or si-HIF-1α-3). The miRNAs and mRNA were detected using RT-qPCR. The protein levels were measured by Western blot. (A) Effect of HIF-1α knockdown on the expression of miR-1262. (B and C) Effect of miR-1262 inhibitor (B) or mimics (C) on mRNA expression of HIF-1α. (D) Effect of miR-1262 inhibitor or mimics on protein expression of total HIF-1α. (E) Effect of miR-1262 inhibitor or mimics on protein expression of nuclear HIF-1α. Data (AC) are presented as the mean ± SD from at least 3 independent experiments. Graphs (D and E, right panel) are expressed as the mean ± SD of densitometry quantification of Western blot results from at least 3 independent experiments. (F) Proposed model for LINK-A–mediated regulation of the synovial migration, invasion, and inflammation in RA FLSs.

References

    1. Smolen JS, et al. Rheumatoid arthritis. Lancet. 2016;388(10055):2023–2038. doi: 10.1016/S0140-6736(16)30173-8. - DOI - PubMed
    1. Ganesan R, Rasool M. Fibroblast-like synoviocytes-dependent effector molecules as a critical mediator for rheumatoid arthritis: current status and future directions. Int Rev Immunol. 2017;36(1):20–30. doi: 10.1080/08830185.2016.1269175. - DOI - PubMed
    1. Korb-Pap A, et al. Stable activation of fibroblasts in rheumatic arthritis-causes and consequences. Rheumatology (Oxford) 2016;55(suppl 2):ii64–ii67. doi: 10.1093/rheumatology/kew347. - DOI - PubMed
    1. Nygaard G, Firestein GS. Restoring synovial homeostasis in rheumatoid arthritis by targeting fibroblast-like synoviocytes. Nat Rev Rheumatol. 2020;16(6):316–333. doi: 10.1038/s41584-020-0413-5. - DOI - PMC - PubMed
    1. Bottini N, Firestein GS. Duality of fibroblast-like synoviocytes in RA: passive responders and imprinted aggressors. Nat Rev Rheumatol. 2013;9(1):24–33. doi: 10.1038/nrrheum.2012.190. - DOI - PMC - PubMed

Publication types

Substances