. 2021 Dec 6:76:e3548.
doi: 10.6061/clinics/2021/e3548. eCollection 2021.

SARS-CoV-2 recombinant proteins stimulate distinct cellular and humoral immune response profiles in samples from COVID-19 convalescent patients

Affiliations

SARS-CoV-2 recombinant proteins stimulate distinct cellular and humoral immune response profiles in samples from COVID-19 convalescent patients

Laís Teodoro da Silva et al. Clinics (Sao Paulo). .

Abstract

Objectives: In this preliminary study we investigated cellular and humoral immune responses to severe acute respiratory syndrome coronavirus 2 (SARS-CoV-2) antigens in blood samples from 14 recovered coronavirus disease 2019 (COVID-19) patients and compared them to those in samples from 12 uninfected/unvaccinated volunteers.

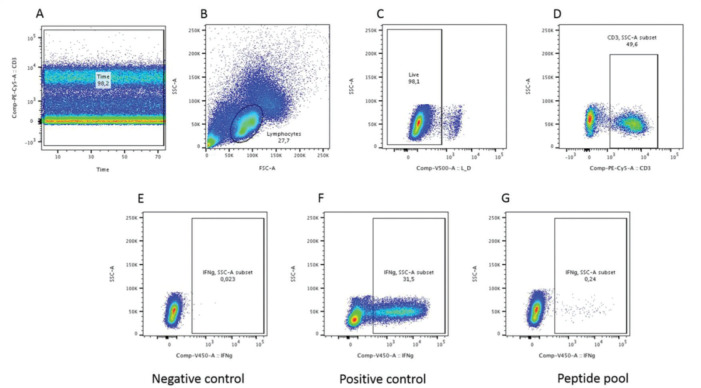
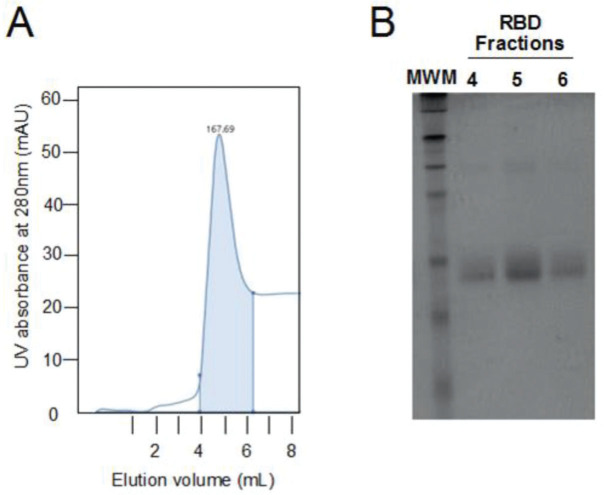
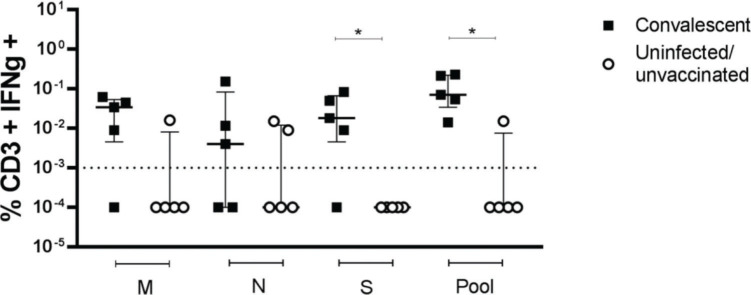
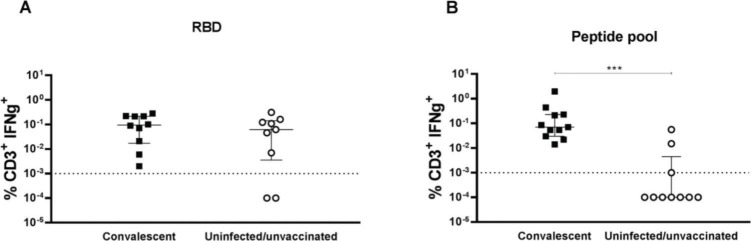
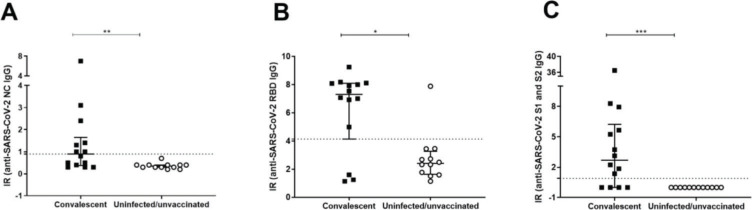
Methods: Cellular immunity was assessed by intracellular detection of IFN-γ in CD3+ T lymphocytes after stimulation with SARS-CoV-2 spike (S1), nucleocapsid (NC), or receptor-binding domain (RBD) recombinant proteins or overlapping peptide pools covering the sequence of SARS-CoV-2 spike, membrane and nucleocapsid regions. The humoral response was examined by ELISAs and/or chemiluminescence assays for the presence of serum IgG antibodies directed to SARS-CoV-2 proteins.

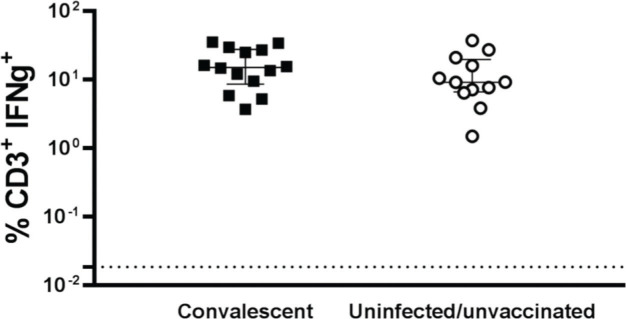
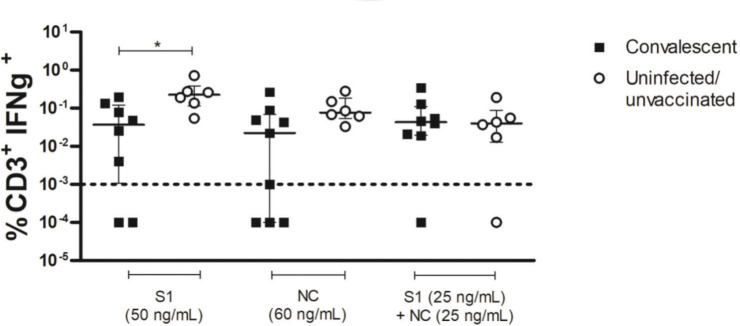
Results: We observed differences between humoral and cellular immune profiles in response to stimulation with the same proteins. Assays of IgG antibodies directed to SARS-CoV-2 NC, RBD and S1/S2 recombinant proteins were able to differentiate convalescent from uninfected/unvaccinated groups. Cellular immune responses to SARS-CoV-2 protein stimuli did not exhibit a specific response, as T cells from both individuals with no history of contact with SARS-CoV-2 and from recovered donors were able to produce IFN-γ.

Conclusions: Determination of the cellular immune response to stimulation with a pool of SARS-CoV-2 peptides but not with SARS-CoV-2 proteins is able to distinguish convalescent individuals from unexposed individuals. Regarding the humoral immune response, the screening for serum IgG antibodies directed to SARS-CoV-2 proteins has been shown to be specific for the response of recovered individuals.


Conflict of interest statement

No potential conflict of interest was reported.

Figures

Figure S1
Figure S1. Representative flow cytometry plots of IFN-γ expression by CD3+ T cells from one convalescent COVID-19 individual. (A) The PE-Cy5 x time analysis strategy was employed to exclude possible unstable cell flow, after which size and granularity patterns of cells were analyzed by FSC and SSC (B) and therefore within the live cell population (C). CD3+ T cells were analyzed (D) for IFN-γ production in the negative control (without stimulation) (E) or following stimulation with phorbol myristate acetate and ionomycin (positive control) (F) or SARS-CoV-2 peptide pools (G). Samples were acquired on an LSR Fortessa (BD). Flow cytometry data were analyzed using FlowJo v.10 software.
Figure S2
Figure S2. T cell responses to PMA/ionomycin. PBMCs from convalescent COVID-19 individuals (black squares) (n=14) and uninfected/unvaccinated donors (white circles) (n=12) were incubated for the last 6h with PMA (30 ng/mL) and ionomycin (0.3 μg/mL) (positive control). The logarithmic scale represents the percentage of T cells producing IFN-γ. Scatterplots show lines at the median with interquartile ranges. The dashed line represents the assay cut-off value of 0.001%. IFN-γ expression by CD3+ T cells was analyzed by intracellular flow cytometry. T-tests and nonparametric Mann-Whitney tests were used to calculate p values. No significant differences in IFN-γ production were observed between groups (p=0.27).
Figure S3
Figure S3. Chromatographic purification and SDS-PAGE of the SARS-CoV-2 RBD protein (Wuhan strain). The full-length SARS-CoV-2 RBD protein was purified through affinity chromatography (A). UV absorbance at 280 nm (mAU) was monitored over time, and fractions corresponding to the RBD protein (blue area in the graph) were collected. Protein purity was assessed through electrophoresis of the final collected fractions (B), showing that the RBD protein exhibits a molecular weight of 30.6 kDa. The molecular weight marker (MWM) used was the ColorPlus Prestained Protein Marker, Broad Range (7-175 kDa) (Thermo Fisher Scientific).
Figure 1
Figure 1. T cell responses to SARS-CoV-2 proteins. PBMCs from convalescent COVID-19 individuals (black squares) (n=9) and from uninfected/unvaccinated donors (white circles) (n=6) were stimulated for five days with 50 ng/mL SARS-CoV-2 spike (S1); 60 ng/mL nucleocapsid (NC); or a mixture of both SARS-CoV-2 proteins (25 ng/mL each). The logarithmic scale represents the percentage of T cells producing IFN-γ. Scatterplots show lines at the median with interquartile ranges. The dashed line represents the assay cut-off value of 0.001%. IFN-γ expression by CD3+ T cells was analyzed by intracellular flow cytometry. T-tests and nonparametric Mann-Whitney tests were used to calculate p values. Asterisks denote statistically significant differences between the groups (*p<0.05).
Figure 2
Figure 2. T cell responses to SARS-CoV-2 peptide pools. PBMCs from convalescent COVID-19 individuals (black squares) (n=5) and from uninfected/unvaccinated donors (white circles) (n=5) were incubated for 18h with membrane (M) (1 μg/mL), nucleocapsid (N) (1 μg/mL) or spike (S) (1 μg/mL) peptides individually or a mixture of SARS-CoV-2 protein peptide pools grouped (Pool) at a final concentration of 1 μg/mL. The logarithmic scale represents the percentage of T cells producing IFN-γ. Scatterplots show lines at the median with interquartile ranges. The dashed line represents the assay cut-off value of 0.001%. IFN-γ expression by CD3+ T cells was analyzed by intracellular flow cytometry. T-tests and nonparametric Mann-Whitney tests were used to calculate p values. Asterisks denote statistically significant differences between the groups (*p<0.05).
Figure 3
Figure 3. Comparison of IFN-γ production by T cells stimulated with a SARS-CoV-2 recombinant protein or peptide pool. PBMCs from COVID-19 convalescent individuals (black squares) (n=11) and from uninfected/unvaccinated donors (white circles) (n=10) were stimulated for five days with 500 ng/mL RBD protein (A) or were incubated for 18h with a mixture of grouped SARS-CoV-2 peptide pools (M+N+S) at a final concentration of 1 μg/mL (B). The logarithmic scale represents the percentage of T cells producing IFN-γ. Scatterplots show lines at the median with interquartile ranges. The dashed line represents the assay cut-off value of 0.001%. IFN-γ expression by CD3+ T cells was analyzed by intracellular flow cytometry. T-tests and nonparametric Mann-Whitney tests were used to calculate p values. Statistically significant differences were observed between the groups when cells were stimulated with SARS-CoV-2 peptide pools (***p<0.001).
Figure 4
Figure 4. Detection of anti-SARS-CoV-2 specific IgG. Serum samples obtained from COVID-19 convalescent individuals (n=14) and uninfected/unvaccinated donors (n=12) were analyzed to determine the IgG antibody reactivity index (RI) to nucleocapsid (NC) (A), the receptor-binding domain (RBD) (B), and spike (S1 and S2) (C). Scatterplots show lines at the median with interquartile ranges. Dotted lines represent the sample classification cut-off for each test. T-tests and nonparametric Mann-Whitney tests were used to compare the studied groups (*p<0.05; **p<0.005; ***p<0.001).

Similar articles

Cited by

References

    1. Singhal T. A Review of Coronavirus Disease-2019 (COVID-19) Indian J Pediatr. 2020;87(4):281–6. doi: 10.1007/s12098-020-03263-6. - DOI - PMC - PubMed
    1. Li G, Fan Y, Lai Y, Han T, Li Z, Zhou P, et al. Coronavirus infections and immune responses. J Med Virol. 2020;92(4):424–32. doi: 10.1002/jmv.25685. - DOI - PMC - PubMed
    1. Bacher P, Rosati E, Esser D, Martini GR, Saggau C, Schiminsky E, et al. Low-Avidity CD4+ T Cell Responses to SARS-CoV-2 in Unexposed Individuals and Humans with Severe COVID-19. Immunity. 2020;53(6):1258–1271.e5. doi: 10.1016/j.immuni.2020.11.016. - DOI - PMC - PubMed
    1. Kusnadi A, Ramírez-Suástegui C, Fajardo V, Chee SJ, Meckiff BJ, Simon H, et al. Severely ill COVID-19 patients display impaired exhaustion features in SARS-CoV-2-reactive CD8+ T cells. Sci Immunol. 2021;6(55):eabe4782. doi: 10.1126/sciimmunol.abe4782. - DOI - PMC - PubMed
    1. Rabaan AA, Al-Ahmed SH, Haque S, Sah R, Tiwari R, Malik YS, et al. SARS-CoV-2, SARS-CoV, and MERS-COV: A comparative overview. Infez Med. 2020;28(2):174–84. - PubMed

Substances