. 2022 Jan 1;149(1):dev199625.
doi: 10.1242/dev.199625. Epub 2022 Jan 4.

Msl3 promotes germline stem cell differentiation in female Drosophila

Affiliations

Msl3 promotes germline stem cell differentiation in female Drosophila

Alicia McCarthy et al. Development. .

Abstract

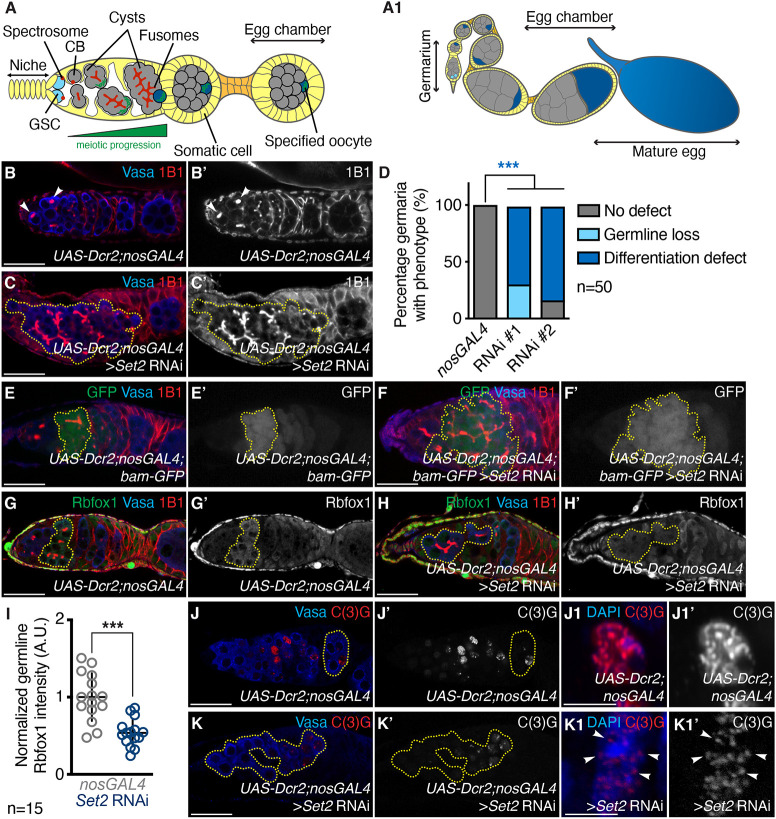
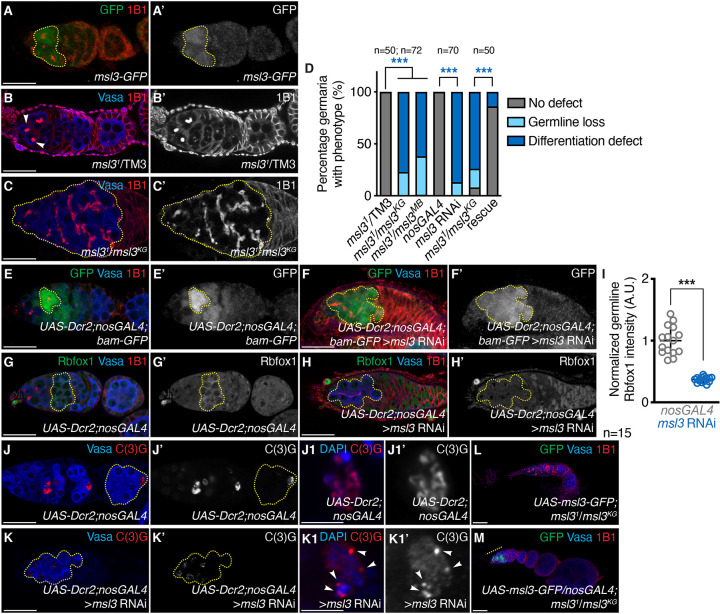
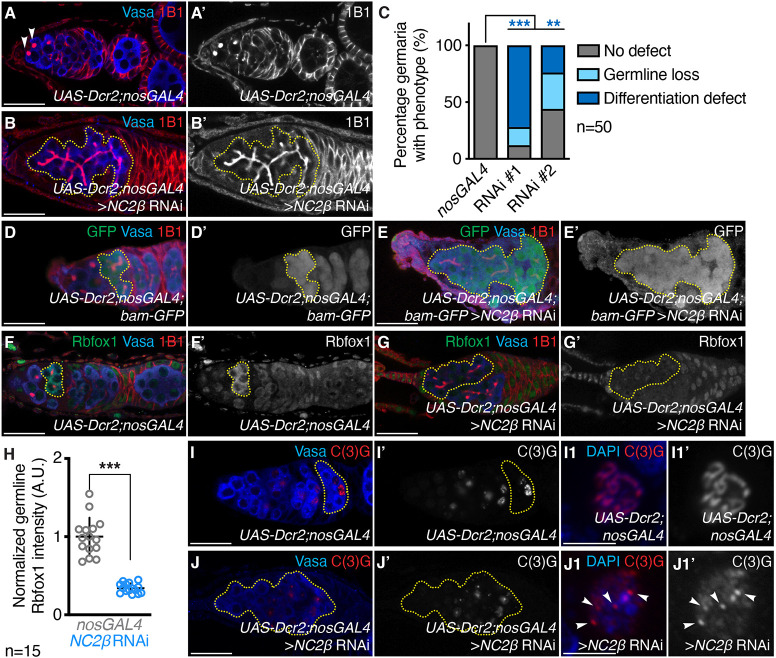
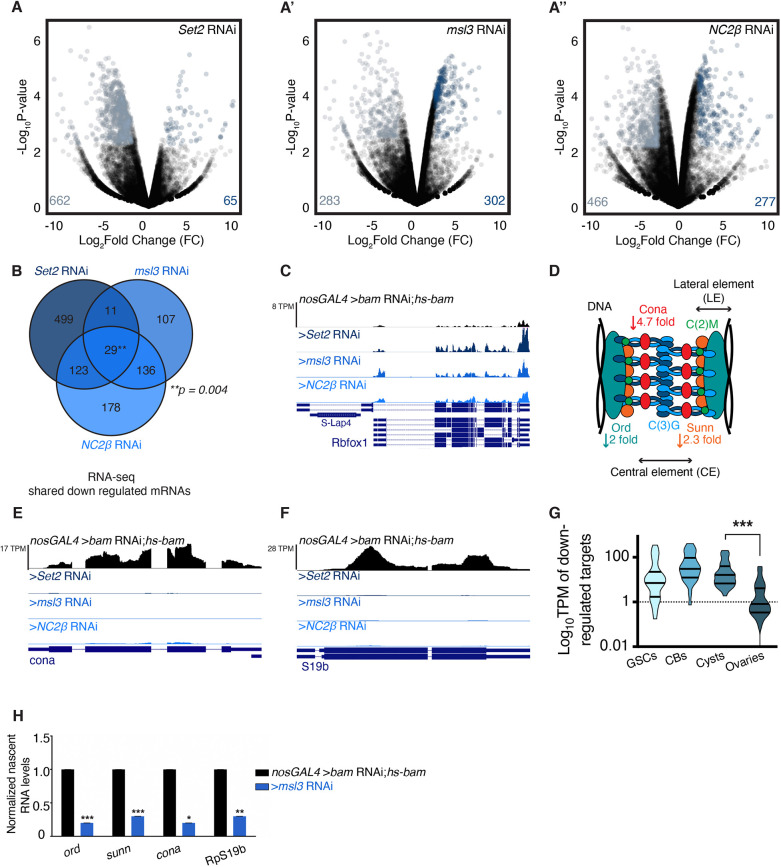
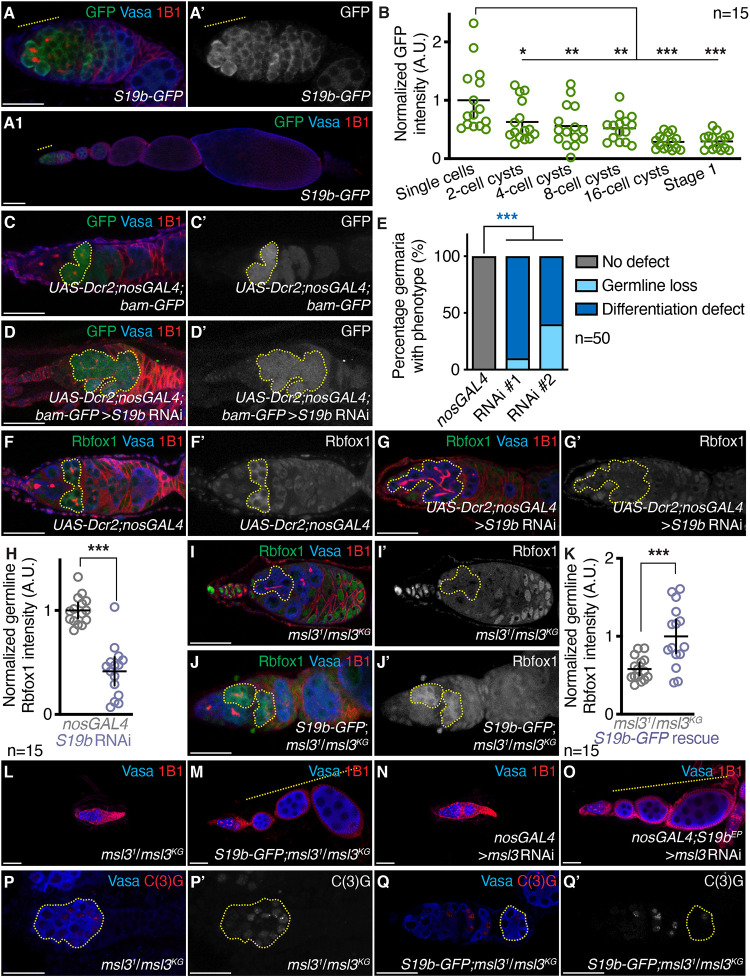
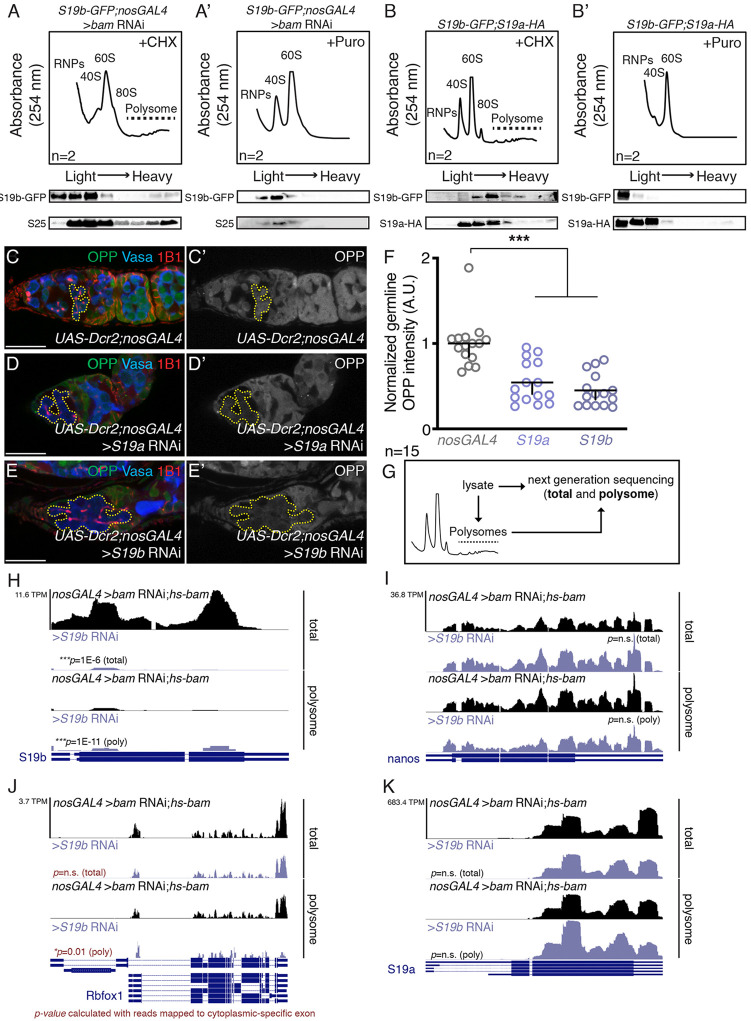
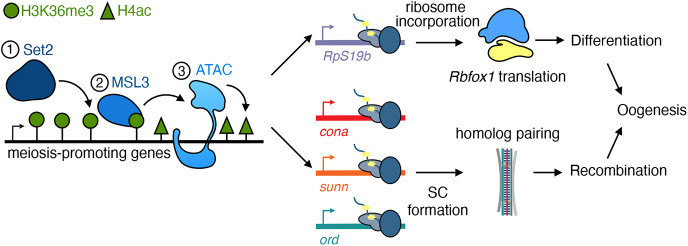
Gamete formation from germline stem cells (GSCs) is essential for sexual reproduction. However, the regulation of GSC differentiation is incompletely understood. Set2, which deposits H3K36me3 modifications, is required for GSC differentiation during Drosophila oogenesis. We discovered that the H3K36me3 reader Male-specific lethal 3 (Msl3) and histone acetyltransferase complex Ada2a-containing (ATAC) cooperate with Set2 to regulate GSC differentiation in female Drosophila. Msl3, acting independently of the rest of the male-specific lethal complex, promotes transcription of genes, including a germline-enriched ribosomal protein S19 paralog RpS19b. RpS19b upregulation is required for translation of RNA-binding Fox protein 1 (Rbfox1), a known meiotic cell cycle entry factor. Thus, Msl3 regulates GSC differentiation by modulating translation of a key factor that promotes transition to an oocyte fate.

Keywords: Differentiation; Meiosis; Msl3; RpS19; Set2 and Rbfox1.


Conflict of interest statement

Competing interests The authors declare no competing or financial interests.

Figures

Fig. 1.
Fig. 1.
Set2 is required in the germline for differentiation during oogenesis. (A) Schematic of a Drosophila germarium where germ cells (gray, and light and dark blue) are surrounded by somatic cells (yellow). Germ cells differentiate and specify an oocyte (green/blue). (A1) A schematic of a Drosophila ovariole showing egg chambers that house a maturing oocyte (blue) connected by somatic cells (orange). (B,B′) Control and (C,C′) germline-depleted Set2 (RNAi line #1) germaria stained for Vasa (blue) and 1B1 (red) show that Set2 germline depletion results in differentiation defects such as accumulation of irregular cysts with >16 cells (yellow dashed outline), accumulation of 16-cell cysts close to the niche and loss of GSCs (white arrowheads in control). The 1B1 channel is shown in B′ and C′. (D) Quantitation of B-C′. Data are percentage of germaria. Fisher's exact test; ***P<0.001. (E,E′) Control and (F,F′) germline-depleted Set2 germaria both carrying a bam-GFP transgene stained for GFP (green), Vasa (blue) and 1B1 (red) show that Set2 germline depletion results in irregular GFP-positive cysts compared with control (yellow dashed outline) (90% in Set2 RNAi compared with 4% in nosGAL4; P<2.2E-16, n=50, Fisher's exact test). GFP channel is shown in E′ and F′. (G,G′) Control and (H,H′) germline-depleted Set2 germaria stained for Rbfox1 (green), Vasa (blue) and 1B1 (red) show that Set2 germline depletion results in decreased levels of Rbfox1 in the germline compared with control (yellow dashed outline). Rbfox1 channel is shown in G′ and H′. (I) Quantitation of G-H′, Student t-test; ***P<0.001. (J-J1′) Control and (K-K1′) germline-depleted Set2 germaria stained for Vasa (blue) and C(3)G (red) show that Set2 germline depletion results in aberrant C(3)G staining compared with control (yellow dashed outline) (100% in Set2 RNAi compared with 2% in nosGAL4; P<2.2E-16, n=50) and improper assembly of the synaptonemal complex (white arrowheads). Statistical analysis, Fisher's exact test. Data are mean±95% CI. C(3)G channel is shown in J′, J1′, K′ and K1′. Scale bars: 20 μm for B-C′,E-H′,J,J′,K,K′; 2 μm for J1,J1′,K1,K1′.
Fig. 2.
Fig. 2.
Msl3 is required in the germline for differentiation. (A,A′) msl3-GFP germarium stained for GFP (green) and 1B1 (red). GFP expression is enriched in single cells and early cysts, showing that Msl3 is expressed in the mitotic and early meiotic stages of oogenesis. GFP channel is shown in A′. (B,B′) Heterozygous control and (C,C′) trans-allelic msl3 mutant germaria stained for Vasa (blue) and 1B1 (red) show that msl3 mutants have differentiation defects, such as accumulation of irregular cysts with >16 cells (yellow dashed outline), accumulation of 16-cell cysts close to the niche and loss of GSCs. Arrowheads in B indicate spectrosomes. 1B1 channel is shown in B′ and C′. (D) Quantitation of B-C′. Data are percentage of germaria. Fisher's exact test; ***P<0.001. (E,E′) Control and (F,F′) germline-depleted msl3 germaria both carrying a bam-GFP transgene stained for GFP (green), Vasa (blue) and 1B1 (red) show that msl3 germline depletion results in irregular GFP-positive cysts compared with control (yellow dashed outline) (96% in msl3 RNAi compared with 0% in nosGAL4; P<2.2E-16, n=50, Fisher's exact test). GFP channel is shown in E′ and F′. (G,G′) Control and (H,H′) germline-depleted msl3 germaria stained for Rbfox1 (green), Vasa (blue) and 1B1 (red) show that msl3 germline depletion results in decreased levels of Rbfox1 in the germline compared with control (yellow dashed outline). The Rbfox1 channel is shown in G′ and H′. (I) Quantitation of G-H′. Data are mean±95% CI. Student's t-test; ***P<0.001. (J,J′) Control and (K,K′) germline-depleted msl3 germaria stained for Vasa (blue) and C(3)G (red) show that msl3 germline depletion results in aberrant C(3)G staining compared with control (yellow dashed outline) (100% in msl3 RNAi compared with 0% in nosGAL4; P<2.2E-16, n=50, Fisher's exact test) and improper assembly of the synaptonemal complex (white arrowheads in K1 and K1′). The C(3)G channel is shown in J′, J1′, K1 and K1′. (L) Control and (M) germline overexpression of msl3 in msl3 mutant germaria stained for GFP (green), Vasa (blue) and 1B1 (red) shows that msl3 germline overexpression in msl3 mutants results in reduced frequency of irregular cysts (yellow dashed line) (14% in msl3 rescue compared with 74% in msl3 mutant; P<2.2E-16, n=50) and germline loss (0% in msl3 rescue compared with 18% in msl3 mutant; P=0.0002, n=50). Scale bars: 20 μm for A-C′,E-H′,J-K′,L,M; 2 μm for J1,J1′,K1,K1′.
Fig. 3.
Fig. 3.
The ATAC component NC2β is required in the germline for differentiation. (A,A′) Control and (B,B′) germline-depleted NC2β germaria stained for Vasa (blue) and 1B1 (red) show that NC2β germline depletion results in differentiation defects such as accumulation of irregular cysts with >16 cells (yellow dashed outline), accumulation of 16-cell cysts close to the niche and loss of GSCs. 1B1 channel is shown in A′ and B′. (C) Quantitation of A-B′. Data are percentage of germaria. Fisher's exact; **P<0.01; ***P<0.001. (D,D′) Control and (E,E′) germline-depleted NC2β germaria both carrying a bam-GFP transgene stained for GFP (green), Vasa (blue) and 1B1 (red) show that NC2β germline depletion results in accumulation of irregular GFP-positive cysts compared with control (yellow dashed outline) (64% in NC2β RNAi compared with 0% in nosGAL4; P=2.5E-13, n=50, Fisher's exact test). GFP channel is shown in D′ and E′. (F,F′) Control and (G,G′) germline-depleted NC2β germaria stained for Rbfox1 (green), Vasa (blue) and 1B1 (red) show that NC2β germline depletion results in decreased levels of Rbfox1 in the germline compared with control (yellow dashed outline). Rbfox1 channel is shown in F′ and G′. (H) Quantitation of F-G′. Data are mean±95% CI. Student's t-test; ***P<0.001. (I,I′,I1,I1′) Control and (J,J′,J1,J1′) germline-depleted NC2β germaria stained for Vasa (blue) and C(3)G (red) show that NC2β germline depletion results in aberrant C(3)G staining compared with control (yellow dashed outline and white arrowheads) (75% in NC2β RNAi compared with 0% in nosGAL4; P<2.2E-16, n=50) and improper assembly of the synaptonemal complex (white arrows). C(3)G channel is shown in I′, I1′, J′ and J1′. Scale bars: 20 μm for A-B′,D-G′,I,I′,J,J′; 2 μm for I1,I1′,J1,J1′.
Fig. 4.
Fig. 4.
Set2, Msl3 and the ATAC complex regulate mRNA levels of recombination machinery components, but not Rbfox1. (A-A″) Volcano plots of –Log10P-value versus Log2Fold Change (FC) of (A) Set2, (A′) msl3 and (A″) NC2β germline-depleted ovaries compared with bam RNAi;hs-bam. Genes with fourfold or higher changes were considered significant (FDR=0.05). (B) Venn diagram of downregulated genes from RNA-seq of Set2, msl3 and NC2β germline-depleted ovaries compared with bam RNAi;hs-bam. (C) RNA-seq track showing that Rbfox1 is not reduced upon germline depletion of Set2, msl3 and NC2β. (D) A structural model of the SC consisting of proteins such as Ord (teal), Sunn (orange) and C(2)M (green) assemble along DNA. Downward arrows denote fold downregulation of SC components in depleted ovaries. (E) RNA-seq track showing that cona is reduced upon germline depletion of Set2, msl3 and NC2β. (F) RNA-seq track showing that RpS19b is reduced upon germline depletion of Set2, msl3 and NC2β. (G) Violin plot of mRNA levels of the 29 shared downregulated targets in ovaries enriched for GSCs, GSC daughters, cysts and whole ovaries, showing that the shared targets are expressed up to cyst stages, that then attenuate in whole ovaries (one-way ANOVA; ***P<0.001). (H) qRT-PCR measuring levels of nascent mRNA levels of ord, sunn, cona and RpS19b upon depletion of msl3 showing reduction compared with developmental control. Student's t-test; *P<0.05, **P<0.01, ***P<0.001.
Fig. 5.
Fig. 5.
RpS19b, a germline-enriched paralog, is expressed in the mitotic and early meiotic stages, and is required for Rbfox1 expression. (A,A′) RpS19b-GFP germarium and (A1) ovariole stained for GFP (green), Vasa (blue) and 1B1 (red). GFP is visible up to the cyst stages and then attenuated. GFP channel is shown in A′. (B) Quantitation of A,A′. Data are mean±95% CI. One-way ANOVA; *P<0.05, **P<0.01 and ***P<0.001. (C,C′) Control and (D,D′) germline-depleted RpS19b germaria both carrying a bam-GFP transgene stained for GFP (green), Vasa (blue) and 1B1 (red) show cysts with more than 16 cells that are GFP positive in RpS19b germline depletion compared with control (yellow dashed line). GFP channel is shown in C′ and D′. (E) Quantitation of C-D′. Data are percent germaria. Fisher's exact test on differentiation defect; ***P<0.001. (F,F′) Control and (G,G′) germline-depleted RpS19b germaria stained for Rbfox1 (green), Vasa (blue) and 1B1 (red) show that RpS19b germline depletion results in decreased levels of Rbfox1 compared with control (yellow dashed outline). Rbfox1 channel is shown in F′ and G′. (H) Quantitation of F-G′. Data are mean±95% CI. Student's t-test; ***P<0.001. (I,I′) Control and (J,J′) RpS19b-GFP rescue germaria stained for Rbfox1 (green), Vasa (blue) and 1B1 (red) show that addition of RpS19b-GFP to msl3 mutants results in increased levels of Rbfox1 expression compared with control. Rbfox1 channel is shown in I′ and J′. (K) Quantitation in of I-J′. Data are mean±95% CI. Student's t-test; ***P<0.001. (L) Control and (M) RpS19b-GFP rescue ovarioles stained for Vasa (blue) and 1B1 (red) show that addition of RpS19b-GFP to msl3 mutants results in an increased frequency of spectrosomes and cysts (92% in RpS19b-GFP rescue compared with 4% in msl31/msl3KG; P<2.2E-16, n=50), and of subsequent egg chambers compared with control (yellow dashed line) (98% in RpS19b-GFP rescue compared with 16% in msl31/msl3KG; P<2.2E-16, n=50, Fisher's exact test). (N) Control and (O) RpS19bEP rescue ovarioles stained for Vasa (blue) and 1B1 (red) show that expression of RpS19bEP in msl3 germline-depleted ovaries results in an increased frequency of spectrosomes and cysts (90% in RpS19bEP rescue compared with 0% in msl3 RNAi; P<2.2E-16, n=50), and of subsequent egg chambers compared with control (yellow dashed line) (100% in RpS19bEP rescue compared with 4% in msl3 RNAi; P<2.2E-16, n=50, Fisher's exact test). (P,P′) Control and (Q,Q′) RpS19b-GFP rescue germaria stained for Vasa (blue) and C(3)G (red) show that rescue and control germaria have aberrant C(3)G expression (yellow dashed outline) (96% in RpS19b-GFP rescue compared with 100% in msl31/msl3KG; P=0.5, n=50). Addition of RpS19b-GFP does not rescue egg-laying defects (38 eggs/female in RpS19b-GFP, 32 eggs/female in msl31 heterozygote and 101 eggs/female in msl3KG heterozygotes compared with 0 eggs/female in msl3KG/msl31 and rescue; P=0.02 for msl3KG/msl31 and P=0.03 for rescue, n=4, Fisher's exact test). C(3)G channel is shown in P′ and Q′. Scale bars: 20 μm.
Fig. 6.
Fig. 6.
RpS19 paralogs are incorporated into the ribosome and RpS19 levels affect translation, including translation of Rbfox1. (A,A′) Top: polysome profiles of RpS19b-GFP;nosGAL4 >bam RNAi ovaries treated with cycloheximide (CHX, A) or puromycin (A′). Bottom: western blot of (A) cycloheximide (CHX) or (A′) puromycin. Blots were stained for GFP (top) and RpS25 (bottom), showing RpS19b and RpS25 bands in heavy fractions in CHX-treated samples that are absent in puromycin-treated samples. (B,B′) Top: polysome profiles of RpS19b-GFP;RpS19a-HA whole ovaries treated with cycloheximide (CHX, B) or puromycin (B′). Bottom: western blot of cycloheximide (B, CHX) or puromycin (B′). Blots were stained for HA (top) and GFP (bottom), showing RpS19a and RpS19b bands in heavy fractions in CHX-treated samples that are absent in puromycin-treated samples. (C,C′) Control and (D,D′) germline-depleted RpS19a and (E-E′) RpS19b germaria pulsed with OPP (green) and stained for Vasa (blue) and 1B1 (red) show that RpS19a and RpS19b germline depletion results in decreased OPP compared with control. The OPP channel is shown in C′, D′ and E′. (F) Quantitation of C-E′. Data are mean±95% CI. One-way ANOVA; ***P<0.001. (G) A schematic of the experimental approach to polysome-seq: RNA is extracted (total) with polysome fractionation (polysome) followed by sequencing. (H) RNA-seq track of total (top) and polysome (bottom) showing that RpS19b is reduced upon germline depletion of RpS19b (purple) compared with control (black) (total: Log2FC=-4.1, P=1E-6, n=2 and polysome: Log2FC=-4.5; P=1E-11, n=2). Student's t-test; ***P<0.001. (I) RNA-seq track of total (top) and polysome (bottom) showing that nanos and amount of germline is not reduced upon germline depletion of RpS19b (purple) compared with control (black) (total: Log2FC=0.4; P=0.4, n=2 and polysome: Log2FC=0.3; P=0.7, n=2). Student's t-test; n.s. indicates P>0.5. (J) RNA-seq track of total (top) and polysome (bottom) showing that cytoplasmic Rbfox1 is reduced in polysome fractions upon germline depletion of RpS19b (purple) compared with control (black) (total: P=0.2, n=2; polysome: P=0.01, n=2). Student t-test; n.s. indicates P>0.5 and *P<0.05. (K) RNA-seq track of total (top) and polysome (bottom) showing that RpS19a is not reduced upon germline depletion of RpS19b (purple) compared with control (black) (total: Log2FC=-0.4; P=0.4, n=2 and polysome: Log2FC=-0.1; P=0.9, n=2). Student's t-test; n.s. indicates P>0.5. Scale bars: 20 μm.
Fig. 7.
Fig. 7.
Schematic of how Set2, Msl3 and the ATAC complex regulate oogenesis. Set2, Msl3 and the ATAC complex regulate transcription of RpS19b and SC components. RpS19b promotes translation of differentiation factor Rbfox1 to promote oogenesis.

Similar articles

Cited by

References

    1. Ables, E. T. (2015). Drosophila oocytes as a model for understanding meiosis: an educational primer to accompany “corolla is a novel protein that contributes to the architecture of the synaptonemal complex of Drosophila. Genetics 199, 17-23. 10.1534/genetics.114.167940 - DOI - PMC - PubMed
    1. Allis, C. D. and Jenuwein, T. (2016). The molecular hallmarks of epigenetic control. Nat. Rev. Genet. 17, 487. 10.1038/nrg.2016.59 - DOI - PubMed
    1. Anderson, L. K., Royer, S. M., Page, S. L., McKim, K. S., Lai, A., Lilly, M. A. and Hawley, R. S. (2005). Juxtaposition of C(2)M and the transverse filament protein C(3)G within the central region of Drosophila synaptonemal complex. Proc. Natl. Acad. Sci. U.S.A. 102, 4482-4487. 10.1073/pnas.0500172102 - DOI - PMC - PubMed
    1. Bachiller, D. and Sánchez, L. (1989). Further analysis on the male-specific lethal mutations that affect dosage compensation in Drosophila melanogaster. Roux's Arch. Dev. Biol. 198, 34-38. 10.1007/BF00376368 - DOI - PubMed
    1. Balicky, E. M., Endres, M. W., Lai, C. and Bickel, S. E. (2002). Meiotic cohesion requires accumulation of ORD on chromosomes before condensation. Mol. Biol. Cell 13, 3890-3900. 10.1091/mbc.e02-06-0332 - DOI - PMC - PubMed

Publication types

MeSH terms