. 2021 Dec 1;13(12):evab270.
doi: 10.1093/gbe/evab270.

Whole-Genome Sequencing Highlights Conservative Genomic Strategies of a Stress-Tolerant, Long-Lived Scleractinian Coral, Porites australiensis Vaughan, 1918

Affiliations

Whole-Genome Sequencing Highlights Conservative Genomic Strategies of a Stress-Tolerant, Long-Lived Scleractinian Coral, Porites australiensis Vaughan, 1918

Chuya Shinzato et al. Genome Biol Evol. .

Abstract

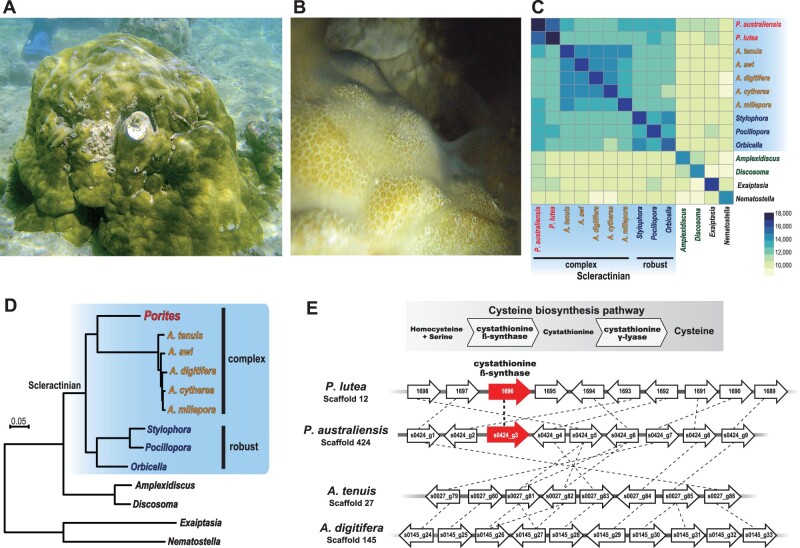
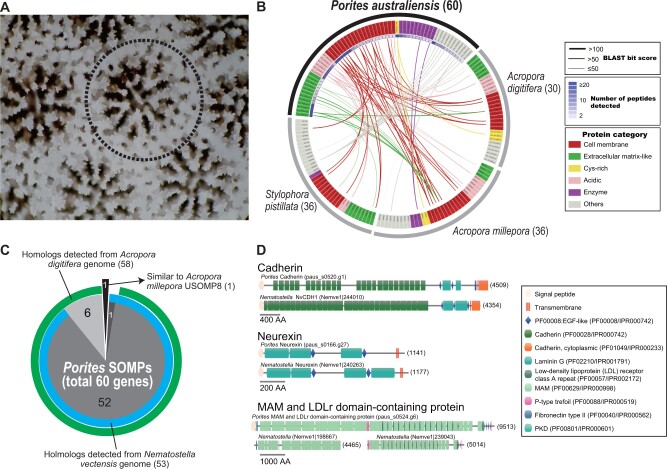
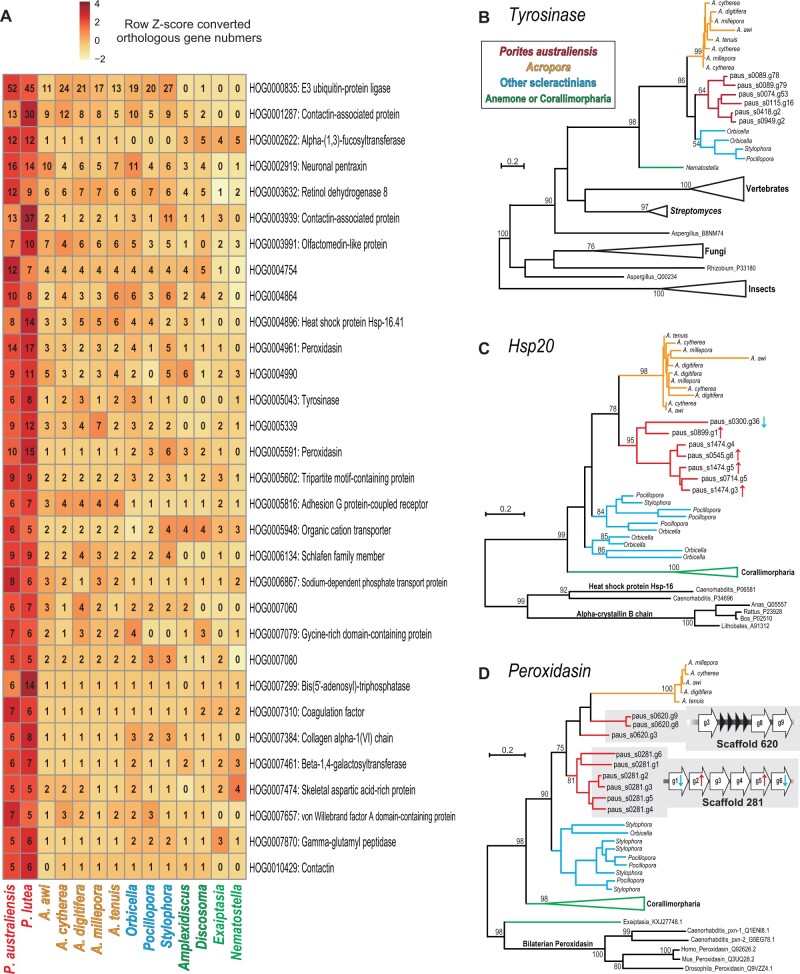
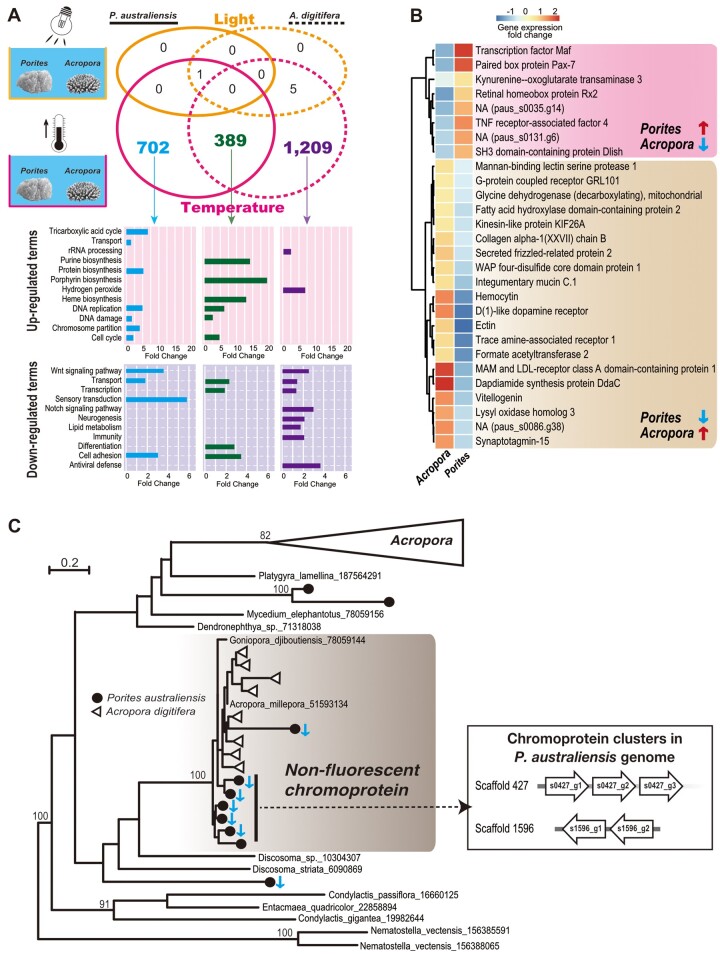
Massive corals of the genus Porites, common, keystone reef builders in the Indo-Pacific Ocean, are distinguished by their relative stress tolerance and longevity. In order to identify genetic bases of these attributes, we sequenced the complete genome of a massive coral, Porites australiensis. We developed a genome assembly and gene models of comparable quality to those of other coral genomes. Proteome analysis identified 60 Porites skeletal matrix protein genes, all of which show significant similarities to genes from other corals and even to those from a sea anemone, which has no skeleton. Nonetheless, 30% of its skeletal matrix proteins were unique to Porites and were not present in the skeletons of other corals. Comparative genomic analyses showed that genes widely conserved among other organisms are selectively expanded in Porites. Specifically, comparisons of transcriptomic responses of P. australiensis and Acropora digitifera, a stress-sensitive coral, reveal significant differences in regard to genes that respond to increased water temperature, and some of the genes expanded exclusively in Porites may account for the different thermal tolerances of these corals. Taken together, widely shared genes may have given rise to unique biological characteristics of Porites, massive skeletons and stress tolerance.

Keywords: Porites; gene duplication; gene expression; genome sequencing; scleractinia; skeletal matrix protein.


Figures

Fig. 1.
Fig. 1.
Genome sequencing of Porites australiensis. (A) Photo of a P. australiensis colony in Okinawa, Japan. (B) Spawning of a male colony of P. australiensis. Sperm can be observed on the surface of the colony. (C) A heatmap showing numbers of shared HOGs among anthozoans. Scleractinian species are shaded in blue. Porites is in red; Acropora species are in yellow. Robust coral species are in blue and corallimorpharians are in green. (D) Molecular phylogeny of anthozoans using 1,878 single-copy, orthologous genes (429,044 amino acids). All nodes are supported with 100% bootstrap support. (E) The cystathionine β-synthase (CBS) locus in the Porites genomes. The cysteine biosynthesis pathway is shown above, and the syntenic relationship around CBS in the P. australiensis, P. lutea, Acropora tenuis, and A. digitifera genomes is shown below. Genes are shown with arrows (arrow directions correspond to gene directions) and PoritesCBS genes are shown as red arrows. Genes belonging to the same OG are connected by dotted lines.
Fig. 2.
Fig. 2.
Skeletal proteome analysis of Porites australiensis. (A) High-magnification photo of a P. australiensis skeleton. The dotted line indicates a polyp. (B) A circos plot showing sequence similarities of PoritesSOMP genes against known SOMPs of other corals, Acropora digitifera, A. millepora, and Stylophora pistillata. Each box along the arc indicates a SOMP gene, and gene names are colored based on protein categories (cell membrane, extracellular matrix-like, cysteine-rich, acidic, enzymes, and others), as shown at the right. SOMPs connected by lines show significant sequence similarity (BLASTP, E-value ≤e−5), and thicknesses of lines reflect BLAST bit scores. Numbers of peptides detected by LC–MS/MS are shown by heatmap inside Porites gene names. (C) A pie chart showing numbers of putative homologs of PoritesSOMP genes (total 60) detected in Acropora digitifera (green) and sea anemone N. vectensis (blue) genomes. One gene (paus_s0004.g93) that was not detected in the two genomes showed similarity to A. milleporaUSOMP8 (Ramos-Silva et al. 2013). (D) Comparison of functional protein domain architectures of Porites cell membrane SOMPs, cadherin, neurexin, and MAM and LDLr dcps (upper) with their putative orthologs in Nematostella (lower). The amino acid length of each gene is shown in brackets.
Fig. 3.
Fig. 3.
Porites-specific gene expansions. (A) Gene families that are expanded in the Porites lineage. Numbers of genes in each gene family, shown in each box, are converted to row Z scores and colored. (B) Maximum likelihood analysis of tyrosinases, or tyrosinase-type phenoloxidases genes. (C) Maximum likelihood analysis of heat shock protein 20 genes. (D) Maximum likelihood analysis of peroxidasin genes. Peroxidasin gene clusters in the P. australiensis genome are shown in gray. Nodes of P. australiensis genes are colored red, Acropora genes are in yellow. Robust coral genes are in blue. Corallimorpharian genes are in green. Upward red arrows and downward blue arrows next to gene names indicate genes significantly upregulated or downregulated by increased seawater temperature (FDR <0.05) reported in figure 4, respectively.
Fig. 4.
Fig. 4.
Comparison of transcriptomic responses of Porites australiensis and Acropora digitifera to increased seawater temperature and light intensity. (A) Upper: Venn diagram showing numbers of DEGs included in single-copy Hierarchical Orthogroups (SC-HOGs) between P. australiensis and A. digitifera. SC-HOGs differentially expressed under increased light intensity are colored yellow, and SC-HOGs differentially expressed under increased seawater temperature are colored pink. Lower: significantly upregulated or downregulated UniProt keywords (biological process) detected from DEGs in SC-HOGs under increased seawater temperature. Blue indicates Porites-specific SC-HOGs that were differentially expressed. Green indicates SC-HOGs differentially expressed in both Porites and Acropora. Purple indicates Acropora-specific SC-HOGs that were differentially expressed. (B) Gene expression changes of SC-HOGs differentially expressed in both Porites and Acropora, but in which expression patterns were opposite. Putative gene names are based on the Uniprot/Swissprot database. Pink shading denotes SC-HOG gene pairs that were significantly upregulated in Porites and downregulated in Acropora. Brown shading indicates SC-HOGs that were significantly downregulated in Porites and upregulated in Acropora. Gene expression changes compared with control conditions are shown in a colored heatmap. (C) Maximum likelihood analysis of anthozoan fluorescent protein (FP)-like genes using 215 aligned translated amino acids. Bootstrap values more than 80% are shown. Porites australiensis genes are shown with circles and Acropora digitifera genes are shown with triangles. The Acropora-specific FP clade is collapsed and nonfluorescent chromoproteins are shaded in gray. Downward blue arrows indicate P. australiensischromoprotein genes significantly downregulated by increased seawater temperature (FDR <0.05). Chromoprotein gene clusters in the P. australiensis genome, all of which were downregulated by increased seawater temperature, are shown in the box to the right.

References

    1. Addadi L, Weiner S.. 1985. Interactions between acidic proteins and crystals: stereochemical requirements in biomineralization. Proc Natl Acad Sci U S A. 82(12):4110–4114. - PMC - PubMed
    1. Albeck S, Aizenberg J, Addadi L, Weiner S.. 1993. Interactions of various skeletal intracrystalline components with calcite crystals. J Am Chem Soc. 115(25):11691–11697.
    1. Anthony KRN, Kline DI, Diaz-Pulido G, Dove S, Hoegh-Guldberg O.. 2008. Ocean acidification causes bleaching and productivity loss in coral reef builders. Proc Natl Acad Sci U S A. 105(45):17442–17446. - PMC - PubMed
    1. Barshis DJ, et al.2013. Genomic basis for coral resilience to climate change. Proc Natl Acad Sci U S A. 110(4):1387–1392. - PMC - PubMed
    1. Baumgarten S, et al.2015. The genome of Aiptasia, a sea anemone model for coral symbiosis. Proc Natl Acad Sci U S A. 112(38):11893–11898. - PMC - PubMed

Publication types