. 2021 Dec 16;49(22):13108-13121.
doi: 10.1093/nar/gkab1187.

FARS2 deficiency in Drosophila reveals the developmental delay and seizure manifested by aberrant mitochondrial tRNA metabolism

Affiliations

FARS2 deficiency in Drosophila reveals the developmental delay and seizure manifested by aberrant mitochondrial tRNA metabolism

Wenlu Fan et al. Nucleic Acids Res. .

Abstract

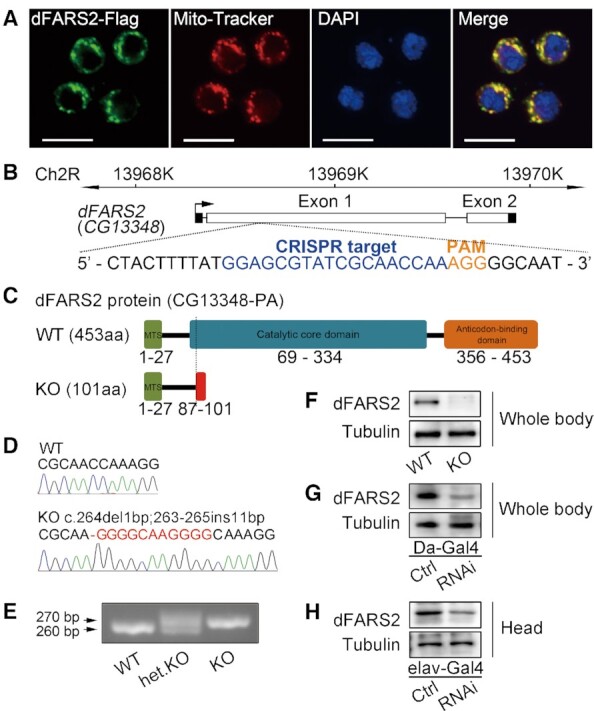
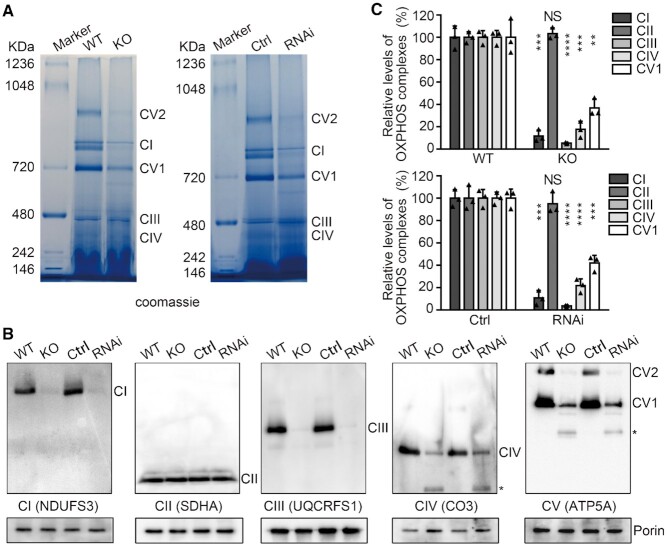
Mutations in genes encoding mitochondrial aminoacyl-tRNA synthetases are linked to diverse diseases. However, the precise mechanisms by which these mutations affect mitochondrial function and disease development are not fully understood. Here, we develop a Drosophila model to study the function of dFARS2, the Drosophila homologue of the mitochondrial phenylalanyl-tRNA synthetase, and further characterize human disease-associated FARS2 variants. Inactivation of dFARS2 in Drosophila leads to developmental delay and seizure. Biochemical studies reveal that dFARS2 is required for mitochondrial tRNA aminoacylation, mitochondrial protein stability, and assembly and enzyme activities of OXPHOS complexes. Interestingly, by modeling FARS2 mutations associated with human disease in Drosophila, we provide evidence that expression of two human FARS2 variants, p.G309S and p.D142Y, induces seizure behaviors and locomotion defects, respectively. Together, our results not only show the relationship between dysfunction of mitochondrial aminoacylation system and pathologies, but also illustrate the application of Drosophila model for functional analysis of human disease-causing variants.


Figures

Figure 1.
Figure 1.
Generation of Drosophila models with dFARS2 deficiency. (A) Mitochondrial localization of dFARS2 in S2 cells. Cells were stained for Mito-Tracker (Red) and anti-Flag antibody (Green). DAPI was used to label DNA (Blue). Scale bar represents 10 μm. (B) Genome editing of dFARS2 using the CRISPR/Cas9 system. sgRNA sequence is indicated in blue and PAM sequence is indicated in orange. (C) Schematic representation of the dFARS2 wild type (WT) and dFARS2 mutant (KO) proteins. MTS indicates mitochondrial targeting sequence. (D) Partial Sanger sequencing chromatograms of the sgRNA targeting region showing for WT and dFARS2KO. A hyphen indicates a deletion and a red letter indicates an insertion. (E) PCR analysis of the sgRNA targeting region at the dFARS2 locus. (F–H) Western blot analysis of dFARS2 in protein extracts from WT and dFARS2KO second-instar larvae (F), the control and Da-Gal4 driven dFARS2 knockdown second-instar larvae (G), the control and elav-Gal4 driven dFARS2 knockdown fly heads (H).
Figure 2.
Figure 2.
dFARS2 deficiency leads to the developmental delay. (A) Images showing wild type (WT) and dFARS2 knockout (KO) larvae, from 1 to 5 days after egg laying (AEL). Rescue denotes the dFARS2KO carrying the genomic rescue transgene for dFARS2. Scale bars: 1 mm. (B) Graph showing the percentage of survivors for WT, dFARS2KO and rescue larvae from 1 to 5 days AEL. n = 5. (C) Graph showing the relative size of WT, dFARS2KO and rescue larvae at 5 days AEL. n = 10. (D) Images showing control and Da-Gal4 driven dFARS2 knockdown animals at various developmental stages. Scale bars: 1 mm. (E) Graph showing the percentage of survivors for control and Da-Gal4 driven dFARS2 knockdown larvae. n = 5. (F) Graph showing the relative size of control and Da-Gal4 driven dFARS2 knockdown larvae at 5 days AEL. n = 10. (G) Images showing control and elav-Gal4 driven dFARS2 knockdown animals at various developmental stages, from 1 to 15 days AEL. Scale bars: 1 mm. (H) Graph showing pupariation curves for control and elav-Gal4 driven dFARS2 knockdown larvae. n = 3. (I) Graph showing eclosion curves for control and elav-Gal4 driven dFARS2 knockdown pupae. n = 4. (J) Graph showing the survival rate of control and elav-Gal4 driven dFARS2 knockdown adult flies. n = 3. Data are presented as means ± SD. ****P< 0.0001. NS, not significant.
Figure 3.
Figure 3.
dFARS2 deficiency causes seizure phenotype in adult flies. (A) Setup for the Bang-sensitive assay. Also see supplementary video 1. (B) Graph showing the percentage of control and elav-Gal4 driven dFARS2 knockdown flies with BS paralytic phenotypes (% Bang sensitive paralysis). n = 4. (C) Graph showing the recovery time of control (female: n = 13; male: n = 11) and elav-Gal4 driven dFARS2 knockdown (female: n = 34; male: n = 36) flies after BS paralysis. (D) Images showing the brain of control and elav-Gal4 driven dFARS2 knockdown flies. Scale bars represent 100 μm. (E, F) Transmission electron microscope images showing the untrastructure of brain tissues from control and elav-Gal4 driven dFARS2 knockdown flies. Magnifications of (E) and (F) are 40 000× and 100 000× respectively. Data are presented as means ± SD. ***P< 0.001. ****P< 0.0001. Scale bars represent 0.2 μm (E) and 0.1 μm (F).
Figure 4.
Figure 4.
The effects of dFARS2 deficiency on the aminoacylation and steady-state levels of tRNAs. (A, B) In vivo aminoacylation of mitochondrial tRNA assays. Fifty or one hundred μg of total RNAs purified from various larvae (A) the whole body of dFARS2KO and WT second instar larvae; (B) the whole body of Da-Gal4 driven dFARS2 knockdown second instar larvae or the head of elav-Gal4 driven dFARS2 knockdown and control flies) under acid conditions were electrophoresed through an acid (pH 5.2) 9% polyacrylamide-7 M urea gel, electroblotted, and hybridized with DIG-labeled oligonucleotide probes specific for the tRNAPhe, tRNALys and tRNAThr, respectively. The charged (upper band) and uncharged (lower band) forms of different tRNAs were separated by the gel system. Samples were deacylated (DA) by heating for 10 min at 60°C at pH 9, electrophoresed, and hybridized with DIG-labeled oligonucleotide probes as described above. (C, D) Northern blot analysis of eight tRNAs. Ten μg of total RNA from various larvae were electrophoresed through a denaturing polyacrylamide gel, electroblotted, and hybridized with DIG-labeled oligonucleotide probes specific for tRNAPhe, tRNALys, tRNAThr, tRNALeu(CUN), tRNAAsp, tRNAHis, tRNATyr, tRNAIle and 5S rRNA, respectively. (E, F) Quantification of relative tRNA levels. The content of each tRNA was normalized to that of 5S rRNA. Calculations were based on three independent experiments. Error bars indicate two standard deviations (SD) of the means. * P< 0.05, ** P< 0.01, *** P< 0.001, **** P< 0.0001. NS, not significant.
Figure 5.
Figure 5.
Western blotting analysis of mitochondrial proteins. (A) Ten micrograms of total proteins from various larvae were electrophoresed through a denaturing polyacrylamide gel, electroblotted and hybridized with antibodies for 6 subunits of OXPHOS (mtDNA-encoded CO3, complex IV, nuclear-encoded UQRCFS1, complex III; NDUFS3 and NDUFS1, complex I; ATP5A, complex V; SDHA, complex II), and Porin as a loading control, respectively. (B) Quantification of relative mitochondrial protein levels. Average content of each polypeptide was normalized to the average content of Porin in each genotype. n = 3. Calculations were based on three independent experiments. Graph details and symbols are explained in the legend to Figure 4.
Figure 6.
Figure 6.
Defective assembly of OXPHOS complexes. (A) BN-PAGE analysis of mitochondrial respiratory chain complexes in mitochondrial protein extracts from larvae with different genotypes. Left: WT and dFARS2KO larvae; Right: control and Da-Gal4 driven dFARS2 knockdown second instar larvae. Positions of specific complexes are indicated. (B) Western blot analysis of mitochondrial proteins after BN-PAGE. Mitochondria extracted from various larvae were solubilized with 20% Triton X-100, electroblotted and hybridized with antibodies specific for subunits of OXPHOS, respectively, and with Porin as a loading control. Asterisk indicates unknown complexes. (C) Quantification of the levels of complexes I, II, III, IV and V1 in various larvae. The calculations were based on three independent determinations. Graph details and symbols are explained in the legend to Figure 4.
Figure 7.
Figure 7.
Enzymatic activities of respiratory chain complexes. The activities of respiratory chain complexes were investigated by enzymatic assay on complexes I, II, III, IV and V in mitochondria isolated from WT and dFARS2KO second instar larvae (A), and control and Da-Gal4 driven dFARS2 knockdown second instar larvae (B). The calculations were based on three independent experiments. Graph details and symbols are explained in the legend to Figure 4.
Figure 8.
Figure 8.
Functional analysis of two human FARS2 variants in dFARS2 mutants. (A) Images showing the larvae with different genotypes at 5 days AEL (left) and adult female flies at 15 days AEL (right). Scale bars represent 1 mm. (B) Graph showing pupariation curves for control, dFARS2KO larvae expressing human wild type FARS2, FARS2 p.G309S mutation or FARS2 p.D142Y mutation. n = 4. (C) Graph showing the percentage of female flies (control, KO + FARS2, KO + FARS2G309S or KO + FARS2D142Y) with BS paralytic phenotypes. n = 4. (D) Graph showing the recovery time of flies as described in (C) after BS paralysis. n = 7 for control; n = 8 for KO + FARS2; n = 17 for KO + FARS2G309S; n = 9 for KO + FARS2D142Y. (E) Graph showing the climbing index of flies as described in (C). n = 5. (F)In vivo aminoacylation of tRNAPhe assay in control and dFARS2KO third instar larvae expressing human wild type FARS2 (KO + FARS2), FARS2 p.G309S mutation (KO + FARS2G309S) or FARS2 p.D142Y mutation (KO + FARS2D142Y). (G) Quantification of aminoacylation level of tRNAPhe among larvae with different genotypes. (H) Northern blot analysis of tRNAPhe and tRNALys in various third instar larvae. (I) In-gel activity analysis from various third instar larvae. The left panel shows in gel activity of complex I, and the right panel shows in-gel activity of complex II. The calculations were based on 3–4 independent experiments. Graph details and symbols are explained in the legend to Figure 4.

References

    1. Florentz C., Sohm B., Tryoen-Toth P., Putz J., Sissler M.. Human mitochondrial tRNAs in health and disease. Cell Mol. Life Sci. 2003; 60:1356–1375. - PMC - PubMed
    1. Suzuki T., Nagao A., Suzuki T.. Human mitochondrial tRNAs: biogenesis, function, structural aspects, and diseases. Annu. Rev. Genet. 2011; 45:299–329. - PubMed
    1. Zheng J., Ji Y.C., Guan M.X.. Mitochondrial tRNA mutations associated with deafness. Mitochondrion. 2012; 12:406–413. - PubMed
    1. Tyynismaa H., Schon E.A.. Mixing and matching mitochondrial aminoacyl synthetases and their tRNAs: a new way to treat respiratory chain disorders?. Embo Mol. Med. 2014; 6:155–157. - PMC - PubMed
    1. Boczonadi V., Ricci G., Horvath R.. Mitochondrial DNA transcription and translation: clinical syndromes. Essays Biochem. 2018; 62:321–340. - PMC - PubMed

Publication types

MeSH terms