

Spinal Cord Atrophy Predicts Progressive Disease in Relapsing Multiple Sclerosis
- PMID: 34878197
- PMCID: PMC8916838
- DOI: 10.1002/ana.26281
Spinal Cord Atrophy Predicts Progressive Disease in Relapsing Multiple Sclerosis
Abstract
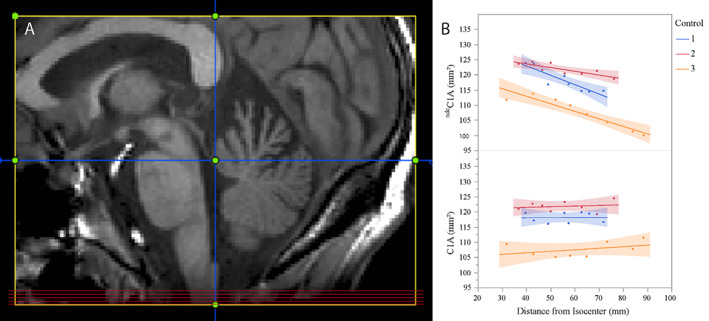
Objective: A major challenge in multiple sclerosis (MS) research is the understanding of silent progression and Progressive MS. Using a novel method to accurately capture upper cervical cord area from legacy brain MRI scans we aimed to study the role of spinal cord and brain atrophy for silent progression and conversion to secondary progressive disease (SPMS).
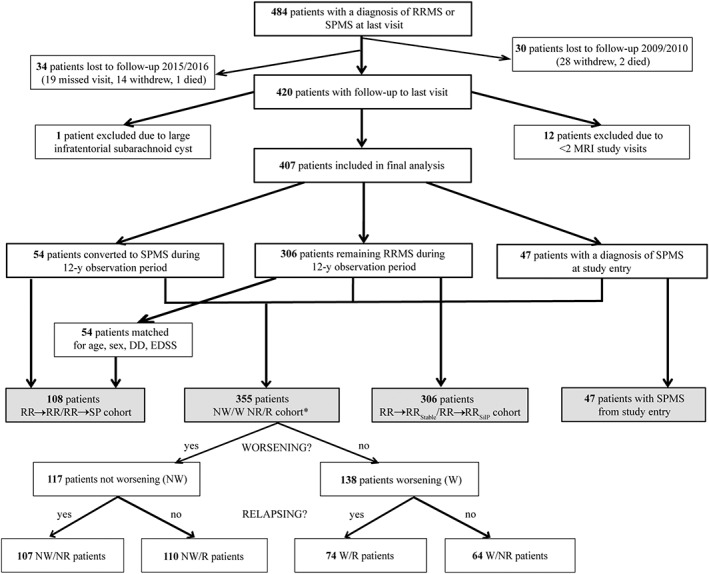
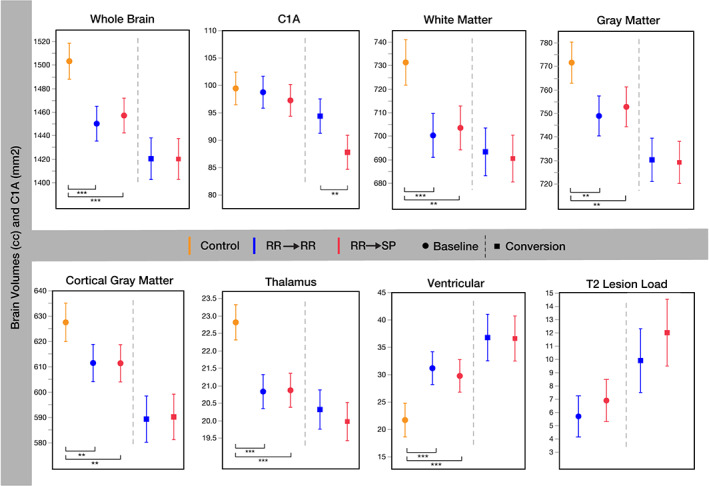
Methods: From a single-center observational study, all RRMS (n = 360) and SPMS (n = 47) patients and 80 matched controls were evaluated. RRMS patient subsets who converted to SPMS (n = 54) or silently progressed (n = 159), respectively, during the 12-year observation period were compared to clinically matched RRMS patients remaining RRMS (n = 54) or stable (n = 147), respectively. From brain MRI, we assessed the value of brain and spinal cord measures to predict silent progression and SPMS conversion.
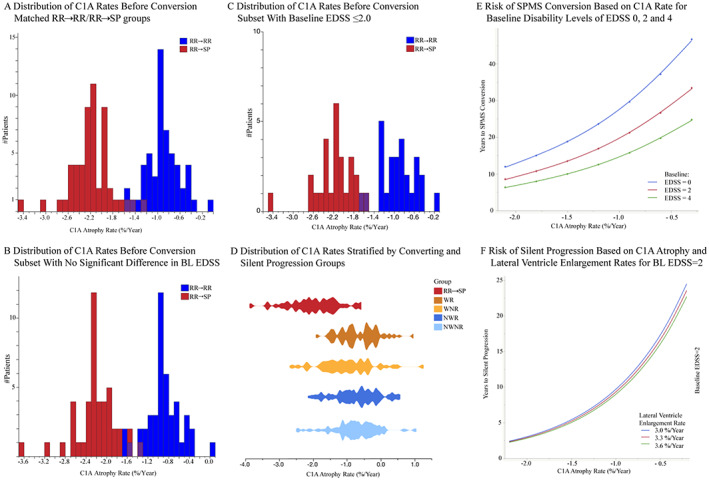
Results: Patients who developed SPMS showed faster cord atrophy rates (-2.19%/yr) at least 4 years before conversion compared to their RRMS matches (-0.88%/yr, p < 0.001). Spinal cord atrophy rates decelerated after conversion (-1.63%/yr, p = 0.010) towards those of SPMS patients from study entry (-1.04%). Each 1% faster spinal cord atrophy rate was associated with 69% (p < 0.0001) and 53% (p < 0.0001) shorter time to silent progression and SPMS conversion, respectively.
Interpretation: Silent progression and conversion to secondary progressive disease are predominantly related to cervical cord atrophy. This atrophy is often present from the earliest disease stages and predicts the speed of silent progression and conversion to Progressive MS. Diagnosis of SPMS is rather a late recognition of this neurodegenerative process than a distinct disease phase. ANN NEUROL 2022;91:268-281.
© 2021 The Authors. Annals of Neurology published by Wiley Periodicals LLC on behalf of American Neurological Association.
Conflict of interest statement
The following companies that have had financial relationships with authors manufacture disease modifying drugs for MS that were mentioned in this study: Bayer Schering, Biogen, EMD Serono, Genentech, Genzyme, F. Hoffmann‐La Roche Ltd, Mylan Pharmaceuticals, Novartis, Sanofi, Teva Pharmaceuticals.
R.M.B. has received personal compensation for medical legal consulting and for consulting or serving on the advisory boards of F. Hoffmann‐La Roche Ltd, Sanofi‐Genzyme, and Novartis.
J.M.G. reports consulting fees from Biogen and research support from Genentech. D.S.G. has received research support and given lectures on MS and its treatment that have been sponsored by Biogen Idec, Bayer Schering, Novartis, E.M.D. Serono, Genzyme, and Teva pharmaceuticals. J.S.G. reports personal fees from Novartis and Genentech and grants from Biogen, and E.M.D. Serono. A.J.G. reports personal fees from Mylan Pharmaceuticals, and grants from Novartis, and payments for serving on committees for Biogen and Novartis. E.W. has received research support from Novartis and Roche. MRW receives research support from Roche/Genentech. S.S.Z. has served as a consultant and received honoraria from Biogen‐Idec, EMD‐Serono, Genzyme, Novartis, Roche/Genentech, and Teva Pharmaceuticals, Inc., and has served on Data Safety Monitoring Boards for Teva. B.A.C.C. has received personal compensation for consulting from Biogen, E.M.D. Serono, and Novartis. R.G.H. received grants from Hoffmann La Roche, and consultancy honoraria from Roche/Genentech, Sanofi/Genzyme, and Novartis.
S.L.H. has received travel reimbursement and writing assistance from F. Hoffman‐La Roche Ltd. and Novartis Pharma.
A.G., A.B., N.P., A.K., A.R., G.K., J.M.M., X.Z., C.A., S.S., T.J.G., C.Z., W.A.S., E.C., Y.Z., R.G., N.R.R., A.S., A.H.Z., J.J., C.J.B., E.C. and J.R.O. have nothing to disclose.
Figures
Comment in
-
Reply to "Spinal Cord Atrophy Is a Preclinical Marker of Progressive MS".Ann Neurol. 2022 May;91(5):735-736. doi: 10.1002/ana.26340. Epub 2022 Mar 26. Ann Neurol. 2022. PMID: 35233827 Free PMC article. No abstract available.
-
Spinal Cord Atrophy Is a Preclinical Marker of Progressive MS.Ann Neurol. 2022 May;91(5):734-735. doi: 10.1002/ana.26341. Epub 2022 Mar 17. Ann Neurol. 2022. PMID: 35253269 No abstract available.
References
-
- Landtblom AM, Fazio P, Fredrikson S, Granieri E. The first case history of multiple sclerosis: Augustus d'Este (1794–1848). Neurol Sci. 2010;31:29–33. - PubMed
-
- Mc AD, Compston N. Some aspects of the natural history of disseminated sclerosis. Q J Med 1952;21:135–167. - PubMed
-
- Kremenchutzky M, Rice GP, Baskerville J, et al. The natural history of multiple sclerosis: a geographically based study 9: observations on the progressive phase of the disease. Brain 2006;129:584–594. - PubMed
Publication types
MeSH terms
Grants and funding
LinkOut - more resources
Full Text Sources
Other Literature Sources
