

Association of the VACS Index With Hospitalization Among People With HIV in the NA-ACCORD
- PMID: 34878432
- PMCID: PMC8665227
- DOI: 10.1097/QAI.0000000000002812
Association of the VACS Index With Hospitalization Among People With HIV in the NA-ACCORD
Abstract
Background: People with HIV (PWH) have a higher hospitalization rate than the general population. The Veterans Aging Cohort Study (VACS) Index at study entry well predicts hospitalization in PWH, but it is unknown if the time-updated parameter improves hospitalization prediction. We assessed the association of parameterizations of the VACS Index 2.0 with the 5-year risk of hospitalization.
Setting: PWH ≥30 years old with at least 12 months of antiretroviral therapy (ART) use and contributing hospitalization data from 2000 to 2016 in North American AIDS Cohort Collaboration on Research and Design (NA-ACCORD) were included. Three parameterizations of the VACS Index 2.0 were assessed and categorized by quartile: (1) "baseline" measurement at study entry; (2) time-updated measurements; and (3) cumulative scores calculated using the trapezoidal rule.
Methods: Discrete-time proportional hazard models estimated the crude and adjusted associations (and 95% confidence intervals [CIs]) of the VACS Index parameterizations and all-cause hospitalizations. The Akaike information criterion (AIC) assessed the model fit with each of the VACS Index parameters.
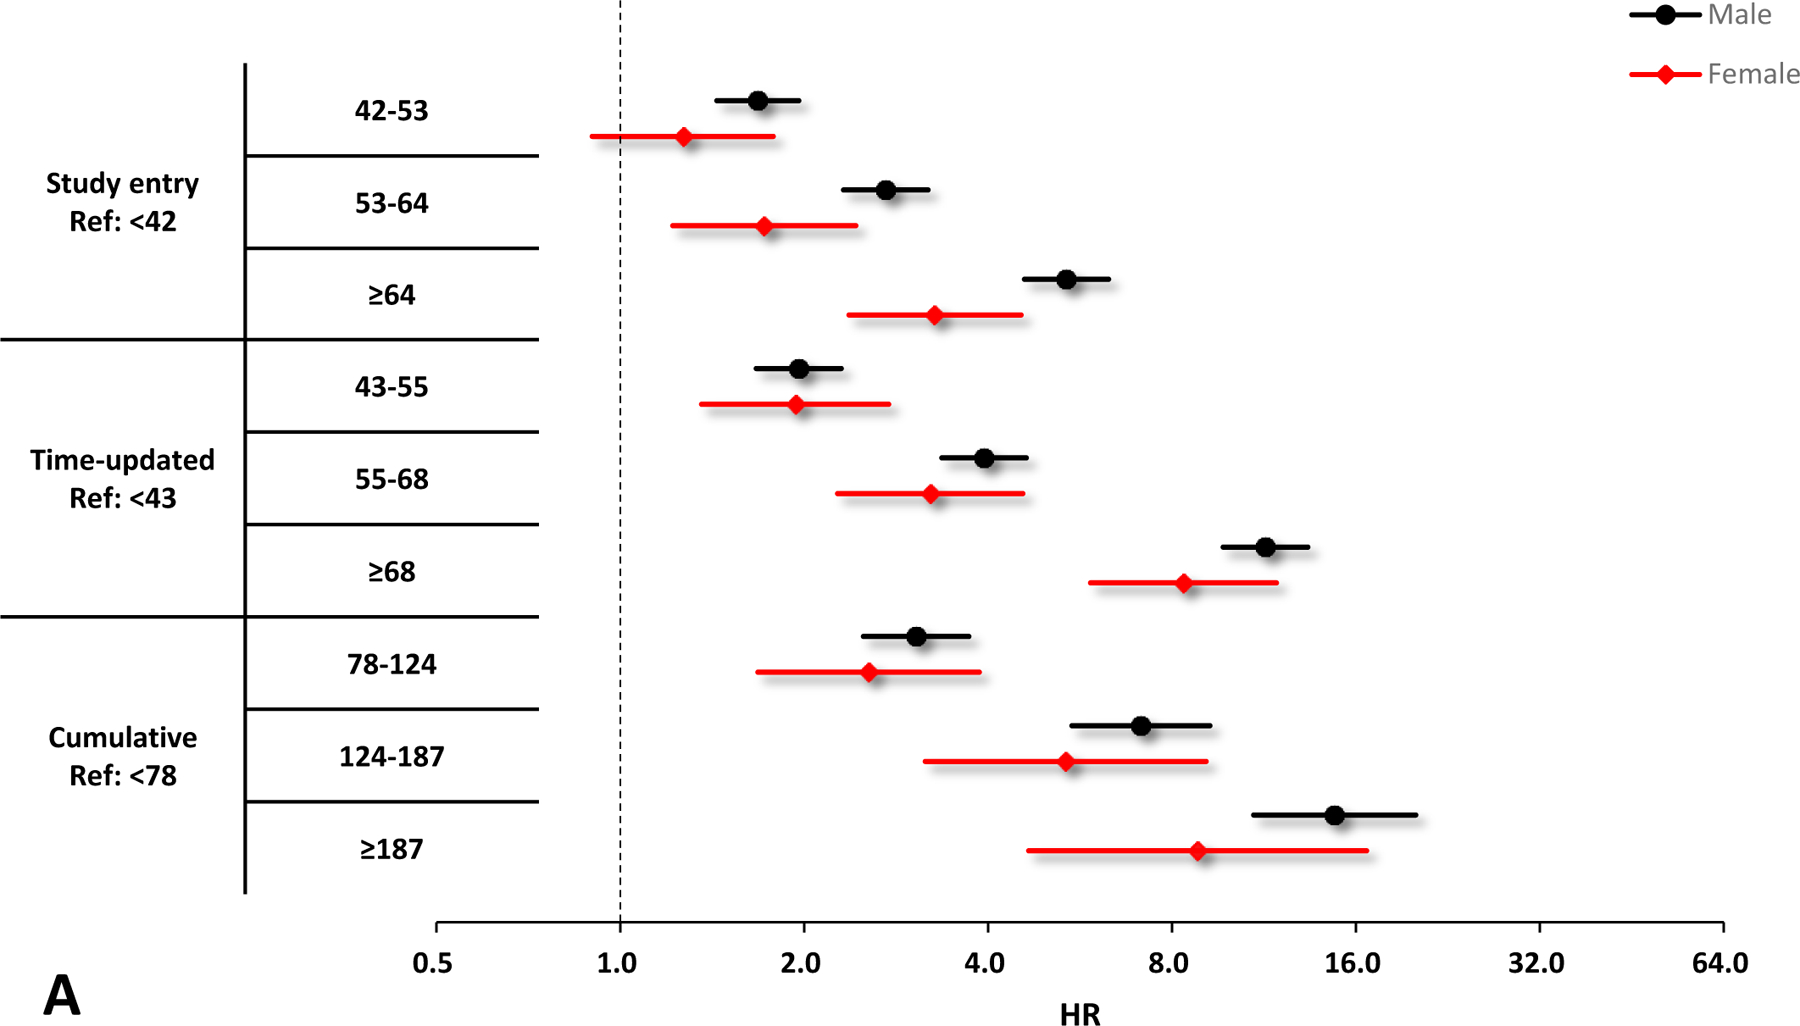
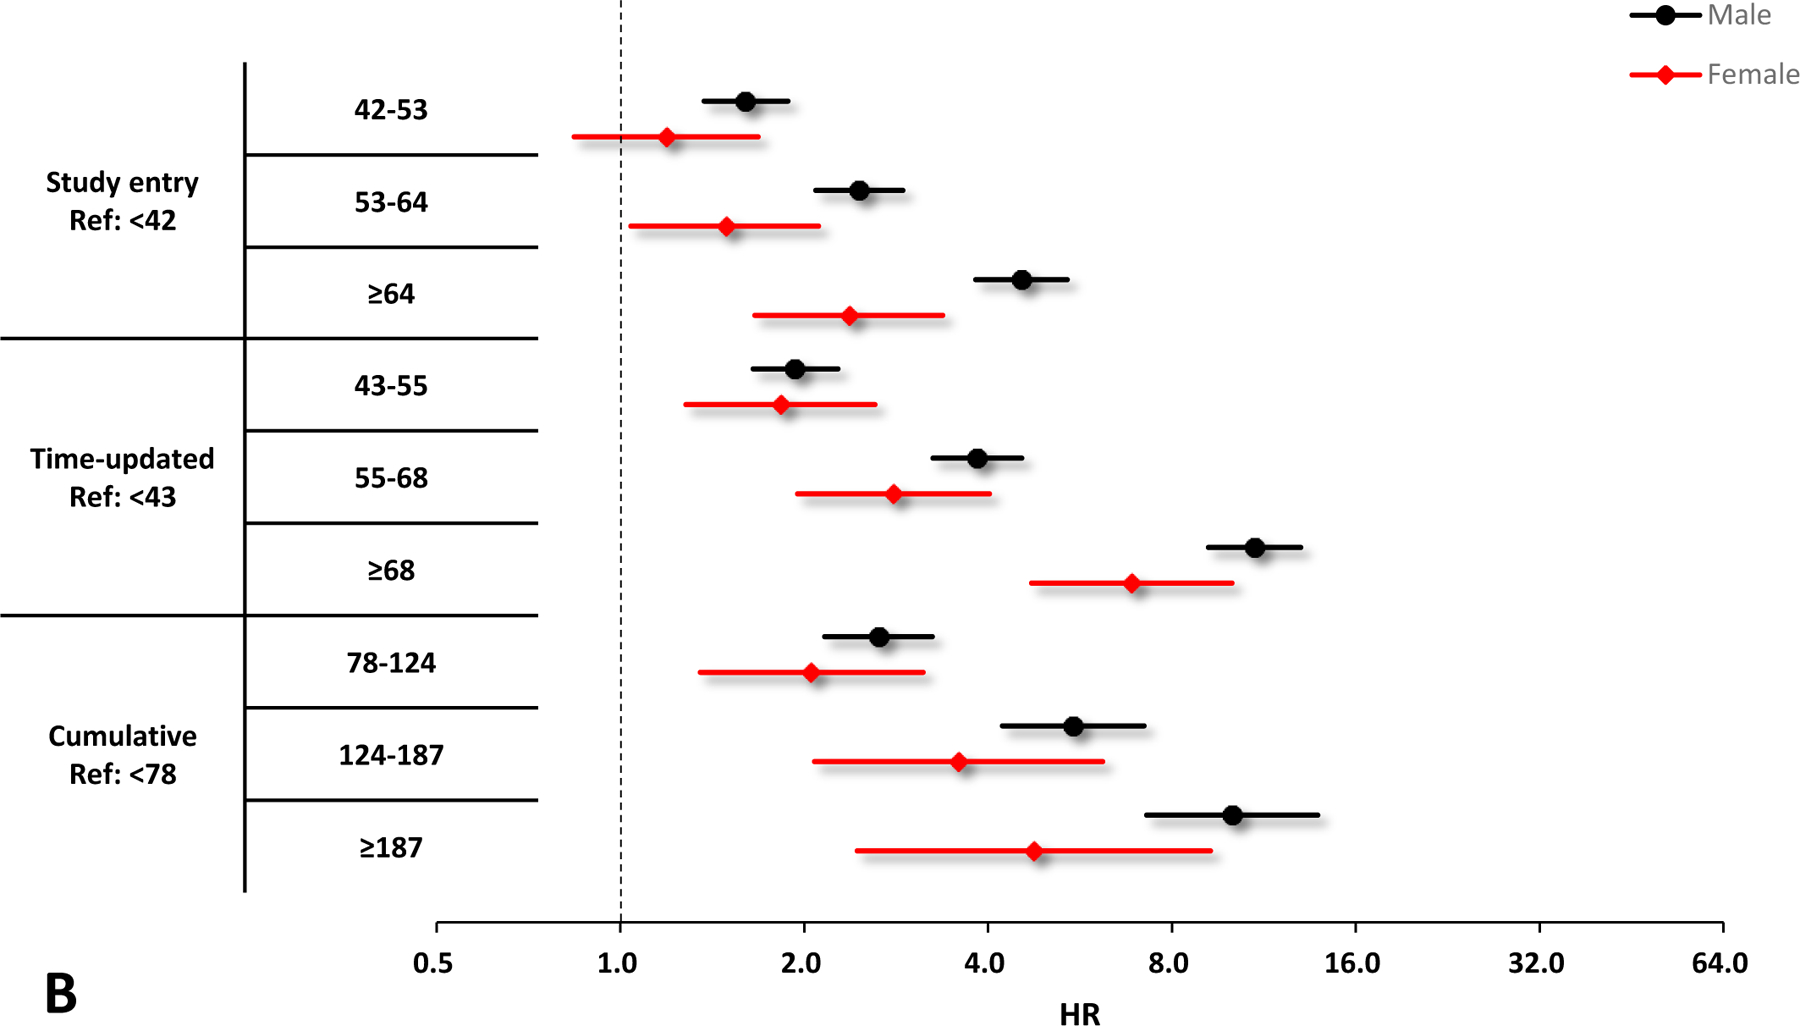
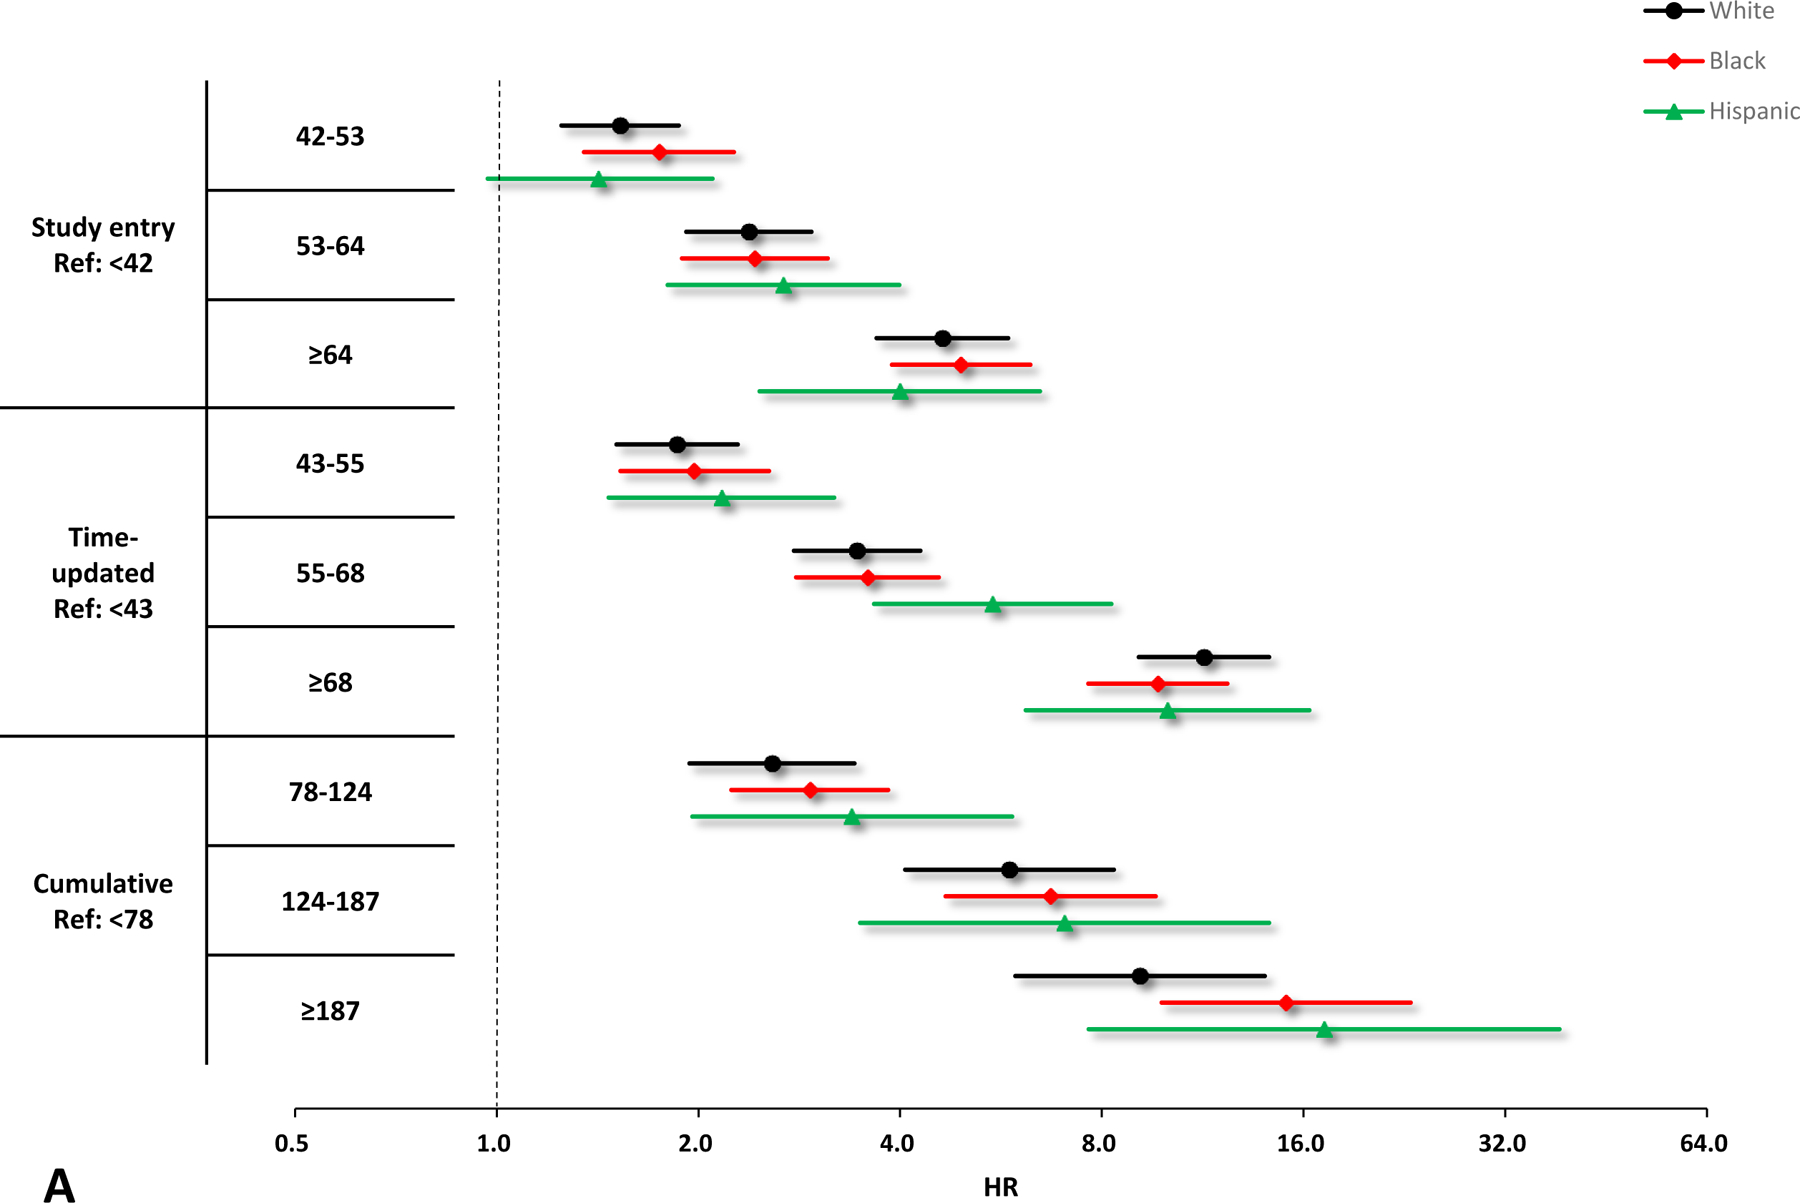
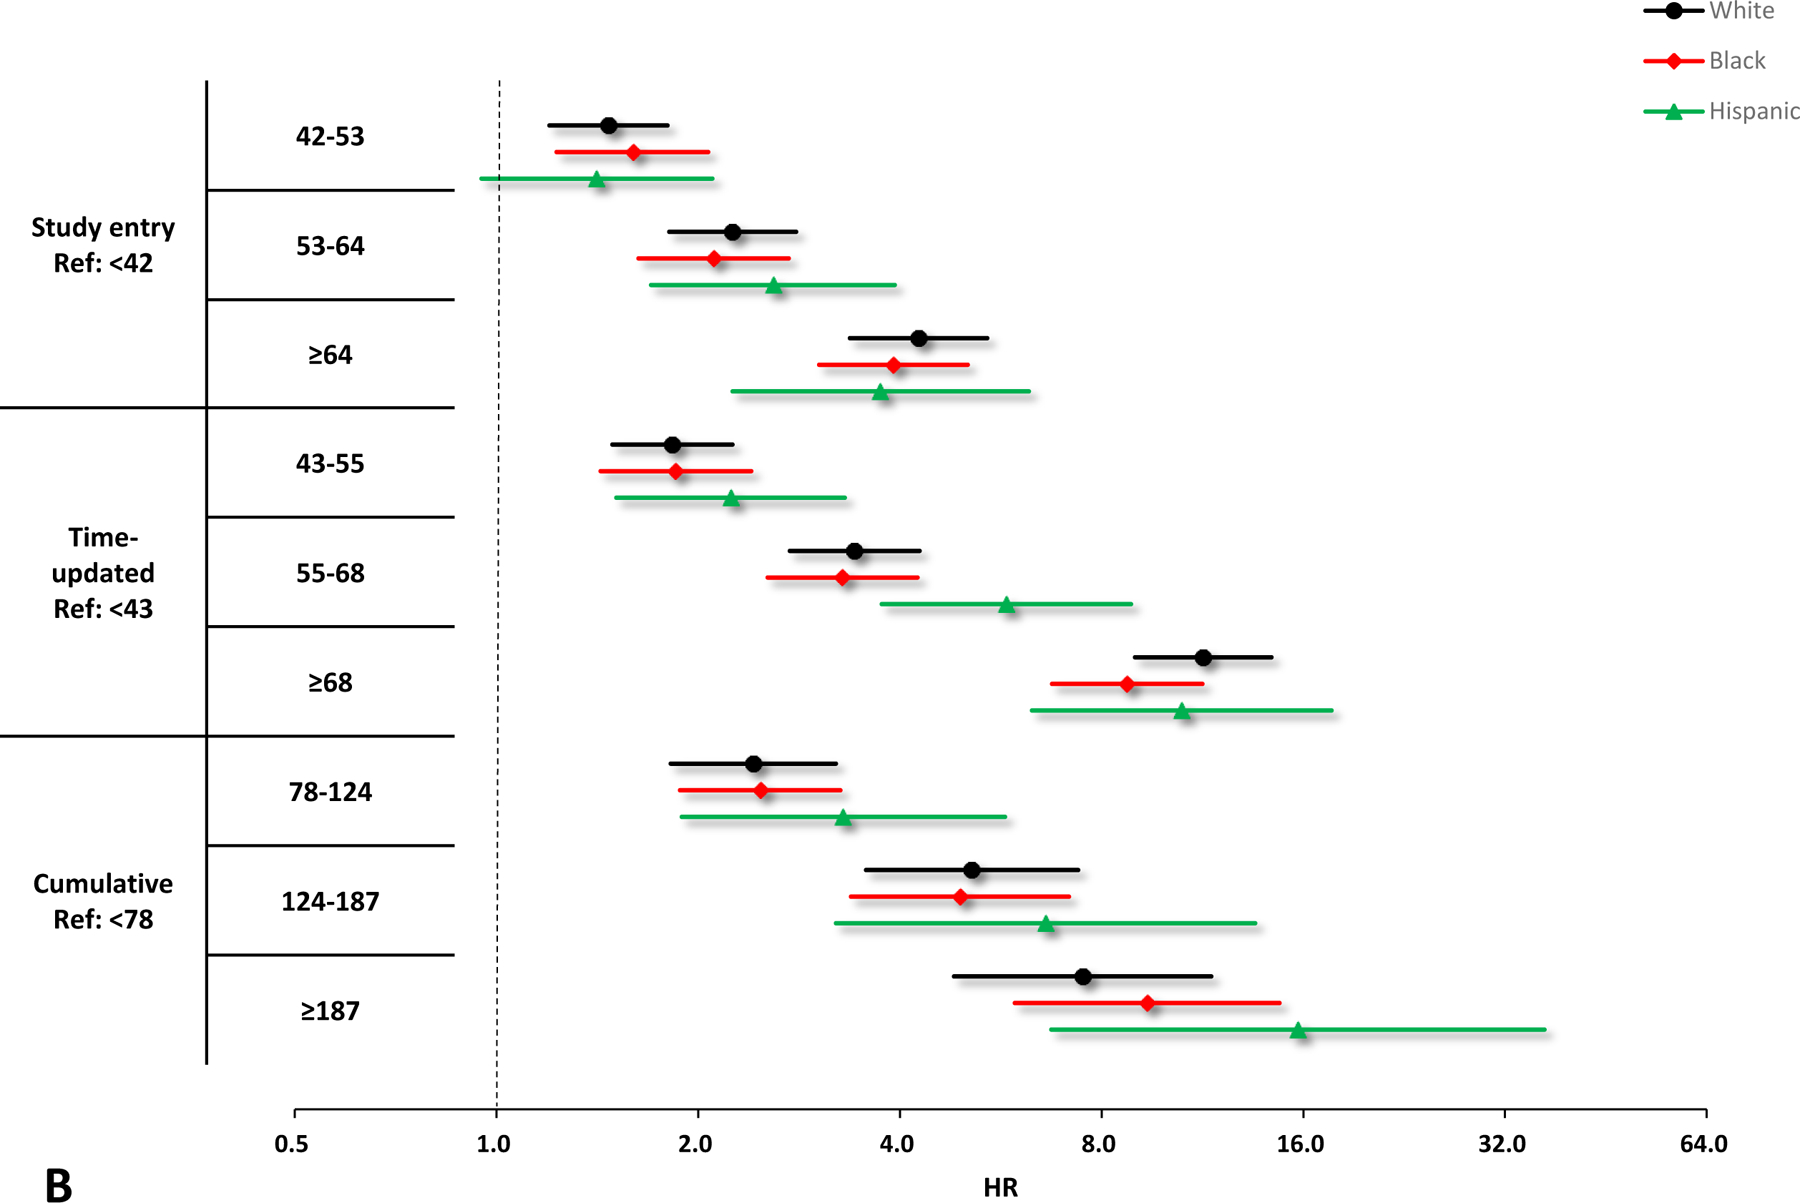
Results: Among 7289 patients, 1537 were hospitalized. Time-updated VACS Index fitted hospitalization best with a more distinct dose-response relationship [score <43: reference; score 43-55: aHR = 1.93 (95% CI: 1.66 to 2.23); score 55-68: aHR = 3.63 (95% CI: 3.12 to 4.23); score ≥68: aHR = 9.98 (95% CI: 8.52 to 11.69)] than study entry and cumulative VACS Index after adjusting for known risk factors.
Conclusions: Time-updated VACS Index 2.0 had the strongest association with hospitalization and best fit to the data. Health care providers should consider using it when assessing hospitalization risk among PWH.
Copyright © 2021 Wolters Kluwer Health, Inc. All rights reserved.
Conflict of interest statement
The authors have no conflicts of interest to disclose.
Figures
References
-
- Smith CJ, Ryom L, Weber R, et al. Trends in underlying causes of death in people with HIV from 1999 to 2011 (D:A:D): a multicohort collaboration. The Lancet. 2014;384(9939):241–248. - PubMed
Publication types
MeSH terms
Grants and funding
- R01 DA011602/DA/NIDA NIH HHS/United States
- K23 EY013707/EY/NEI NIH HHS/United States
- U54 GM133807/GM/NIGMS NIH HHS/United States
- U01 AI038855/AI/NIAID NIH HHS/United States
- U01 HL146208/HL/NHLBI NIH HHS/United States
- UL1 RR024131/RR/NCRR NIH HHS/United States
- U01 HL146192/HL/NHLBI NIH HHS/United States
- U01 AI069432/AI/NIAID NIH HHS/United States
- HCP-97105/CIHR/Canada
- U01 AA020790/AA/NIAAA NIH HHS/United States
- KL2 TR000421/TR/NCATS NIH HHS/United States
- K01 AI131895/AI/NIAID NIH HHS/United States
- F31 DA037788/DA/NIDA NIH HHS/United States
- U01 HL146241/HL/NHLBI NIH HHS/United States
- R01 AA016893/AA/NIAAA NIH HHS/United States
- N01 CP001004/CP/NCI NIH HHS/United States
- P30 AI027767/AI/NIAID NIH HHS/United States
- U01 DA036297/DA/NIDA NIH HHS/United States
- P30 AI050409/AI/NIAID NIH HHS/United States
- U01 HL146333/HL/NHLBI NIH HHS/United States
- F31 AI124794/AI/NIAID NIH HHS/United States
- P30 MH062246/MH/NIMH NIH HHS/United States
- U01 AI069434/AI/NIAID NIH HHS/United States
- TGF-96118/CIHR/Canada
- Z01 CP010176/ImNIH/Intramural NIH HHS/United States
- U54 AG062334/AG/NIA NIH HHS/United States
- P30 AI094189/AI/NIAID NIH HHS/United States
- U01 HL146245/HL/NHLBI NIH HHS/United States
- UM1 AI069432/AI/NIAID NIH HHS/United States
- G12 MD007583/MD/NIMHD NIH HHS/United States
- K24 DA000432/DA/NIDA NIH HHS/United States
- U01 DA036935/DA/NIDA NIH HHS/United States
- CBR-94036/CIHR/Canada
- U01 HL146205/HL/NHLBI NIH HHS/United States
- R24 AI067039/AI/NIAID NIH HHS/United States
- U01 HL146242/HL/NHLBI NIH HHS/United States
- U01 AI038858/AI/NIAID NIH HHS/United States
- U10 EY008057/EY/NEI NIH HHS/United States
- U01 AI068636/AI/NIAID NIH HHS/United States
- U01 HL146201/HL/NHLBI NIH HHS/United States
- R21 AG059505/AG/NIA NIH HHS/United States
- U01 HL146193/HL/NHLBI NIH HHS/United States
- U10 EY008052/EY/NEI NIH HHS/United States
- P30 AI110527/AI/NIAID NIH HHS/United States
- R34 DA045592/DA/NIDA NIH HHS/United States
- P30 AI027763/AI/NIAID NIH HHS/United States
- K01 AI093197/AI/NIAID NIH HHS/United States
- U01 AI069918/AI/NIAID NIH HHS/United States
- K24 AI118591/AI/NIAID NIH HHS/United States
- UL1 TR002378/TR/NCATS NIH HHS/United States
- CBR-86906/CIHR/Canada
- K24 AI065298/AI/NIAID NIH HHS/United States
- U01 AA013566/AA/NIAAA NIH HHS/United States
- N02 CP055504/CP/NCI NIH HHS/United States
- UL1 TR000083/TR/NCATS NIH HHS/United States
- P30 AI027757/AI/NIAID NIH HHS/United States
- U01 HL146204/HL/NHLBI NIH HHS/United States
- R01 DA012568/DA/NIDA NIH HHS/United States
- U01 HL146202/HL/NHLBI NIH HHS/United States
- UL1 TR000004/TR/NCATS NIH HHS/United States
- U01 HL146240/HL/NHLBI NIH HHS/United States
- R01 AG053100/AG/NIA NIH HHS/United States
- U10 EY008067/EY/NEI NIH HHS/United States
- P30 AI036219/AI/NIAID NIH HHS/United States
- U01 HL146194/HL/NHLBI NIH HHS/United States
- U24 AA020794/AA/NIAAA NIH HHS/United States
- U01 HL146203/HL/NHLBI NIH HHS/United States
- U01 AI068634/AI/NIAID NIH HHS/United States
- P30 AI050410/AI/NIAID NIH HHS/United States
LinkOut - more resources
Full Text Sources
Medical
