. 2022 Jan 1;89(1):49-55.
doi: 10.1097/QAI.0000000000002821.

Forecasting HIV-1 Genetic Cluster Growth in Illinois,United States

Affiliations

Forecasting HIV-1 Genetic Cluster Growth in Illinois,United States

Manon Ragonnet-Cronin et al. J Acquir Immune Defic Syndr. .

Abstract

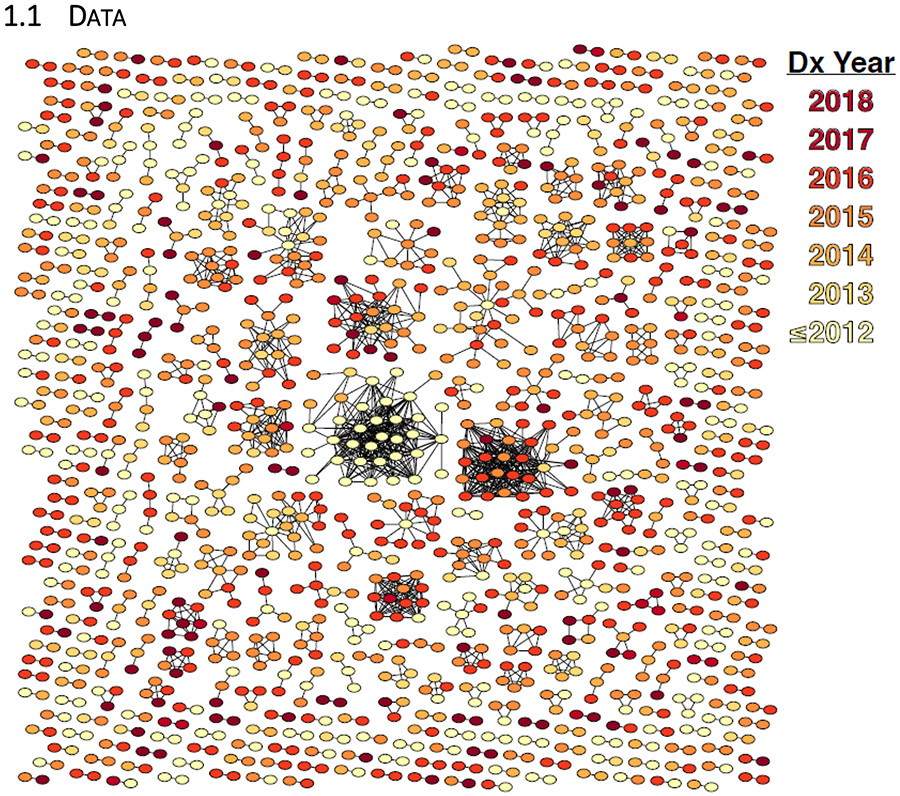
Background: HIV intervention activities directed toward both those most likely to transmit and their HIV-negative partners have the potential to substantially disrupt HIV transmission. Using HIV sequence data to construct molecular transmission clusters can reveal individuals whose viruses are connected. The utility of various cluster prioritization schemes measuring cluster growth have been demonstrated using surveillance data in New York City and across the United States, by the Centers for Disease Control and Prevention (CDC).

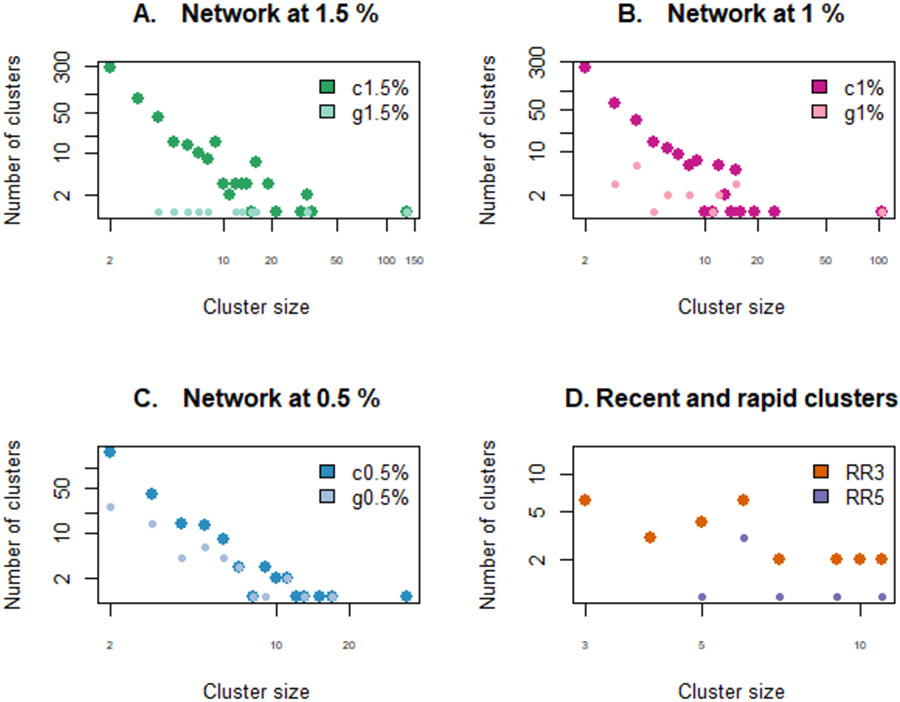
Methods: We examined clustering and cluster growth prioritization schemes using Illinois HIV sequence data that include cases from Chicago, a large urban center with high HIV prevalence, to compare their ability to predict future cluster growth.

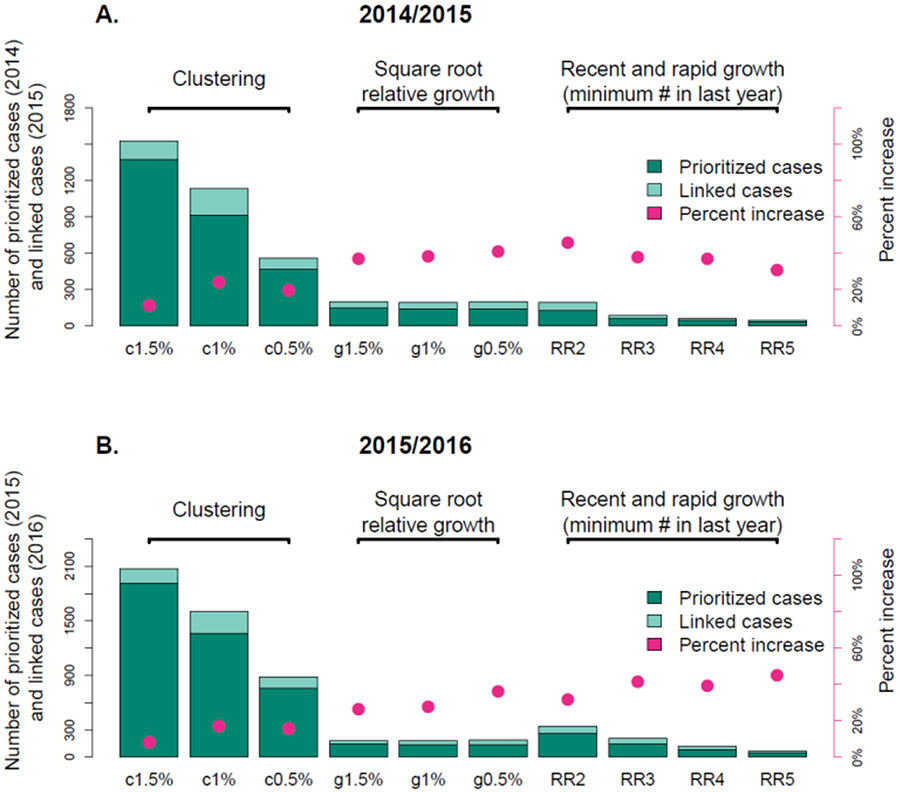
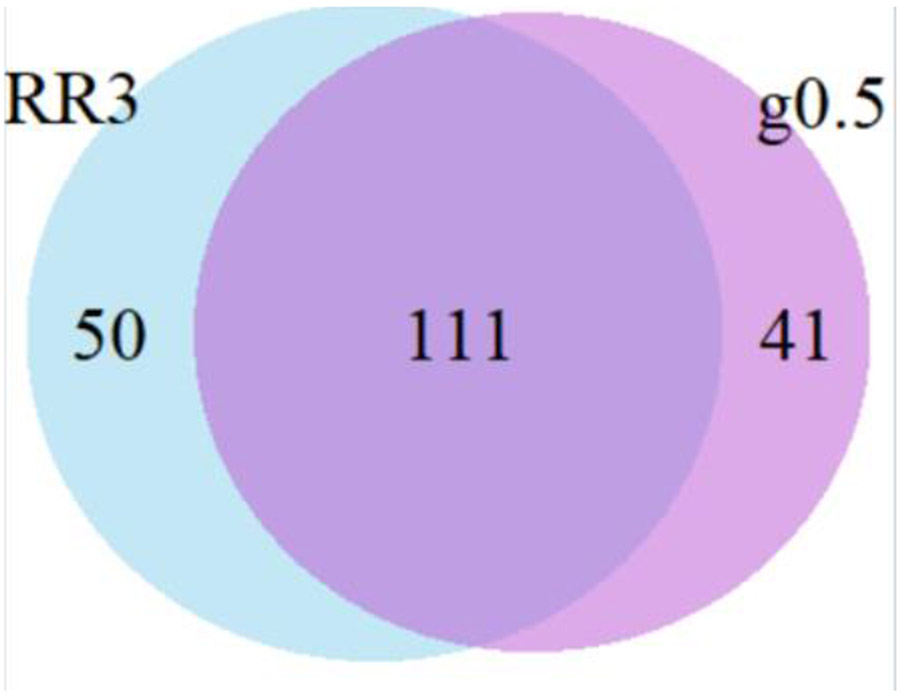
Results: We found that past cluster growth was a far better predictor of future cluster growth than cluster membership alone but found no substantive difference between the schemes used by CDC and the relative cluster growth scheme previously used in New York City (NYC). Focusing on individuals selected simultaneously by both the CDC and the NYC schemes did not provide additional improvements.

Conclusion: Growth-based prioritization schemes can easily be automated in HIV surveillance tools and can be used by health departments to identify and respond to clusters where HIV transmission may be actively occurring.


Conflict of interest statement

J.O.W. received funding from Gilead Sciences, LLC, as a grant paid to his institution. The remaining authors have no conflicts of interest to disclose.

Figures

Figure 1:
Figure 1:
HIV-1 molecular transmission clusters in Illinois. Individuals are represented by a node in the network if they were linked to at least one other person at a genetic distance ≤0.5%.
Figure 2:
Figure 2:
Cluster size distribution for each prioritization scheme in year 2015. All axes are log scales. (A.) Clusters with high growth at 1.5% (g1.5%) are a subset of clusters at 1.5% (c1.5%), and the same holds for (B.) 1% and (C.) 0.5%. RR5 clusters are a subset of RR4 clusters, themselves a subset of RR3 clusters, themselves a subset of RR2 clusters. Different distributions are shown with different sized characters for visibility of overlapping data points. Cluster prioritization schemes are defined in Table 1.
Figure 3:
Figure 3:
Number of prioritized (dark green) and linked (pale green) cases and percent increase (pink) for each cluster prioritization scheme for years (A.) 2014/2015 and (B.) 2015/2016. Note that the number of individuals prioritized in the cluster growth schemes is determined by the number of individuals in category RR3 (150). Cluster prioritization schemes are defined in Table 1.
Figure 4:
Figure 4:
Overlap between individuals selected under two prioritization schemes: clusters with high growth at 0.5% (g0.5%) and recent and rapid clusters with at least 3 diagnoses in the previous year (RR3). Note that the number of individuals selected under the growth schemes was determined based on the number of individuals in the RR3 group (~150), but the RR3 group can only include individuals diagnosed within the previous three years.

References

    1. Jones JH, Handcock MS. An assessment of preferential attachment as a mechanism for human sexual network formation. Proceedings of the Royal Society B-Biological Sciences. 2003;270(1520):1123–1128. - PMC - PubMed
    1. Newman ME. Spread of epidemic disease on networks. Phys Rev E Stat Nonlin Soft Matter Phys. 2002;66(1 Pt 2):016128. - PubMed
    1. Little SJ, Kosakovsky Pond SL, Anderson CM, et al. Using HIV networks to inform real time prevention interventions. PLoS One. 2014;9(6):e98443. - PMC - PubMed
    1. Peters PJ, Pontones P, Hoover KW, et al. HIV Infection Linked to Injection Use of Oxymorphone in Indiana, 2014-2015. N Engl J Med. 2016;375(3):229–239. - PubMed
    1. Ragonnet-Cronin M, Jackson C, Bradley-Stewart A, et al. Recent and Rapid Transmission of HIV Among People Who Inject Drugs in Scotland Revealed Through Phylogenetic Analysis. J Infect Dis. 2018;217(12):1875–1882. - PMC - PubMed

Publication types