. 2022 Apr;22(4):1073-1087.
doi: 10.1111/ajt.16912. Epub 2022 Feb 4.

Cytoskeletal protein degradation in brain death donor kidneys associates with adverse posttransplant outcomes

Affiliations

Cytoskeletal protein degradation in brain death donor kidneys associates with adverse posttransplant outcomes

Rebecca H Vaughan et al. Am J Transplant. 2022 Apr.

Abstract

In brain death, cerebral injury contributes to systemic biological dysregulation, causing significant cellular stress in donor kidneys adversely impacting the quality of grafts. Here, we hypothesized that donation after brain death (DBD) kidneys undergo proteolytic processes that may deem grafts susceptible to posttransplant dysfunction. Using mass spectrometry and immunoblotting, we mapped degradation profiles of cytoskeletal proteins in deceased and living donor kidney biopsies. We found that key cytoskeletal proteins in DBD kidneys were proteolytically cleaved, generating peptide fragments, predominantly in grafts with suboptimal posttransplant function. Interestingly, α-actinin-4 and talin-1 proteolytic fragments were detected in brain death but not in circulatory death or living donor kidneys with similar donor characteristics. As talin-1 is a specific proteolytic target of calpain-1, we investigated a potential trigger of calpain activation and talin-1 degradation using human ex vivo precision-cut kidney slices and in vitro podocytes. Notably, we showed that activation of calpain-1 by transforming growth factor-β generated proteolytic fragments of talin-1 that matched the degradation fragments detected in DBD preimplantation kidneys, also causing dysregulation of the actin cytoskeleton in human podocytes; events that were reversed by calpain-1 inhibition. Our data provide initial evidence that brain death donor kidneys are more susceptible to cytoskeletal protein degradation. Correlation to posttransplant outcomes may be established by future studies.

Keywords: QUOD biobank; basic (laboratory) research/science; cellular biology; donors and donation: donation after brain death (DBD); glomerular biology and disease; kidney (allograft) function/dysfunction; kidney failure/injury; kidney transplantation/nephrology; organ transplantation in general; proteomics; translational research/science.


Figures

FIGURE 1
FIGURE 1
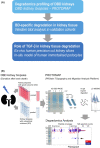
Experimental and technical workflows used in this study. (A) Study design. We first studied the degradation profiles of DBD kidneys that had contrasting 12‐month posttransplant outcomes; either suboptimal (SO) or good allograft (GO) function. We applied the PROtein TOpography and Migration Analysis Platform (PROTOMAP) in kidney biopsies that were obtained from the QUOD biobank. The analysis shortlisted eight cytoskeletal proteins that were proteolytically cleaved in SO DBD kidneys. Western blotting on a validation cohort of deceased (DBD and DCD) and living donor (LD) kidney biopsies showed brain death–specific degradation patterns. To explain the degradation profiles, we tested the role of TGF‐β in kidney tissue degradation by employing an ex vivo model of precision‐cut human kidney slices and an in vitro model of human podocyte cells; (B) Description of the PROtein TOpography Migration Analysis Platform (PROTOMAP) workflow. DBD kidney biopsy protein homogenates were first separated by SDS‐electrophoresis, divided into 224 horizontal sections and subsequently analyzed by LC–MS/MS. Bioinformatics analysis combined data from the gel electrophoresis and mass spectrometry spectra to generate peptographs that provided information on degradation profiles of the intact protein and the generated fragments. The resulting peptographs were screened to identify proteins with evidence of endogenous proteolysis and generation of fragment intermediates at a lower molecular weight than the full length. The selection of proteins for further analysis was based on the following factors: (i) increased spectral counts of fragments that had migrated at a lower molecular mass in SO (blue bars) versus GO (red bars), (ii) enrichment of the intact protein or protein fragments in the SO group and (iii) biological relevance, with an emphasis on cytoskeletal proteins
FIGURE 2
FIGURE 2
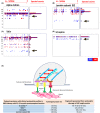
Mapping the generation of protein fragments using PROTOMAP analysis of kidney biopsies. Arrows show the protein fragments detected in lower molecular weight generated from the full‐length protein. Blue depicts suboptimal outcome (SO) kidneys and red depicts good outcome (GO) kidneys. Peptographs depict proteins shortlisted from the PROTOMAP analysis of DBD kidneys with GO (red bars) pooled n = 5; compared to biopsies obtained from DBD kidneys with SO (blue bars) pooled n = 5. Degradation profiles (noted with the arrow) from N terminus to C terminus of α‐actinin (A), laminin β2 (B), talin (C), utrophin (D). (E) Podocyte schematic showing intracellular actin filaments linked to α‐actinin‐4 (ACTN4), synaptopodin (SYNPO), utrophin, talin, and through Integrins with intertwined laminin β2 podocyte connected to the podocyte basement membrane (peptographs of Integrin and synaptopodin listed in SF2). The table shows the full length and fragments identified from PROTOMAP analysis. As α‐actinin‐1/‐4 isoforms and talin‐1/‐2 isoforms share 85% and 76% homology we included both isoforms of each protein in the analysis. *Indicates the full‐length protein. ^Indicates that α‐actinin and talin were validated by western blot on an independent cohort of biopsies and the association of the degradomics profiles to protein isoforms of α‐actinin‐4 and talin‐1 were confirmed. (The separate protein isoform peptographs of α‐actinin and talin in addition to the rest of the peptographs are displayed in Figure S2)
FIGURE 3
FIGURE 3
α‐Actinin‐4 proteolytic profile is specific to DBD kidneys and associates to posttransplant outcome. (A) Western blot analysis of donor kidney biopsies from n = 10 DBD with suboptimal outcome (SO: 12‐month eGFR (±SD) 31 ± 9 ml/min/1.73 m2), n = 10 DBD with good outcome (GO: 12‐month mean eGFR (±SD) 82 ± 22 ml/min/1.73 m2), n = 10 DCD with SO (12‐month mean eGFR (±SD) 29 ± 9 ml/min/1.73 m2 n = 10 DCD with GO 12‐month mean eGFR (±SD) 77 ± 17 ml/min/1.73 m2, and biopsies from n = 10 LD (12‐month eGFR (±SD) 69 ± 10 ml/min/1.73 m2) shows that the degradation of α‐actinin‐4 is specific to DBD kidneys while DCD and LD kidneys show no evidence of degradation. α‐Actinin‐4 shows a distinct profile of fragments generated between 90 and 70 kDa and between 40 and 30 kDa. (B) The ratio of total fragment intensities (normalized to GAPDH) to the full‐length protein (105 KDa) shows that the proteolytic processing of the DBD kidneys with SO is significantly different to DBD GO (means ± SEM, *< .05), the DBD SO is significantly different to DCD SO and LD (means ± SEM, *< .05; ***< .001) while there was no difference in the degradation pattern between DCD and LD
FIGURE 4
FIGURE 4
Talin‐1 proteolytic profile is specific to DBD kidneys and associates to posttransplant outcome. (A) Western blot of donor kidney biopsies from n = 10 DBD with suboptimal outcome (SO: 12‐month eGFR [±SD] 31 ± 9 ml/min/1.73 m2), n = 10 DBD with good outcome (GO: 12‐month mean eGFR [±SD] 82 ± 22 ml/min/1.73 m2), n = 10 DCD with SO (12‐month mean eGFR [±SD] 29 ± 9 ml/min/1.73 m2), n = 10 DCD with GO (12‐month mean eGFR [±SD] 77 ± 17 ml/min/1.73 m2), and biopsies from n = 10 LD (12‐month eGFR [±SD] 69 ± 10 ml/min/1.73 m2) shows that the degradation of talin is specific to DBD kidneys. A fragment at 125 kDa is clearly increased with the degradation of the full‐length talin protein at 270 kDa in the DBD kidneys. An additional fragment at 100 kDa was also observed in the DBD SO kidney. The 125‐kDa fragment was detected in the DCD and LD kidneys also however in both donor groups the full‐length protein was clearly distinct. (B) The ratio of total fragment intensities (normalized to GAPDH) to the full‐length protein (270 kDa) shows that the proteolytic processing of the DBD kidneys with SO is significantly different to DBD GO (means ± SEM, **< .01), the DBD SO is significantly different to DCD SO and LD (means ± SEM, ****< .0001) while there was no difference in the degradation rates between DCD and LD. (C) Talin consists of an N‐terminal head and a flexible rod. The head and rod are joined by a linker region that is cleaved by calpain
FIGURE 5
FIGURE 5
Calpain‐1 peptidomic profile reveals enhanced enzymatic activation in suboptimal outcome DBD kidneys. (A) PROTOMAP analysis showed the generation of a number of fragments in DBD suboptimal outcome (SO) donor groups and the generation of a unique fragment at around 18 KDa in SO donor kidney biopsies. (B) Western blot analysis of donor kidney biopsies from n = 10 DBD with SO (12‐month eGFR [±SD] 31 ± 9 ml/min/1.73 m2), n = 10 DBD with good outcome (GO; 12‐month mean eGFR [±SD] 82 ± 22 ml/min/1.73 m2) showed distinct peptidomic profiles that included the generation of protein fragments increased at around ~50 kDa (C), ~40 kDa (D), ~30 kDa (E), and of a unique 18‐kDa fragment (F) in SO when compared to GO DBD kidneys (means ± SEM, *p < .05; t‐test). Band intensities were normalized against GAPDH
FIGURE 6
FIGURE 6
TGF‐β treatment of human precision‐cut kidney slice (PCKSs) increases calpain activity and caused pro‐fibrotic morphological changes. (A) PCKSs stimulation with TGF‐β (10 ng/ml) up to 24 h caused the kidney slices to develop pro‐fibrotic morphological changes detected by Sirius red (top) and Masson's Trichrome staining (bottom). 20 × magnification and 20 µm scale bar. (B) Calpain‐1 activity significantly (means ± SEM, **p < .01; paired t‐test) increased in PCKSs treated with TGF‐β up to 24 h
FIGURE 7
FIGURE 7
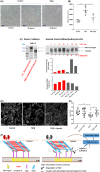
TGF‐β treatment of human immortalized podocyte cells triggers calpain activation, actin cytoskeleton dysregulation and cytoskeletal talin degradation. (A) Representative contrast microscopy images showing changes to podocyte cells morphology when treated by TGF‐β (10 ng/ml) for up to 24 h; 20× magnification, scale bar is 100 µm. (B) Calpain activity of podocyte cells was significantly increased following stimulation with TGF‐β (10 ng/ml) up to 24 h when compared to control (****p < .0001; t‐test). Treatment of cells with calpeptin (1 µM) prior to and during TGF‐β stimulation significantly reduced calpain activation (**p < .01; t‐test). (C) The degradation pattern of talin‐1 of suboptimal DBD kidneys compared to LD kidney with good outcome showed the generation of ~125‐kDa fragment (cropped western blot presenting donor kidneys probed with anti‐talin‐1 was derived from data presented in Figure 4A). In vitro human kidney podocyte cells stimulated with TGF‐β (0‐20 ng/ml, up to 24 h) showed a dose responsive loss of the talin full‐length protein. Talin‐1 proteolytic fragments were detected as ~190‐ and ~125‐kDa bands with a further lower intensity band at ~100 kDa. The generation of these fragments was reduced when podocytes were treated with calpain inhibitor calpeptin (1 µM) prior to and during TGF‐β treatment. The two histograms show the alterations (fold changes) in the band intensities of the talin‐1 main band and the 125‐kDa fragment following treatment of podocytes with TGF‐β in the absence (red bars) and presence of calpain‐1 inhibitor calpeptin (gray bars). (D) Phalloidin staining of actin stress fibers in cultured conditionally immortalized podocytes in response to TGF‐β (10 ng/ml) and calpeptin (1 µM) treatments (three technical replicates). (E) TGF‐β treatment (10 ng/ml) decreased the length of actin fibers (**p < .01; t‐test) indicating dysregulation of the actin cytoskeleton. This loss of stress fiber area was recovered by treating cells with 1 µM calpeptin alongside the TGF‐β treatment (*p < .05; t‐test). 10× magnification and 20 µm scale bar. (F) Schematic representation of the podocyte cytoskeletal matrix of healthy and after brain death kidney; brain stem death increases TGF‐β triggering the activation of calpain‐1 and subsequent degradation of cytoskeletal talin‐1 affecting the integrity of actin cytoskeleton in the kidneys with suboptimal posttransplant function

References

    1. Oniscu GC, Ravanan R, Wu D, et al. Access to Transplantation and Transplant Outcome Measures (ATTOM): study protocol of a UK wide, in‐depth, prospective cohort analysis. BMJ Open. 2016;6(2):e010377. doi:10.1136/bmjopen-2015-010377 - DOI - PMC - PubMed
    1. Oniscu GC, Brown H, Forsythe JLR. Impact of cadaveric renal transplantation on survival in patients listed for transplantation. J Am Soc Nephrol. 2005;16(6):1859–1865. doi:10.1681/ASN.2004121092 - DOI - PubMed
    1. Axelrod DA, Schnitzler MA, Xiao H, et al. An economic assessment of contemporary kidney transplant practice. Am J Transplant. 2018;18(5):1168–1176. doi:10.1111/ajt.14702 - DOI - PubMed
    1. Burton H, Iyamu Perisanidou L, Steenkamp R, et al. Causes of renal allograft failure in the UK: trends in UK renal registry and national health service blood and transplant data from 2000 to 2013. Nephrol Dial Transplant. 2018;34(2):355–364. doi:10.1093/ndt/gfy168 - DOI - PubMed
    1. Westendorp WH, Leuvenink HG, Ploeg RJ. Brain death induced renal injury. Curr Opin Organ Transplant. 2011;16:151–156. doi:10.1097/MOT.0b013e328344a5dc - DOI - PubMed

Publication types

Substances