

Transcriptome Analysis of Pseudomonas aeruginosa Biofilm Infection in an Ex Vivo Pig Model of the Cystic Fibrosis Lung
- PMID: 34878811
- PMCID: PMC8824274
- DOI: 10.1128/AEM.01789-21
Transcriptome Analysis of Pseudomonas aeruginosa Biofilm Infection in an Ex Vivo Pig Model of the Cystic Fibrosis Lung
Abstract
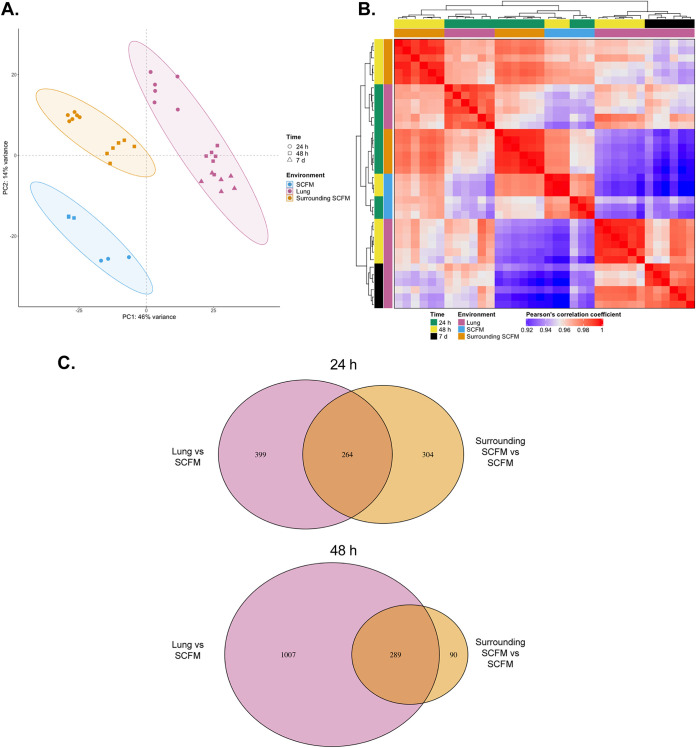
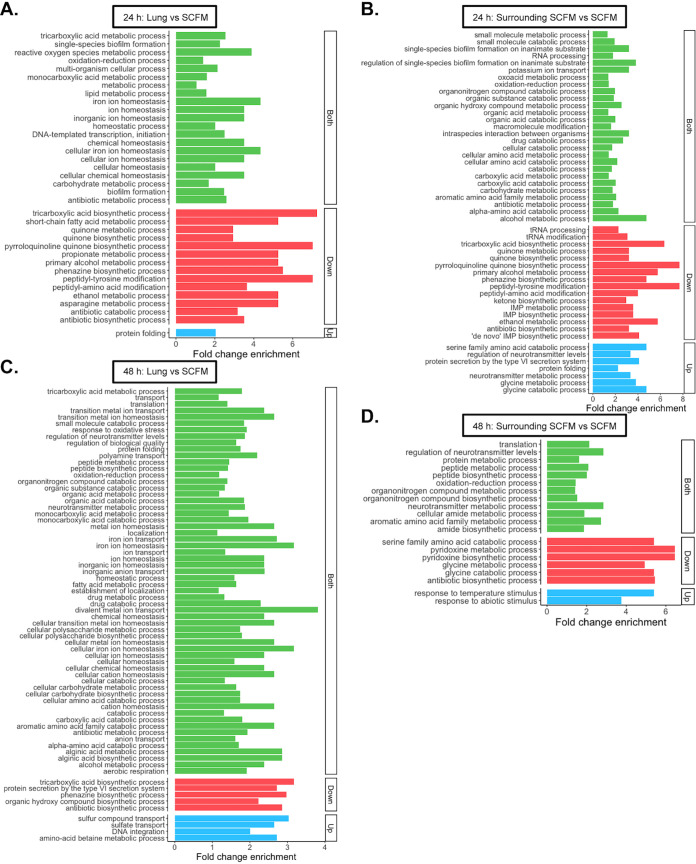
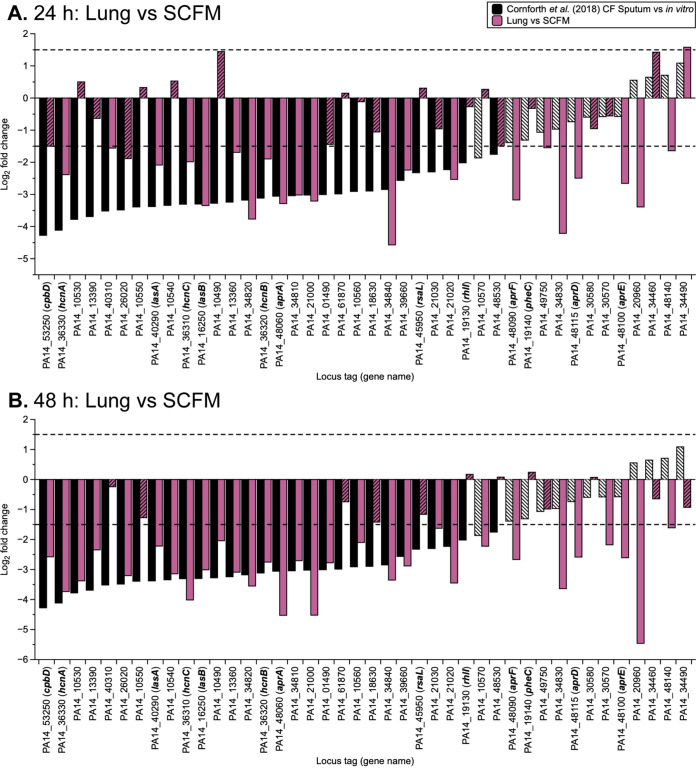
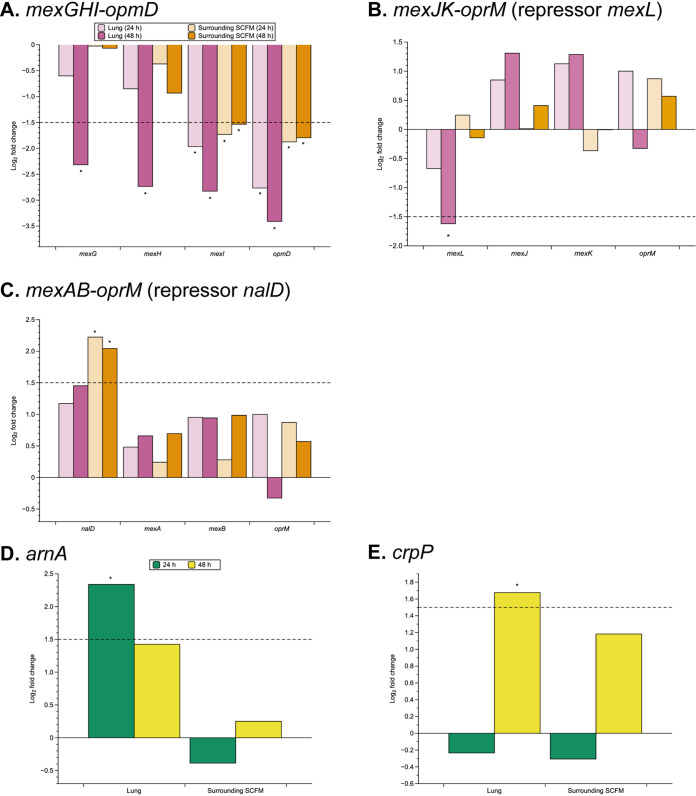
Pseudomonas aeruginosa is the predominant cause of chronic biofilm infections that form in the lungs of people with cystic fibrosis (CF). These infections are highly resistant to antibiotics and persist for years in the respiratory tract. One of the main research challenges is that current laboratory models do not accurately replicate key aspects of a P. aeruginosa biofilm infection, highlighted by previous RNA-sequencing studies. We compared the P. aeruginosa PA14 transcriptome in an ex vivo pig lung (EVPL) model of CF and a well-studied synthetic cystic fibrosis sputum medium (SCFM). P. aeruginosa was grown in the EVPL model for 1, 2, and 7 days, and in vitro in SCFM for 1 and 2 days. The RNA was extracted and sequenced at each time point. Our findings demonstrate that expression of antimicrobial resistance genes was cued by growth in the EVPL model, highlighting the importance of growth environment in determining accurate resistance profiles. The EVPL model created two distinct growth environments: tissue-associated biofilm and the SCFM surrounding tissue, each cuing a transcriptome distinct from that seen in SCFM in vitro. The expression of quorum sensing associated genes in the EVPL tissue-associated biofilm at 48 h relative to in vitro SCFM was similar to CF sputum versus in vitro conditions. Hence, the EVPL model can replicate key aspects of in vivo biofilm infection that are missing from other current models. It provides a more accurate P. aeruginosa growth environment for determining antimicrobial resistance that quickly drives P. aeruginosa into a chronic-like infection phenotype. IMPORTANCE Pseudomonas aeruginosa lung infections that affect people with cystic fibrosis are resistant to most available antimicrobial treatments. The lack of a laboratory model that captures all key aspects of these infections hinders not only research progression but also clinical diagnostics. We used transcriptome analysis to demonstrate how a model using pig lungs can more accurately replicate key characteristics of P. aeruginosa lung infection, including mechanisms of antibiotic resistance and infection establishment. Therefore, this model may be used in the future to further understand infection dynamics to develop novel treatments and more accurate treatment plans. This could improve clinical outcomes as well as quality of life for individuals affected by these infections.
Keywords: Pseudomonas aeruginosa; RNA sequencing; RNAseq; antibiotic resistance; antimicrobial resistance; biofilm; biofilms; chronic infection; cystic fibrosis; ex vivo model; quorum sensing; transcriptome.
Conflict of interest statement
The authors declare no conflict of interest.
Figures
Similar articles
-
Antibiotic Efficacy Testing in an Ex vivo Model of Pseudomonas aeruginosa and Staphylococcus aureus Biofilms in the Cystic Fibrosis Lung.J Vis Exp. 2021 Jan 22;(167). doi: 10.3791/62187. J Vis Exp. 2021. PMID: 33554970
-
Building a better biofilm - Formation of in vivo-like biofilm structures by Pseudomonas aeruginosa in a porcine model of cystic fibrosis lung infection.Biofilm. 2020 Dec;2:100024. doi: 10.1016/j.bioflm.2020.100024. Biofilm. 2020. PMID: 33381751 Free PMC article.
-
Standard versus biofilm antimicrobial susceptibility testing to guide antibiotic therapy in cystic fibrosis.Cochrane Database Syst Rev. 2020 Jun 10;6(6):CD009528. doi: 10.1002/14651858.CD009528.pub5. Cochrane Database Syst Rev. 2020. PMID: 32520436 Free PMC article.
-
Effect of Shear Stress on Pseudomonas aeruginosa Isolated from the Cystic Fibrosis Lung.mBio. 2016 Aug 2;7(4):e00813-16. doi: 10.1128/mBio.00813-16. mBio. 2016. PMID: 27486191 Free PMC article.
-
Antimicrobial resistance, respiratory tract infections and role of biofilms in lung infections in cystic fibrosis patients.Adv Drug Deliv Rev. 2015 May;85:7-23. doi: 10.1016/j.addr.2014.11.017. Epub 2014 Dec 2. Adv Drug Deliv Rev. 2015. PMID: 25477303 Review.
Cited by
-
Dual RNA sequencing of a co-culture model of Pseudomonas aeruginosa and human 2D upper airway organoids.Sci Rep. 2025 Jan 17;15(1):2222. doi: 10.1038/s41598-024-82500-w. Sci Rep. 2025. PMID: 39824906 Free PMC article.
-
Recreating chronic respiratory infections in vitro using physiologically relevant models.Eur Respir Rev. 2024 Aug 14;33(173):240062. doi: 10.1183/16000617.0062-2024. Print 2024 Jul. Eur Respir Rev. 2024. PMID: 39142711 Free PMC article. Review.
-
Transcriptional Profiling of Pseudomonas aeruginosa Infections.Adv Exp Med Biol. 2022;1386:303-323. doi: 10.1007/978-3-031-08491-1_11. Adv Exp Med Biol. 2022. PMID: 36258077 Review.
-
A new model of endotracheal tube biofilm identifies combinations of matrix-degrading enzymes and antimicrobials able to eradicate biofilms of pathogens that cause ventilator-associated pneumonia.Microbiology (Reading). 2024 Aug;170(8):001480. doi: 10.1099/mic.0.001480. Microbiology (Reading). 2024. PMID: 39088248 Free PMC article.
-
Spatial transcriptomics identifies novel Pseudomonas aeruginosa virulence factors.Cell Genom. 2025 Mar 12;5(3):100805. doi: 10.1016/j.xgen.2025.100805. Cell Genom. 2025. PMID: 40081336 Free PMC article.
References
Publication types
MeSH terms
Substances
Grants and funding
LinkOut - more resources
Full Text Sources
Medical
