

High-resolution fluorescence-guided transcranial ultrasound mapping in the live mouse brain
- PMID: 34878843
- PMCID: PMC8654306
- DOI: 10.1126/sciadv.abi5464
High-resolution fluorescence-guided transcranial ultrasound mapping in the live mouse brain
Abstract
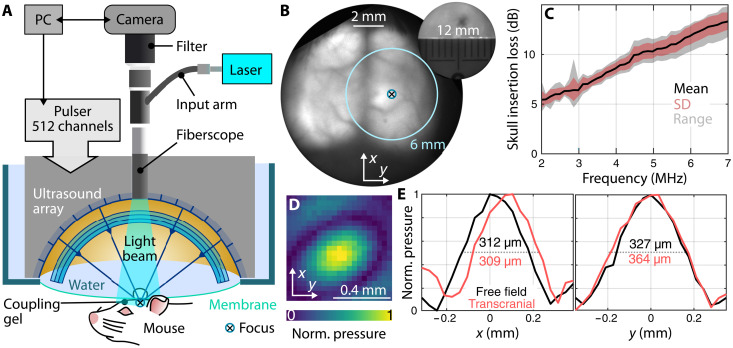
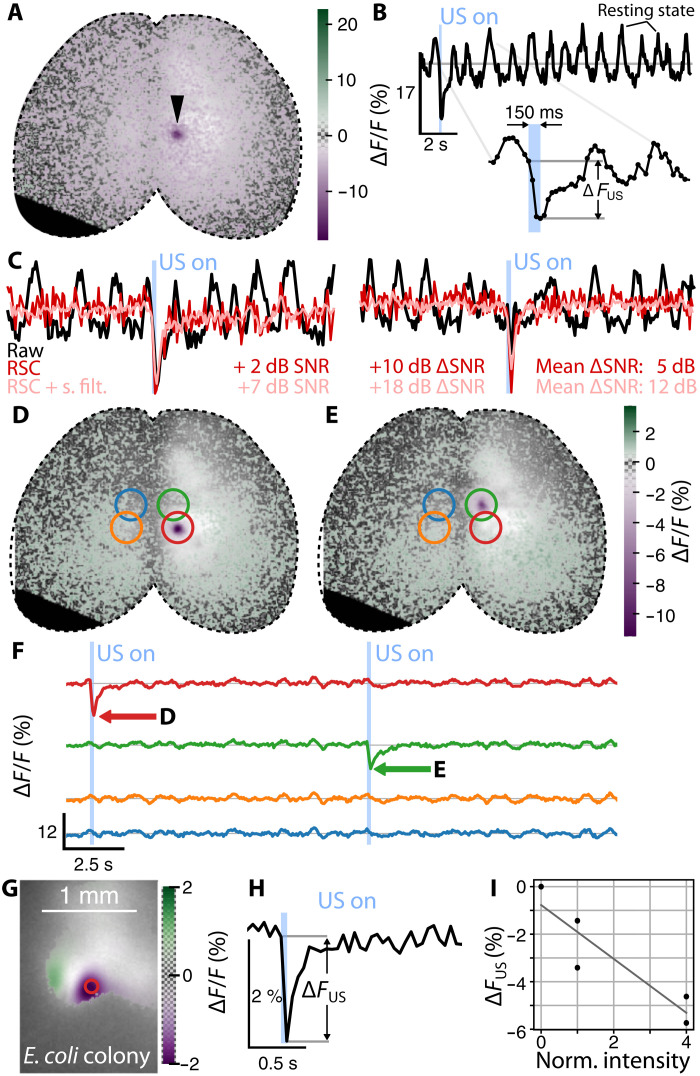
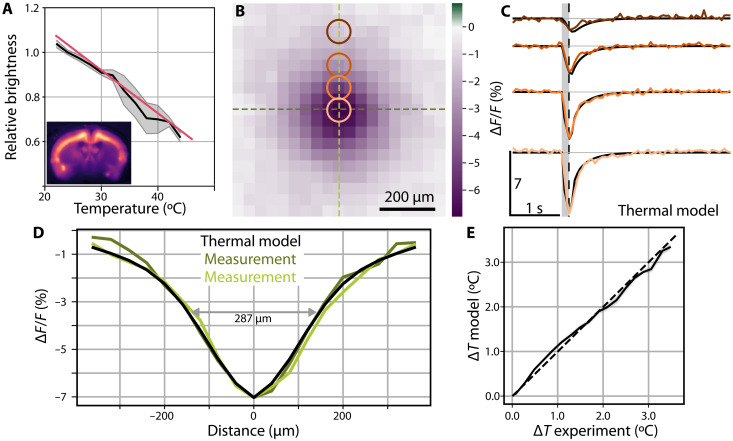
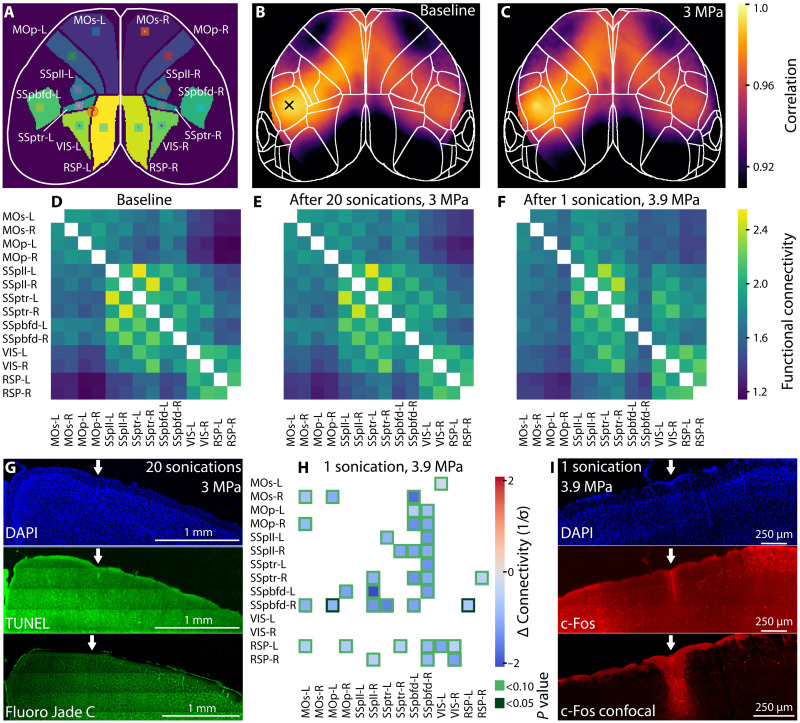
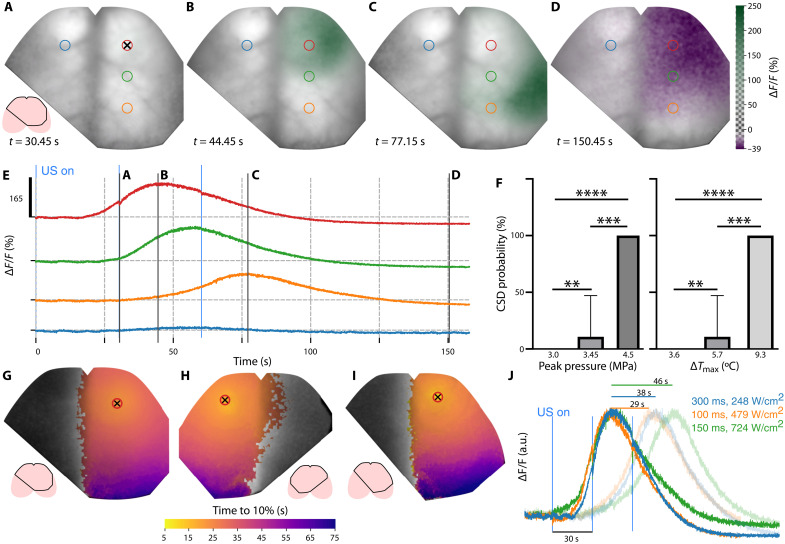
Understanding the physiological impact of transcranial ultrasound in rodent brains may offer an important preclinical model for human scale magnetic resonance–guided focused ultrasound methods. However, precision tools for high-resolution transcranial ultrasound targeting and real-time in vivo tracking of its effects at the mouse brain scale are currently lacking. We report a versatile bidirectional hybrid fluorescence-ultrasound (FLUS) system incorporating a 0.35-mm precision spherical-phased array ultrasound emission with a fiberscope-based wide-field fluorescence imaging. We show how the marriage between cortex-wide functional imaging and targeted ultrasound delivery can be used to transcranially map previously undocumented localized fluorescence events caused by reversible thermal processes and perform high-speed large-scale recording of neural activity induced by focused ultrasound. FLUS thus naturally harnesses the extensive toolbox of fluorescent tags and ultrasound’s localized bioeffects toward visualizing and causally perturbing a plethora of normal and pathophysiological processes in the living murine brain.
Figures
Similar articles
-
Spherical Array System for High-Precision Transcranial Ultrasound Stimulation and Optoacoustic Imaging in Rodents.IEEE Trans Ultrason Ferroelectr Freq Control. 2021 Jan;68(1):107-115. doi: 10.1109/TUFFC.2020.2994877. Epub 2020 Dec 23. IEEE Trans Ultrason Ferroelectr Freq Control. 2021. PMID: 32406833 Free PMC article.
-
Model-based correction of rapid thermal confounds in fluorescence neuroimaging of targeted perturbation.Neurophotonics. 2024 Jan;11(1):014413. doi: 10.1117/1.NPh.11.1.014413. Epub 2024 Feb 16. Neurophotonics. 2024. PMID: 38371339 Free PMC article.
-
Integrated ultrasound and magnetic resonance imaging for simultaneous temperature and cavitation monitoring during focused ultrasound therapies.Med Phys. 2013 Nov;40(11):112901. doi: 10.1118/1.4823793. Med Phys. 2013. PMID: 24320468 Free PMC article.
-
Transcranial focused ultrasound precise neuromodulation: a review of focal size regulation, treatment efficiency and mechanisms.Front Neurosci. 2024 Sep 5;18:1463038. doi: 10.3389/fnins.2024.1463038. eCollection 2024. Front Neurosci. 2024. PMID: 39301015 Free PMC article. Review.
-
[Transcranial focused ultrasound: Neurological applications of magnetic resonance-guided high-intensity focused ultrasound].Radiologe. 2015 Nov;55(11):976-80, 982-3. doi: 10.1007/s00117-015-0026-1. Radiologe. 2015. PMID: 26438092 Review. German.
Cited by
-
Two-photon imaging of excitatory and inhibitory neural response to infrared neural stimulation.Neurophotonics. 2024 Apr;11(2):025003. doi: 10.1117/1.NPh.11.2.025003. Epub 2024 May 24. Neurophotonics. 2024. PMID: 38800606 Free PMC article.
-
Effects of focused ultrasound in a "clean" mouse model of ultrasonic neuromodulation.iScience. 2023 Oct 31;26(12):108372. doi: 10.1016/j.isci.2023.108372. eCollection 2023 Dec 15. iScience. 2023. PMID: 38047084 Free PMC article.
-
Shedding light on ultrasound in action: Optical and optoacoustic monitoring of ultrasound brain interventions.Adv Drug Deliv Rev. 2024 Feb;205:115177. doi: 10.1016/j.addr.2023.115177. Epub 2024 Jan 5. Adv Drug Deliv Rev. 2024. PMID: 38184194 Free PMC article. Review.
-
Holographic transcranial ultrasound neuromodulation enhances stimulation efficacy by cooperatively recruiting distributed brain circuits.Nat Biomed Eng. 2025 Jul 7. doi: 10.1038/s41551-025-01449-x. Online ahead of print. Nat Biomed Eng. 2025. PMID: 40624336
-
High-throughput ultrasound neuromodulation in awake and freely behaving rats.Brain Stimul. 2023 Nov-Dec;16(6):1743-1752. doi: 10.1016/j.brs.2023.11.014. Epub 2023 Dec 3. Brain Stimul. 2023. PMID: 38052373 Free PMC article.
References
-
- Meng Y., Hynynen K., Lipsman N., Applications of focused ultrasound in the brain: From thermoablation to drug delivery. Nat. Rev. Neurol. 17, 7–22 (2021). - PubMed
-
- Ozenne V., Constans C., Bour P., Santin M. D., Valabrègue R., Ahnine H., Pouget P., Lehéricy S., Aubry J., Quesson B., MRI monitoring of temperature and displacement for transcranial focus ultrasound applications. Neuroimage 204, 116236 (2019). - PubMed
-
- Naor O., Krupa S., Shoham S., Ultrasonic neuromodulation. J. Neural Eng. 13, 031003 (2016). - PubMed
Grants and funding
LinkOut - more resources
Full Text Sources
