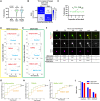
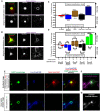
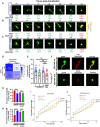
. 2021 Dec 10;7(50):eabf8142.
doi: 10.1126/sciadv.abf8142. Epub 2021 Dec 8.

Superhuman cell death detection with biomarker-optimized neural networks

Affiliations

Superhuman cell death detection with biomarker-optimized neural networks

Jeremy W Linsley et al. Sci Adv. .

Abstract

Cellular events underlying neurodegenerative disease may be captured by longitudinal live microscopy of neurons. While the advent of robot-assisted microscopy has helped scale such efforts to high-throughput regimes with the statistical power to detect transient events, time-intensive human annotation is required. We addressed this fundamental limitation with biomarker-optimized convolutional neural networks (BO-CNNs): interpretable computer vision models trained directly on biosensor activity. We demonstrate the ability of BO-CNNs to detect cell death, which is typically measured by trained annotators. BO-CNNs detected cell death with superhuman accuracy and speed by learning to identify subcellular morphology associated with cell vitality, despite receiving no explicit supervision to rely on these features. These models also revealed an intranuclear morphology signal that is difficult to spot by eye and had not previously been linked to cell death, but that reliably indicates death. BO-CNNs are broadly useful for analyzing live microscopy and essential for interpreting high-throughput experiments.


Figures
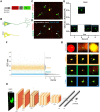
Fig. 1.
Fig. 1.. GEDI signal as a ground truth for training a live/dead classifier CNN from morphology.
(A) GEDI biosensor expression plasmid contains a neuron-specific promoter driving expression of a red fluorescent RGEDI protein, a P2a “cleavable peptide,” and an EGFP protein. Normalizing the RGEDI signal to the EGFP signal (GEDI ratio) at a single-cell level provides a ratiometric measure of a “death” signal that is largely independent of cell-to-cell variation in transfection efficiency and plasmid expression. (B) Schematic overlay of green and red channels illustrating the GEDI sensor’s color change in live neurons (top) and dead neurons (bottom). Live neurons typically contain basal RGEDI signal in the nucleus and in the perinuclear region near intracellular organelles with high Ca2+ (32). (C) Representative red and green channel overlay of neurons expressing GEDI, showing one dead (x) and three live (0) neurons. (D) Segmentation of image in (C) for objects above a specific size and intensity identifies the soma of each neuron (segmentation masks), which is given a unique identifier label (1 to 4). (E) Ratio of RGEDI to EGFP fluorescence (GEDI ratio) in neurons from (D). A ratio above the GEDI threshold (dotted line) indicates an irreversible increase in GEDI signal associated with neuronal death. Cropped EGFP images are plotted at the level of their associated GEDI ratio. (F and G) Generation of GEDI-CNN training datasets from images of individual cells. GEDI ratios from images of each cell (G) were used to create training examples of live and dead cells. Cells with intermediate or extremely high GEDI ratios were discarded to eliminate ambiguity during the training process. Automated cell segmentation boundaries are overlaid in white. (H) Architecture of GEDI-CNN model based off of VGG16 architecture. conv1 to conv5, convolutional layers; FC6 to FC8, fully connected layers (numbers describe the dimensionality of each layer). Scale bar, 20 μm.
Fig. 2.
Fig. 2.. Application of GEDI-CNN to time-lapse, single-cell imaging of neurons.
(A) Accuracy of GEDI-CNN testing on time-lapse imaging across the entire dataset, per batch (reflecting biological variation between primary neuron preps), and per imaging date (reflecting technical variability of the microscope over time). Black horizonal line represents mean. (B) Confusion matrix comparing GEDI-CNN predictions to ground truth (GEDI biosensor) with percentage (top) and neuron count (bottom). (C) Percentage of accuracy as a function of the proportion of live to dead neurons in dataset. Green line represents linear regression fit to data. (D and E) Cumulative rate of death per well over time for α-synuclein–expressing versus RGEDI-P2a-EGFP (control) neurons (top), TDP43-expressing versus control (middle) neurons, or HttEx1-Q97 (bottom) versus HttEx1-Q25 neurons using GEDI biosensor (D) or GEDI-CNN (E) (n = 48 wells each condition). (F) Representative time-lapse images of a dying single neuron with correct classification showing the overlay (top) (EGFP = green, RGEDI = red), the free EGFP morphology signal (middle) used by GEDI-CNN for classification, and the binary mask of automatically segmented object (bottom) used for quantification of GEDI ratio. By 168 hours after transfection, free EGFP within dead neurons has sufficiently degraded for an object not to be detected. (G) Cumulative risk of death of α-synuclein–expressing versus RGEDI-P2a-control neurons (HR = 1.95, ****P < 2 × 10⁻¹⁶), (H) TDP43 versus RGEDI-P2a-control neurons (HR = 1.62, ****P < 2 × 10⁻¹⁶), and (I) HttEx1-Q97 versus HttEx1-Q25 neurons (HR = 1.33, ***P < 2.11 × 10⁻¹³). a.u., arbitrary units. (J) Comparison of the hazard ratio using GEDI-CNN (top) versus GEDI biosensor (bottom) (32). Scale bar, 20 μm.
Fig. 3.
Fig. 3.. GEDI-CNN has superhuman accuracy and speed at live/dead classification.
(A) Mean classification accuracy for GEDI-CNN and four human curators across four batches of 500 images using GEDI biosensor data as ground truth [±SEM, analysis of variance (ANOVA) Dunnett’s multiple comparison, ***P < 0.0001, **P < 0.01, and *P < 0.05]. (B) Speed of image curation by human curators versus GEDI-CNN running on a central processing unit (CPU) or graphics processing unit (GPU). Dotted line indicates average imaging speed (±SEM). (C and D) Representative cropped EGFP morphology images in which GEDI biosensor ground truth, a consensus of human curators, and GEDI-CNN classify neurons as live (C) or dead (D). Green arrows point to neurites from central neuron; yellow x’s mark peripheral debris near central neuron. (E to G, I, and J) Examples of neurons that elicited different classifications from the GEDI ground truth, the GEDI-CNN, and/or the human curator consensus. Green arrows point to neurites from central neuron, and red arrows point to neurites that may belong to a neuron other than the central neuron. Yellow x’s indicate peripheral debris near the central neuron. Turquoise asterisk indicates a blurry fluorescence from the central neuron. (H) Number of humans needed for their consensus decisions to reach GEDI-CNN accuracy. Human ensembles are constructed by recording modal decisions over bootstraps, which can reduce decision noise exhibited by individual curators. The blue line represents a linear fit to the human ensembles, and the shaded area depicts a 95% confidence interval.
Fig. 4.
Fig. 4.. GEDI-CNN classifications translate across different imaging parameters and biology.
(A) Mean classification accuracy of GEDI-CNN in comparison to human curators across three mouse primary cortical neuron datasets. Scale bar, 20 μm (ANOVA and Dunnett’s multiple comparison, ***P < 0.001, **P < 0.01, and *P < 0.05; ns, not significant). (B) Representative cropped EGFP (top) and overlaid RGEDI and EGFP images (bottom) of HEK293 cells. Cell centered on left panels is live by both GEDI biosensor and GEDI-CNN. Cell centered on right panels is dead by both GEDI biosensor and GEDI-CNN.
Fig. 5.
Fig. 5.. GEDI-CNN learns to use membrane and nuclear signal to classify live/dead cells with superhuman accuracy.
(A and B) Free EGFP fluorescence of neurons (top) and GEDI-CNN GradCAM signal (bottom) associated with correct live (A) and dead (B) classification. Yellow arrowhead indicates GradCAM signal corresponding to the neuron membrane. White arrow indicates GradCAM signal within the soma of the neuron. (C) Cropped image of a neuron classified as live by GEDI-CNN that is coexpressing free mRuby (top left, blue) and CAAX-EGFP (bottom left, red), with the corresponding GradCAM image (top right, green), and the three-color overlay (bottom right). (D) Cropped image of a neuron classified as dead by GEDI-CNN coexpressing free mRuby (top left, blue) and nls-BFP (bottom left, red), with the corresponding GradCAM image (top right, green), and the three-color overlay (bottom right). (E) Violin plot of quantification of the Pearson coefficient after Costes’s automatic thresholding between GradCAM signal and background signal (n = 3083), nls-BFP (n = 86), CAAX-EGFP (n = 3151), and free mRuby (n = 5404, ****P < 0.0001). (F) Per image percentage of GradCAM signal in the inner soma and outer soma across live and dead neurons. Scale bar, 20 μm.
Fig. 6.
Fig. 6.. Inner soma signal important for dead classification and membrane and neurite signals important for live classifications by GEDI-CNN.
(A and B) Top left: Overlay of free EGFP morphology (green) and GradCAM signal (red) from a neuron classified as dead (A) or live (B) by GEDI-CNN and a series of automatically generated ablations of the neurites, inner soma, no-signal area, outer soma, and soma (left to right, top to bottom). (C) Effects of signal ablations on GEDI-CNN classification by region. Panels depict the mean percentage of neurons in each region whose classification incorrectly changed from dead to live after ablation (top, n = 4619) or from live to dead (bottom, n = 5122). Changes significantly different from 0 are marked by * (Tukey’s post hoc with correction for multiple comparisons, ****P < 0.0001 and *P < 0.05). (D) Effects of ablating signal from different subcellular regions on the accuracy of the GEDI-CNN’s classification of neurons that were originally correctly classified by GEDI-CNN but incorrectly classified by at least two human curators (Tukey’s post hoc with correction for multiple comparisons, ****P < 0.0001 and *P < 0.05). (E) Top: Representative image of the EGFP morphology of a dead neuron classified live by a consensus of four human curators and dead by a GEDI-CNN with its associated live and dead GradCAM signals. Bottom: Inner soma–ablated EGFP image that changed GEDI-CNN classification from dead to live and its associated live and dead GradCAM signals. (F) Overlay of the dead GradCAM signal from the dead-classified, unaltered image and the live GradCAM signal from the live-classified inner soma–ablated image. (G) Difference between dead GradCAM signal from the unaltered image and the live GradCAM signal from the inner soma–ablated image. Scale bar, 20 μm.
Fig. 7.
Fig. 7.. GEDI-CNN classifications translate to studies of neurodegeneration in human iPSC-derived motor neurons.
(A to C) Representative longitudinal time-lapse images overlaying RGEDI (red) and EGFP (yellow) in iPSC-derived motor neurons derived from a healthy control patient (A), an ALS patient with SOD1I113T (B), or an ALS patient with SOD1H44R (C). Comparison of live/dead classifications derived from the GEDI biosensor and GEDI-CNN below each image. (D) Confusion matrix of live/dead classification accuracy of GEDI-CNN on iPSC-derived motor neurons. (E) Mean classification accuracy of GEDI-CNN and human curators on randomized 50% live:dead balanced batches of data (ANOVA with Tukey’s multiple comparisons). Each curator and the GEDI-CNN showed classification accuracy significantly above chance (****P < 0.0001, Wilcoxon signed-rank difference from 50%). (F) Representative images of free EGFP morphology expression (left), GradCAM signal (middle), and overlay of GradCAM and EGFP (right) of iPSC-derived motor neurons classified correctly as live (top) and dead (bottom) by GEDI-CNN. (G and H) GradCAM signal in the soma shifts from outer soma in live neurons (G) to inner soma in dead neurons (H) in both human iPSC-derived motor neurons (hiPS-MN) and rat primary cortical neurons (rCortical Neuron). (I) Cumulative risk of death of SOD1I113T (HR = 1.52, ****P < 0.0001) and SOD1H44R (HR = 0.79, ****P < 0.0001) neurons derived from GEDI-CNN. (J) Cumulative risk of death of SOD1I113T (HR = 1.35, ****P < 0.0001) and SOD1H44R (HR = 0.83, ****P < 0.0001) neurons using GEDI biosensor. Scale bar, 20 μm.

Similar articles

  • Prescription of Controlled Substances: Benefits and Risks.
    Preuss CV, Kalava A, King KC. Preuss CV, et al. 2025 Jul 6. In: StatPearls [Internet]. Treasure Island (FL): StatPearls Publishing; 2025 Jan–. 2025 Jul 6. In: StatPearls [Internet]. Treasure Island (FL): StatPearls Publishing; 2025 Jan–. PMID: 30726003 Free Books & Documents.
  • Short-Term Memory Impairment.
    Cascella M, Al Khalili Y. Cascella M, et al. 2024 Jun 8. In: StatPearls [Internet]. Treasure Island (FL): StatPearls Publishing; 2025 Jan–. 2024 Jun 8. In: StatPearls [Internet]. Treasure Island (FL): StatPearls Publishing; 2025 Jan–. PMID: 31424720 Free Books & Documents.
  • The Black Book of Psychotropic Dosing and Monitoring.
    DeBattista C, Schatzberg AF. DeBattista C, et al. Psychopharmacol Bull. 2024 Jul 8;54(3):8-59. Psychopharmacol Bull. 2024. PMID: 38993656 Free PMC article. Review.
  • Systemic Inflammatory Response Syndrome.
    Baddam S, Burns B. Baddam S, et al. 2025 Jun 20. In: StatPearls [Internet]. Treasure Island (FL): StatPearls Publishing; 2025 Jan–. 2025 Jun 20. In: StatPearls [Internet]. Treasure Island (FL): StatPearls Publishing; 2025 Jan–. PMID: 31613449 Free Books & Documents.
  • Signs and symptoms to determine if a patient presenting in primary care or hospital outpatient settings has COVID-19.
    Struyf T, Deeks JJ, Dinnes J, Takwoingi Y, Davenport C, Leeflang MM, Spijker R, Hooft L, Emperador D, Domen J, Tans A, Janssens S, Wickramasinghe D, Lannoy V, Horn SRA, Van den Bruel A; Cochrane COVID-19 Diagnostic Test Accuracy Group. Struyf T, et al. Cochrane Database Syst Rev. 2022 May 20;5(5):CD013665. doi: 10.1002/14651858.CD013665.pub3. Cochrane Database Syst Rev. 2022. PMID: 35593186 Free PMC article.

Cited by

References

    1. Arrasate M., Mitra S., Schweitzer E. S., Segal M. R., Finkbeiner S., Inclusion body formation reduces levels of mutant huntingtin and the risk of neuronal death. Nature 431, 805–810 (2004). - PubMed
    1. Barmada S. J., Serio A., Arjun A., Bilican B., Daub A., Ando D. M., Tsvetkov A., Pleiss M., Li X., Peisach D., Shaw C., Chandran S., Finkbeiner S., Autophagy induction enhances TDP43 turnover and survival in neuronal ALS models. Nat. Chem. Biol. 10, 677–685 (2014). - PMC - PubMed
    1. Miller J., Arrasate M., Shaby B. A., Mitra S., Masliah E., Finkbeiner S., Quantitative relationships between huntingtin levels, polyglutamine length, inclusion body formation, and neuronal death provide novel insight into Huntington's disease molecular pathogenesis. J. Neurosci. 30, 10541–10550 (2010). - PMC - PubMed
    1. Tsvetkov A. S., Miller J., Arrasate M., Wong J. S., Pleiss M. A., Finkbeiner S., A small-molecule scaffold induces autophagy in primary neurons and protects against toxicity in a Huntington disease model. Proc. Natl. Acad. Sci. U.S.A. 107, 16982–16987 (2010). - PMC - PubMed
    1. Carpenter A. E., Extracting rich information from images. Methods Mol. Biol. 486, 193–211 (2009). - PubMed