. 2021 Dec 10;7(50):eabl3648.
doi: 10.1126/sciadv.abl3648. Epub 2021 Dec 8.

Ozone chemistry in western U.S. wildfire plumes

Affiliations

Ozone chemistry in western U.S. wildfire plumes

Lu Xu et al. Sci Adv. .

Abstract

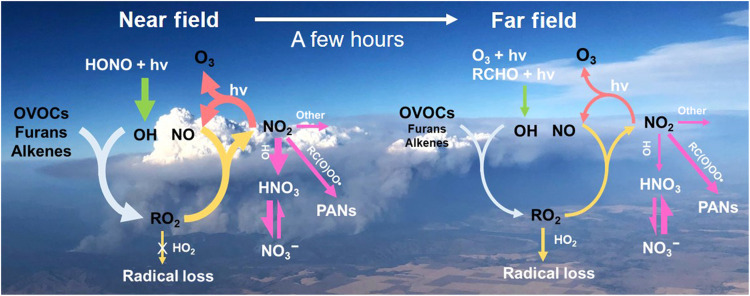
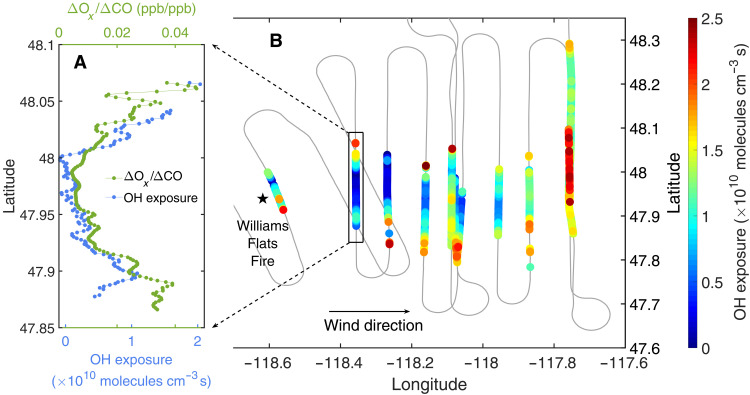
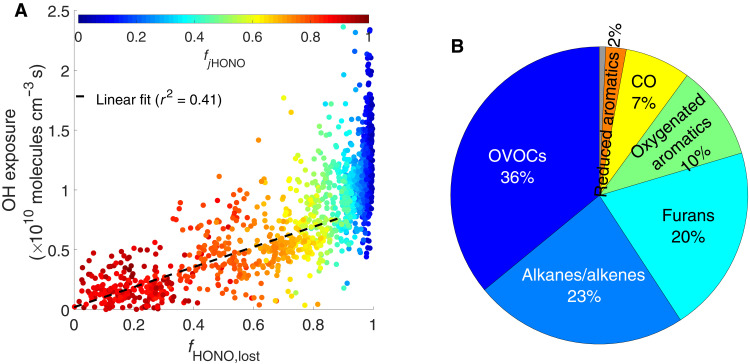
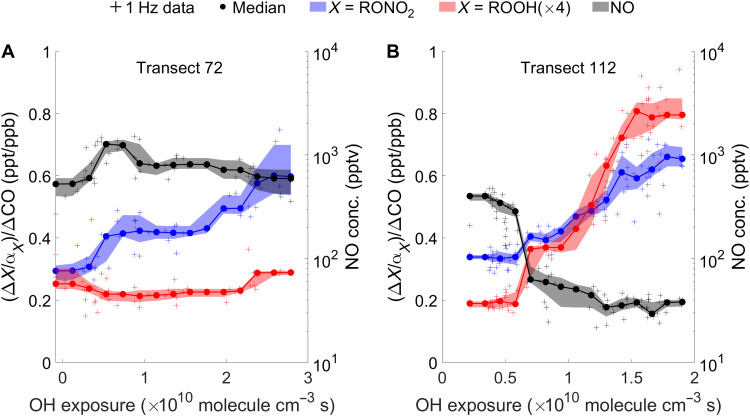
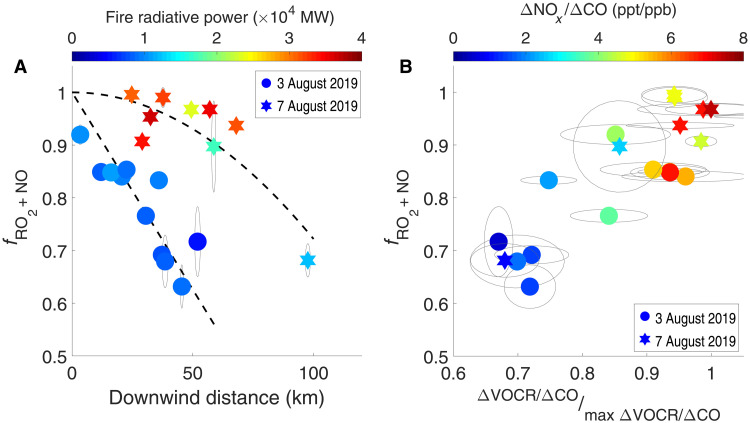
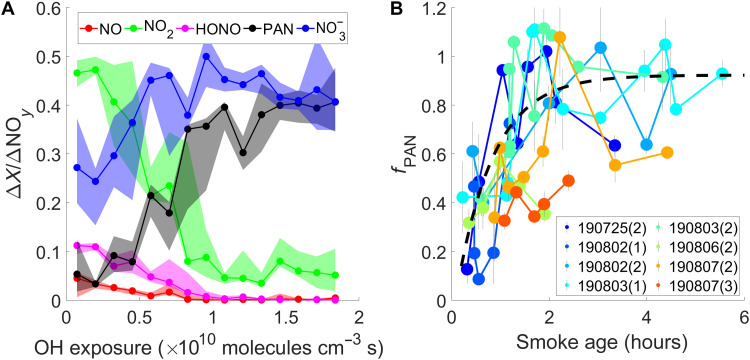
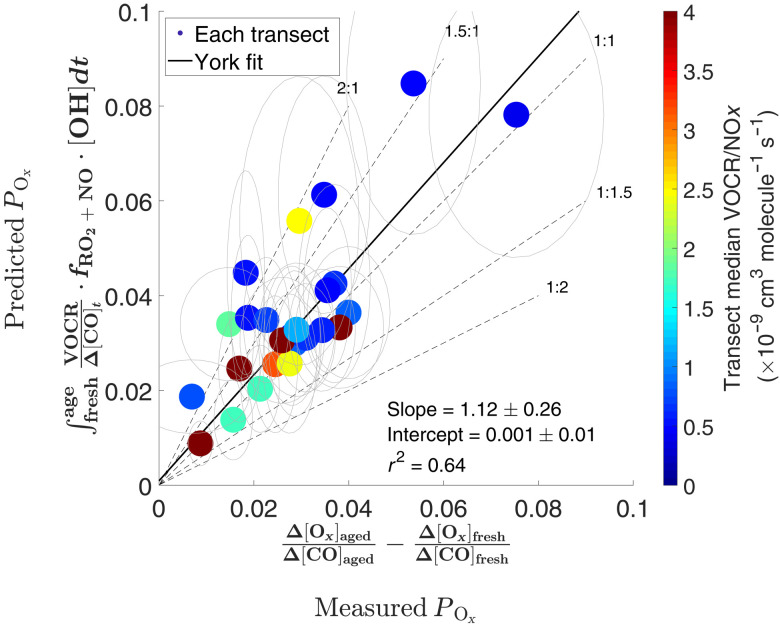
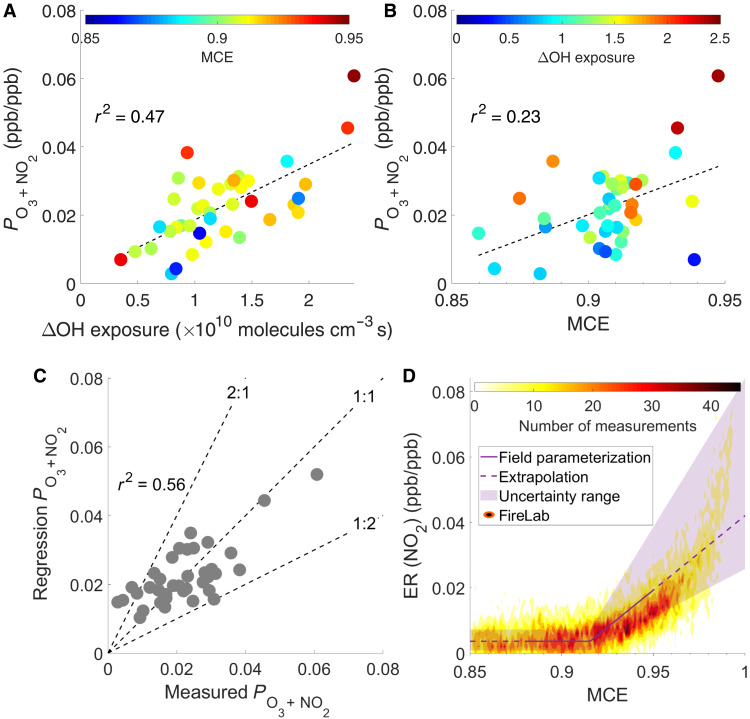
Wildfires are a substantial but poorly quantified source of tropospheric ozone (O3). Here, to investigate the highly variable O3 chemistry in wildfire plumes, we exploit the in situ chemical characterization of western wildfires during the FIREX-AQ flight campaign and show that O3 production can be predicted as a function of experimentally constrained OH exposure, volatile organic compound (VOC) reactivity, and the fate of peroxy radicals. The O3 chemistry exhibits rapid transition in chemical regimes. Within a few daylight hours, the O3 formation substantially slows and is largely limited by the abundance of nitrogen oxides (NOx). This finding supports previous observations that O3 formation is enhanced when VOC-rich wildfire smoke mixes into NOx-rich urban plumes, thereby deteriorating urban air quality. Last, we relate O3 chemistry to the underlying fire characteristics, enabling a more accurate representation of wildfire chemistry in atmospheric models that are used to study air quality and predict climate.


Figures

Fig. 1.
Fig. 1.. Simplified scheme to illustrate the factors influencing O3 formation in wildfire plumes.
Wildfires emit oxidant precursors, NOx, and an enormous diversity of VOCs. In the near field, OH produced via photolysis of HONO initiates VOC oxidation, which proceeds in the presence of NOx and leads to efficient O3 formation. After a few hours, the HONO has been consumed and NOx has been both diluted sufficiently and converted to PANs and NO3 such that the O3 formation slows by several orders of magnitude. In this simplified scheme, the width of arrows having the same color represents the relative importance of competing pathways.
Fig. 2.
Fig. 2.. Single transect analysis (STA) examines the differences in plume composition across individual transects of the wildfire plumes.
In (B), the flight track on 3 August 2019 is colored by OH exposure, which is lower in plume center than edges, as a result of high aerosol optical extinction in plume center. In (A), the dilution-corrected Ox formation (i.e., ΔOx/ΔCO) is illustrated in one near-field transect.
Fig. 3.
Fig. 3.. Production and fate of OH.
(A) shows that the OH exposure correlates with the amount of HONO loss [fHONO,lost = 1 − (ΔHONO/ΔCO)/(ΔHONO/ΔCO)max] for the 3 August 2019 Williams Flats Fire. The correlation indicates that OH is produced mainly by HONO photolysis in the near field. The color represents the relative contribution of HONO photolysis to total HOx production rate (denoted as fjHONO). (B) shows that OVOCs, alkanes/alkenes, and furans are the major contributors to total VOCR based on the average of transects included in the Ox chemical closure analysis.
Fig. 4.
Fig. 4.. The measurements of ROOH and RONO2 from propene oxidation are used to diagnose the RO2 fate.
The ROOH is not produced in the transect with high [NO] (A) but produced in the transect with low [NO] (B). The signals of both RONO2 and ROOH are divided by the branching ratio of the corresponding RO2 reaction (i.e., α). The ROOH signal is multiplied by a factor of 4 to be shown in the same scale as RONO2. The shaded area represents the 25th to 75th percentile. ppb, parts per billion.
Fig. 5.
Fig. 5.. The RO2 fate transitions from an RO2 + NO–dominated regime to a mixed regime with increasing importance of RO2 + HO2.
(A) The fRO2 + NO decreases as smoke transports in the William Flats Fire sampled on 2 different days. The data points are colored by the fire radiative power (FRP) measured at the estimated time of smoke emission. (B) A large fraction of VOCs is oxidized in the mixed regime. The max ΔVOCR/ΔCO is represented by the average ΔVOCR/ΔCO of observations with the top 1% [CO] during the fire sample. The downwind distance is estimated on the basis of the aircraft position and the burned area. The dashed lines are provided as a visual aid. The ellipses represent the uncertainty range.
Fig. 6.
Fig. 6.. The evolution of the partitioning of NOy species.
(A) shows measurements of the 3 August 2019 Williams Flats Fire. As smoke ages, the NOx and HONO emitted from fires are converted to PAN and NO3. (B) shows that the fraction of NOx loss to PAN (fPAN) across each transect increases with smoke age, which results from evolving CH3CHO/NO2 as discussed in the text. Each data point represents one transect, and the transects from the same fire sampling patterns have the same color. The black line is provided as a visual aid. The numbers in parentheses represent the index of a set of crosswind transects in a flight.
Fig. 7.
Fig. 7.. The predicted and measured Ox production show reasonable agreement.
The ellipses represent the uncertainty range (Supplementary Materials, section S9). The slope and intercepts are obtained from a York fit.
Fig. 8.
Fig. 8.. Parameterization of the O3 + NO2 production.
The measured production of O3 + NO2 (PO3 + NO2) across individual transects exhibits positive correlation with the span of OH exposure (ΔOH exposure) and MCE, as shown in (A) and (B), respectively. Thirty-nine transects are selected for this analysis (Supplementary Materials, section S4). (C) Comparison between predicted and measured PO3 + NO2 for individual transects. (D) The emission ratios (ERs) of NO2 to CO derived from the field [i.e., a + b×max(0,MCE-c)] and measured in the 2016 FIREX FireLab are plotted as a function of MCE.

References

    1. Akagi S. K., Yokelson R. J., Wiedinmyer C., Alvarado M. J., Reid J. S., Karl T., Crounse J. D., Wennberg P. O., Emission factors for open and domestic biomass burning for use in atmospheric models. Atmos. Chem. Phys. 11, 4039–4072 (2011).
    1. Andreae M. O., Emission of trace gases and aerosols from biomass burning–An updated assessment. Atmos. Chem. Phys. 19, 8523–8546 (2019).
    1. Li Y., Mickley L. J., Liu P., Kaplan J. O., Trends and spatial shifts in lightning fires and smoke concentrations in response to 21st century climate over the national forests and parks of the western United States. Atmos. Chem. Phys. 20, 8827–8838 (2020).
    1. Jaffe D. A., O’Neill S. M., Larkin N. K., Holder A. L., Peterson D. L., Halofsky J. E., Rappold A. G., Wildfire and prescribed burning impacts on air quality in the United States. J. Air Waste Manage. Assoc. 70, 583–615 (2020). - PMC - PubMed
    1. Jaffe D. A., Wigder N. L., Ozone production from wildfires: A critical review. Atmos. Environ. 51, 1–10 (2012).

LinkOut - more resources