Observational Study
. 2022 Mar 1;205(5):507-519.
doi: 10.1164/rccm.202106-1514OC.

Alveolar, Endothelial, and Organ Injury Marker Dynamics in Severe COVID-19

Affiliations
Observational Study

Alveolar, Endothelial, and Organ Injury Marker Dynamics in Severe COVID-19

Daniel E Leisman et al. Am J Respir Crit Care Med. .

Abstract

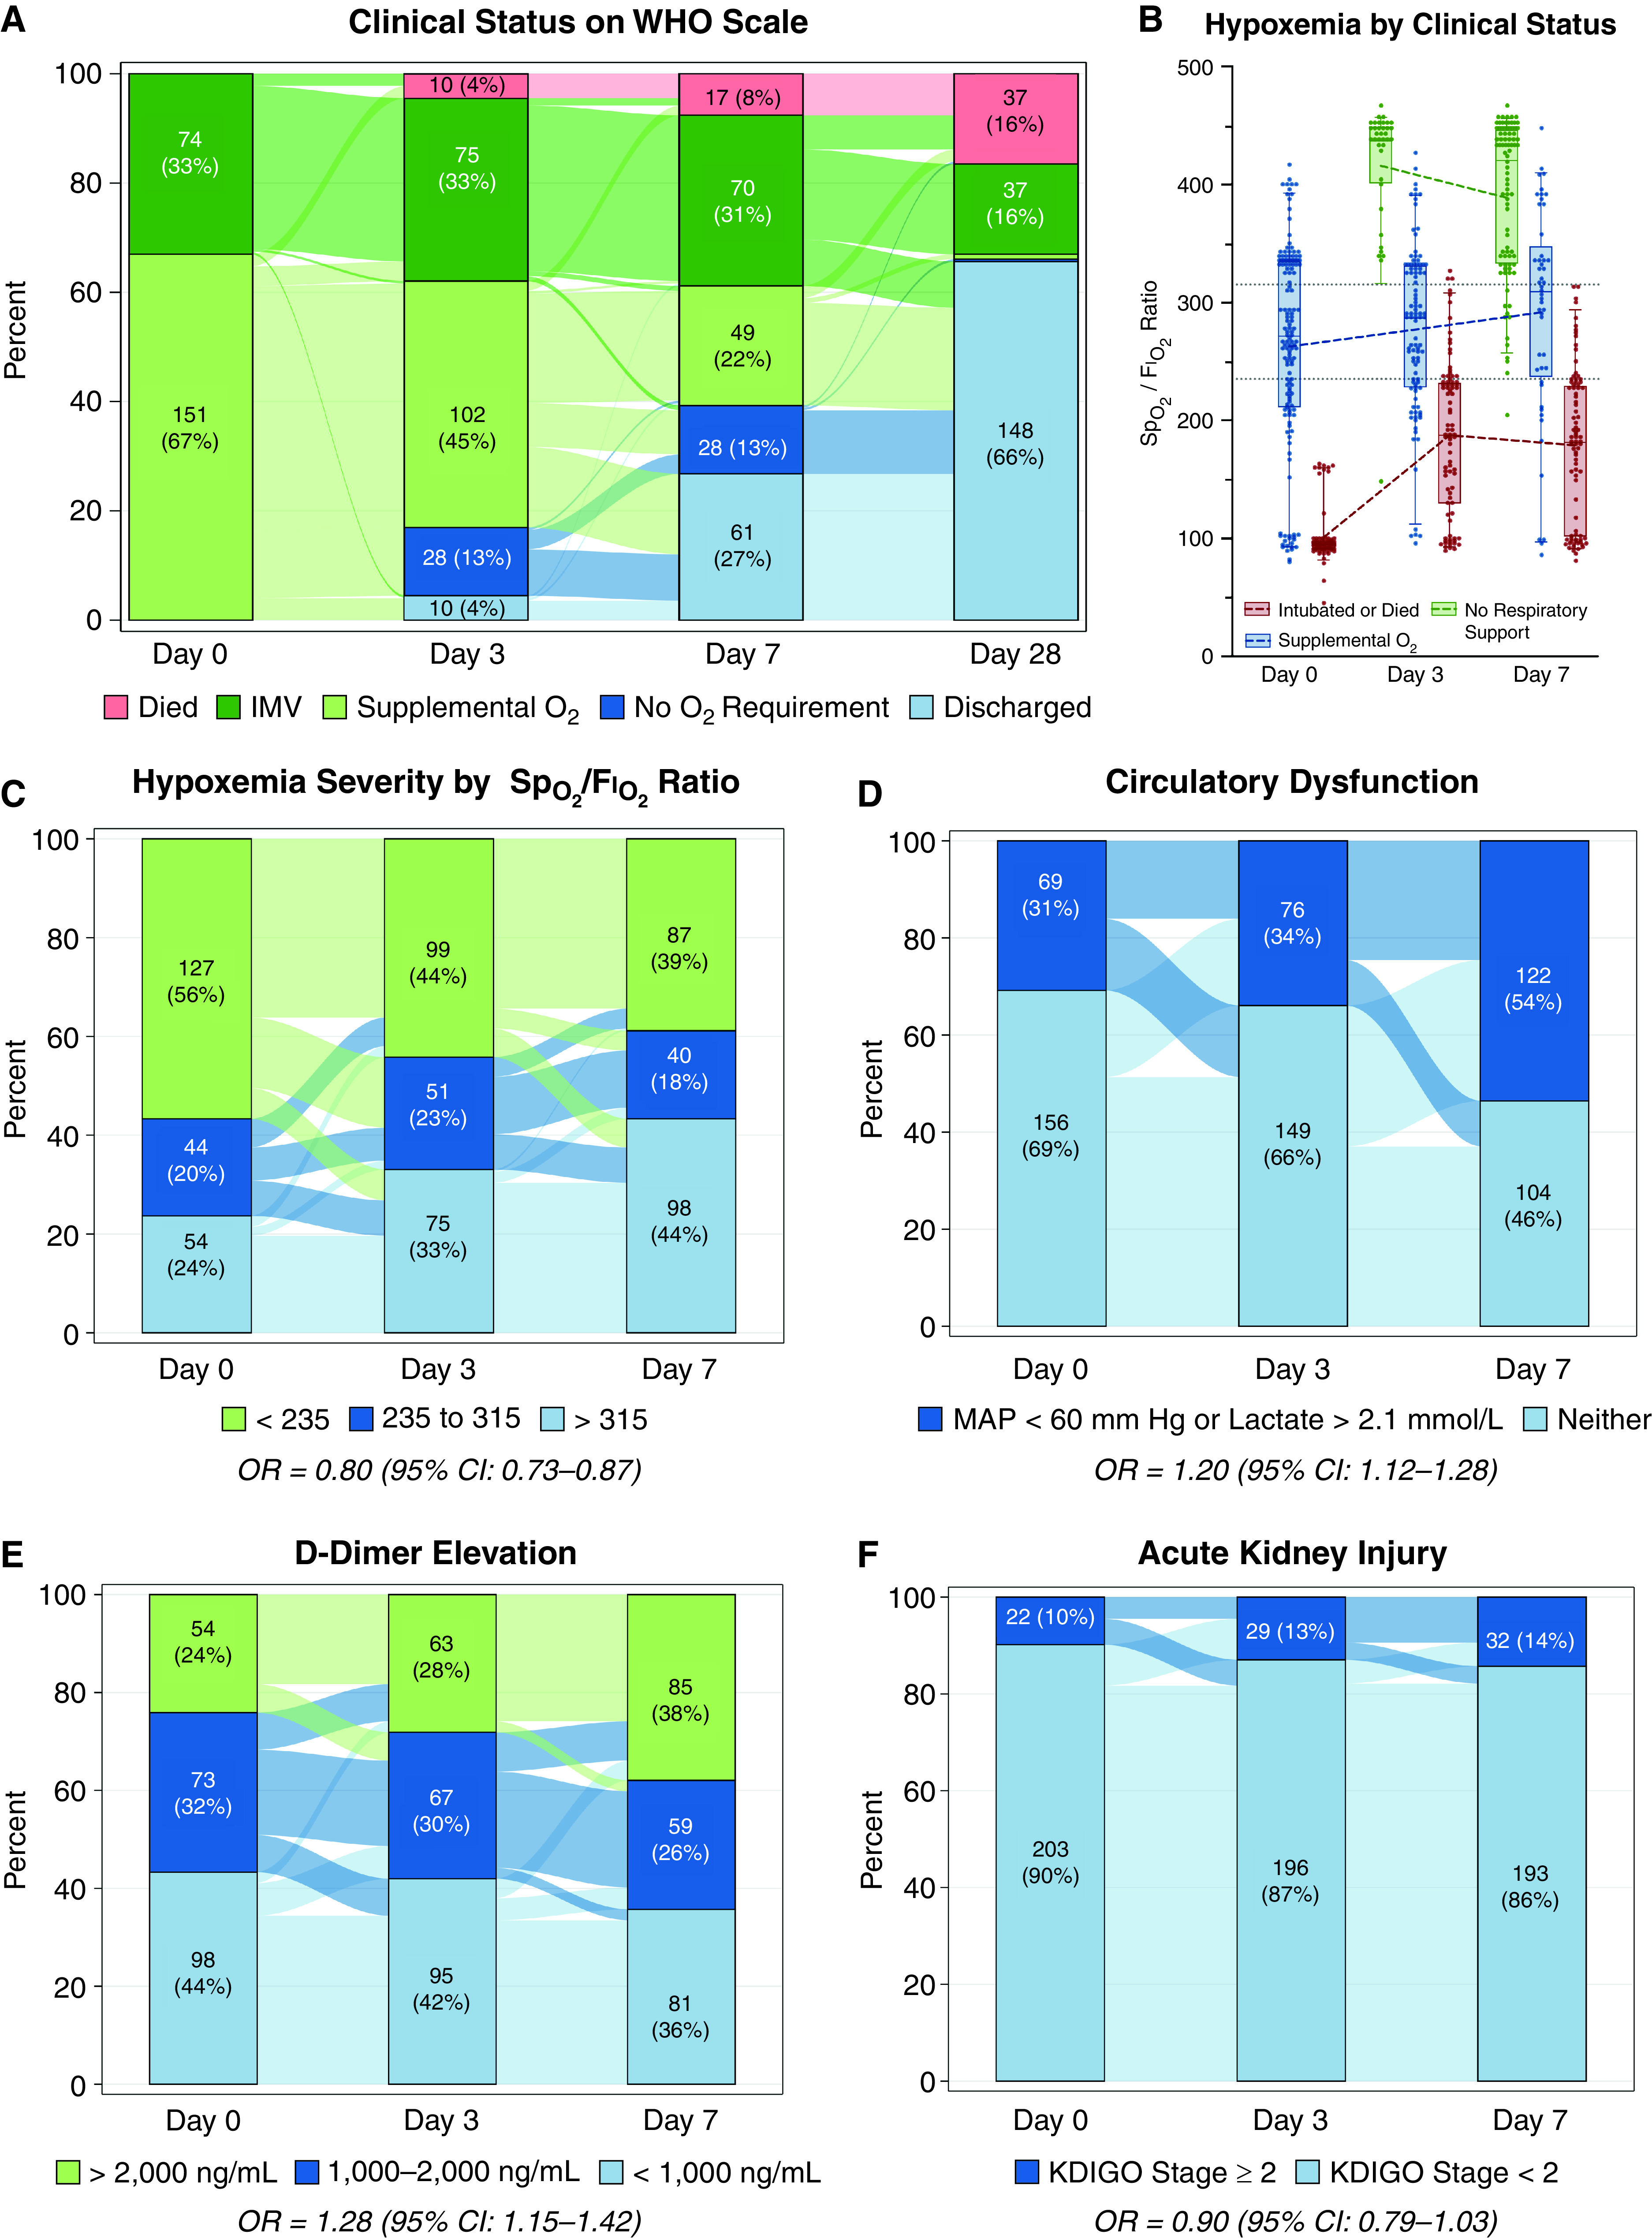
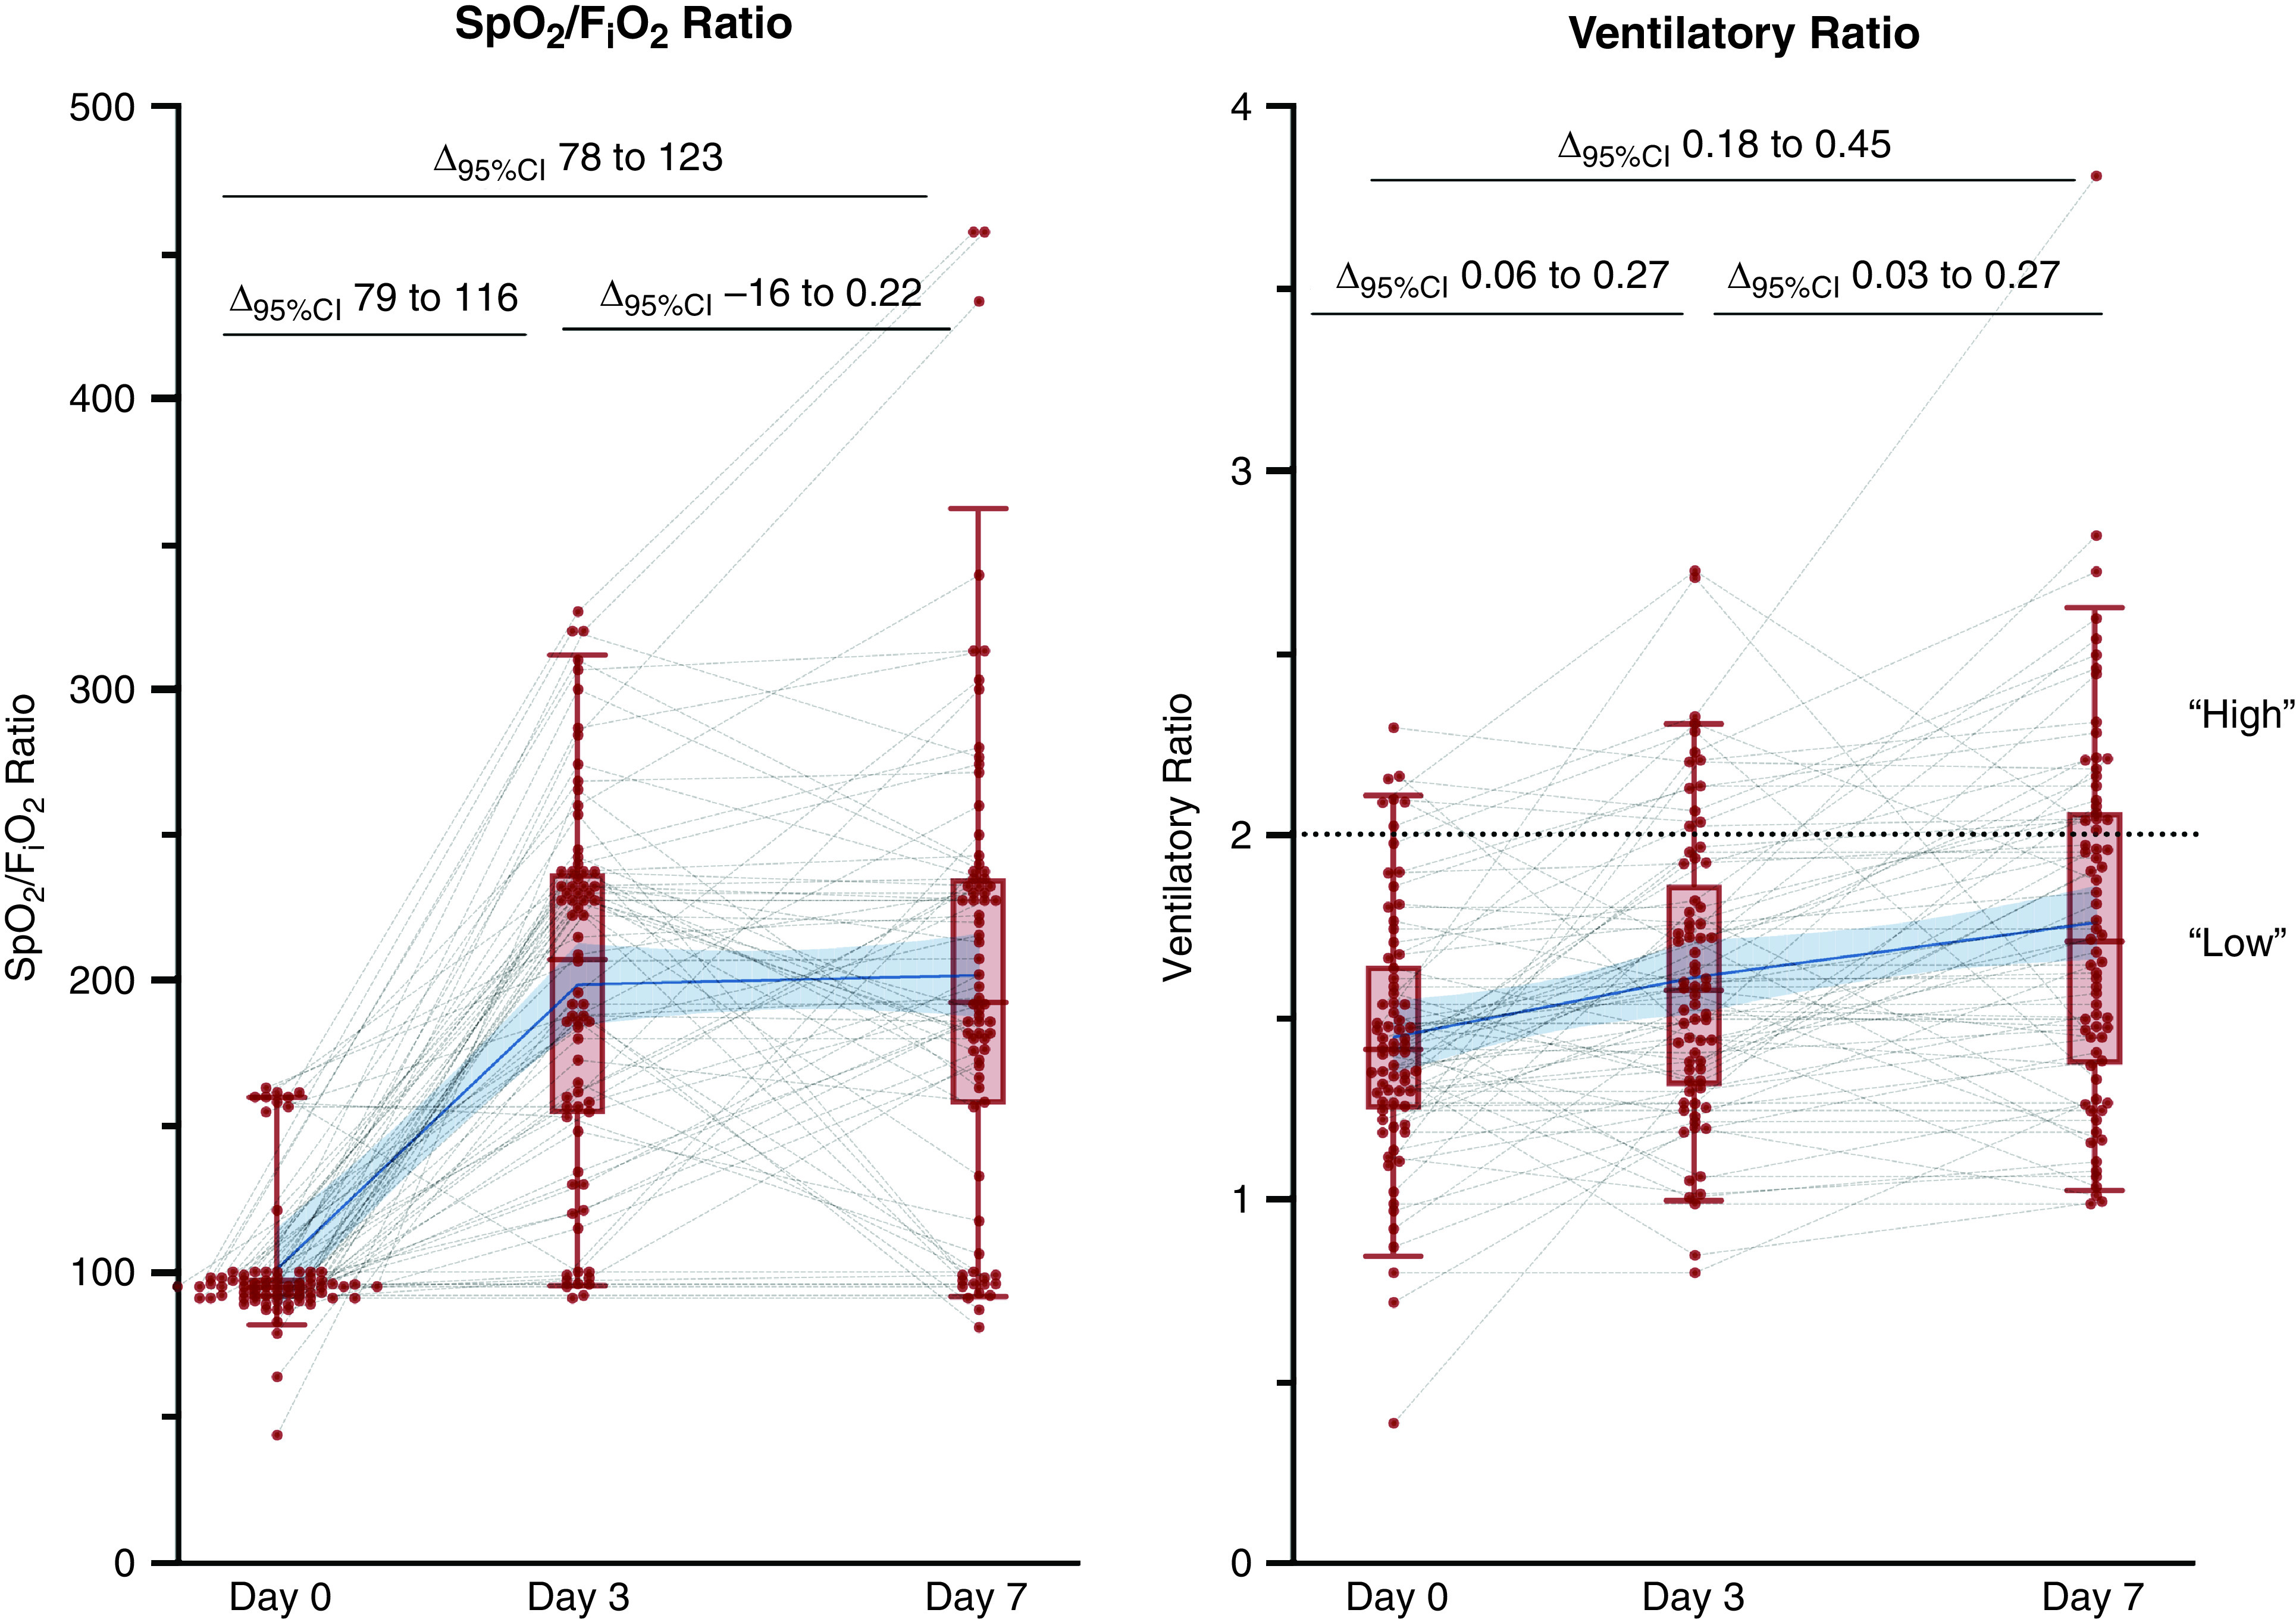
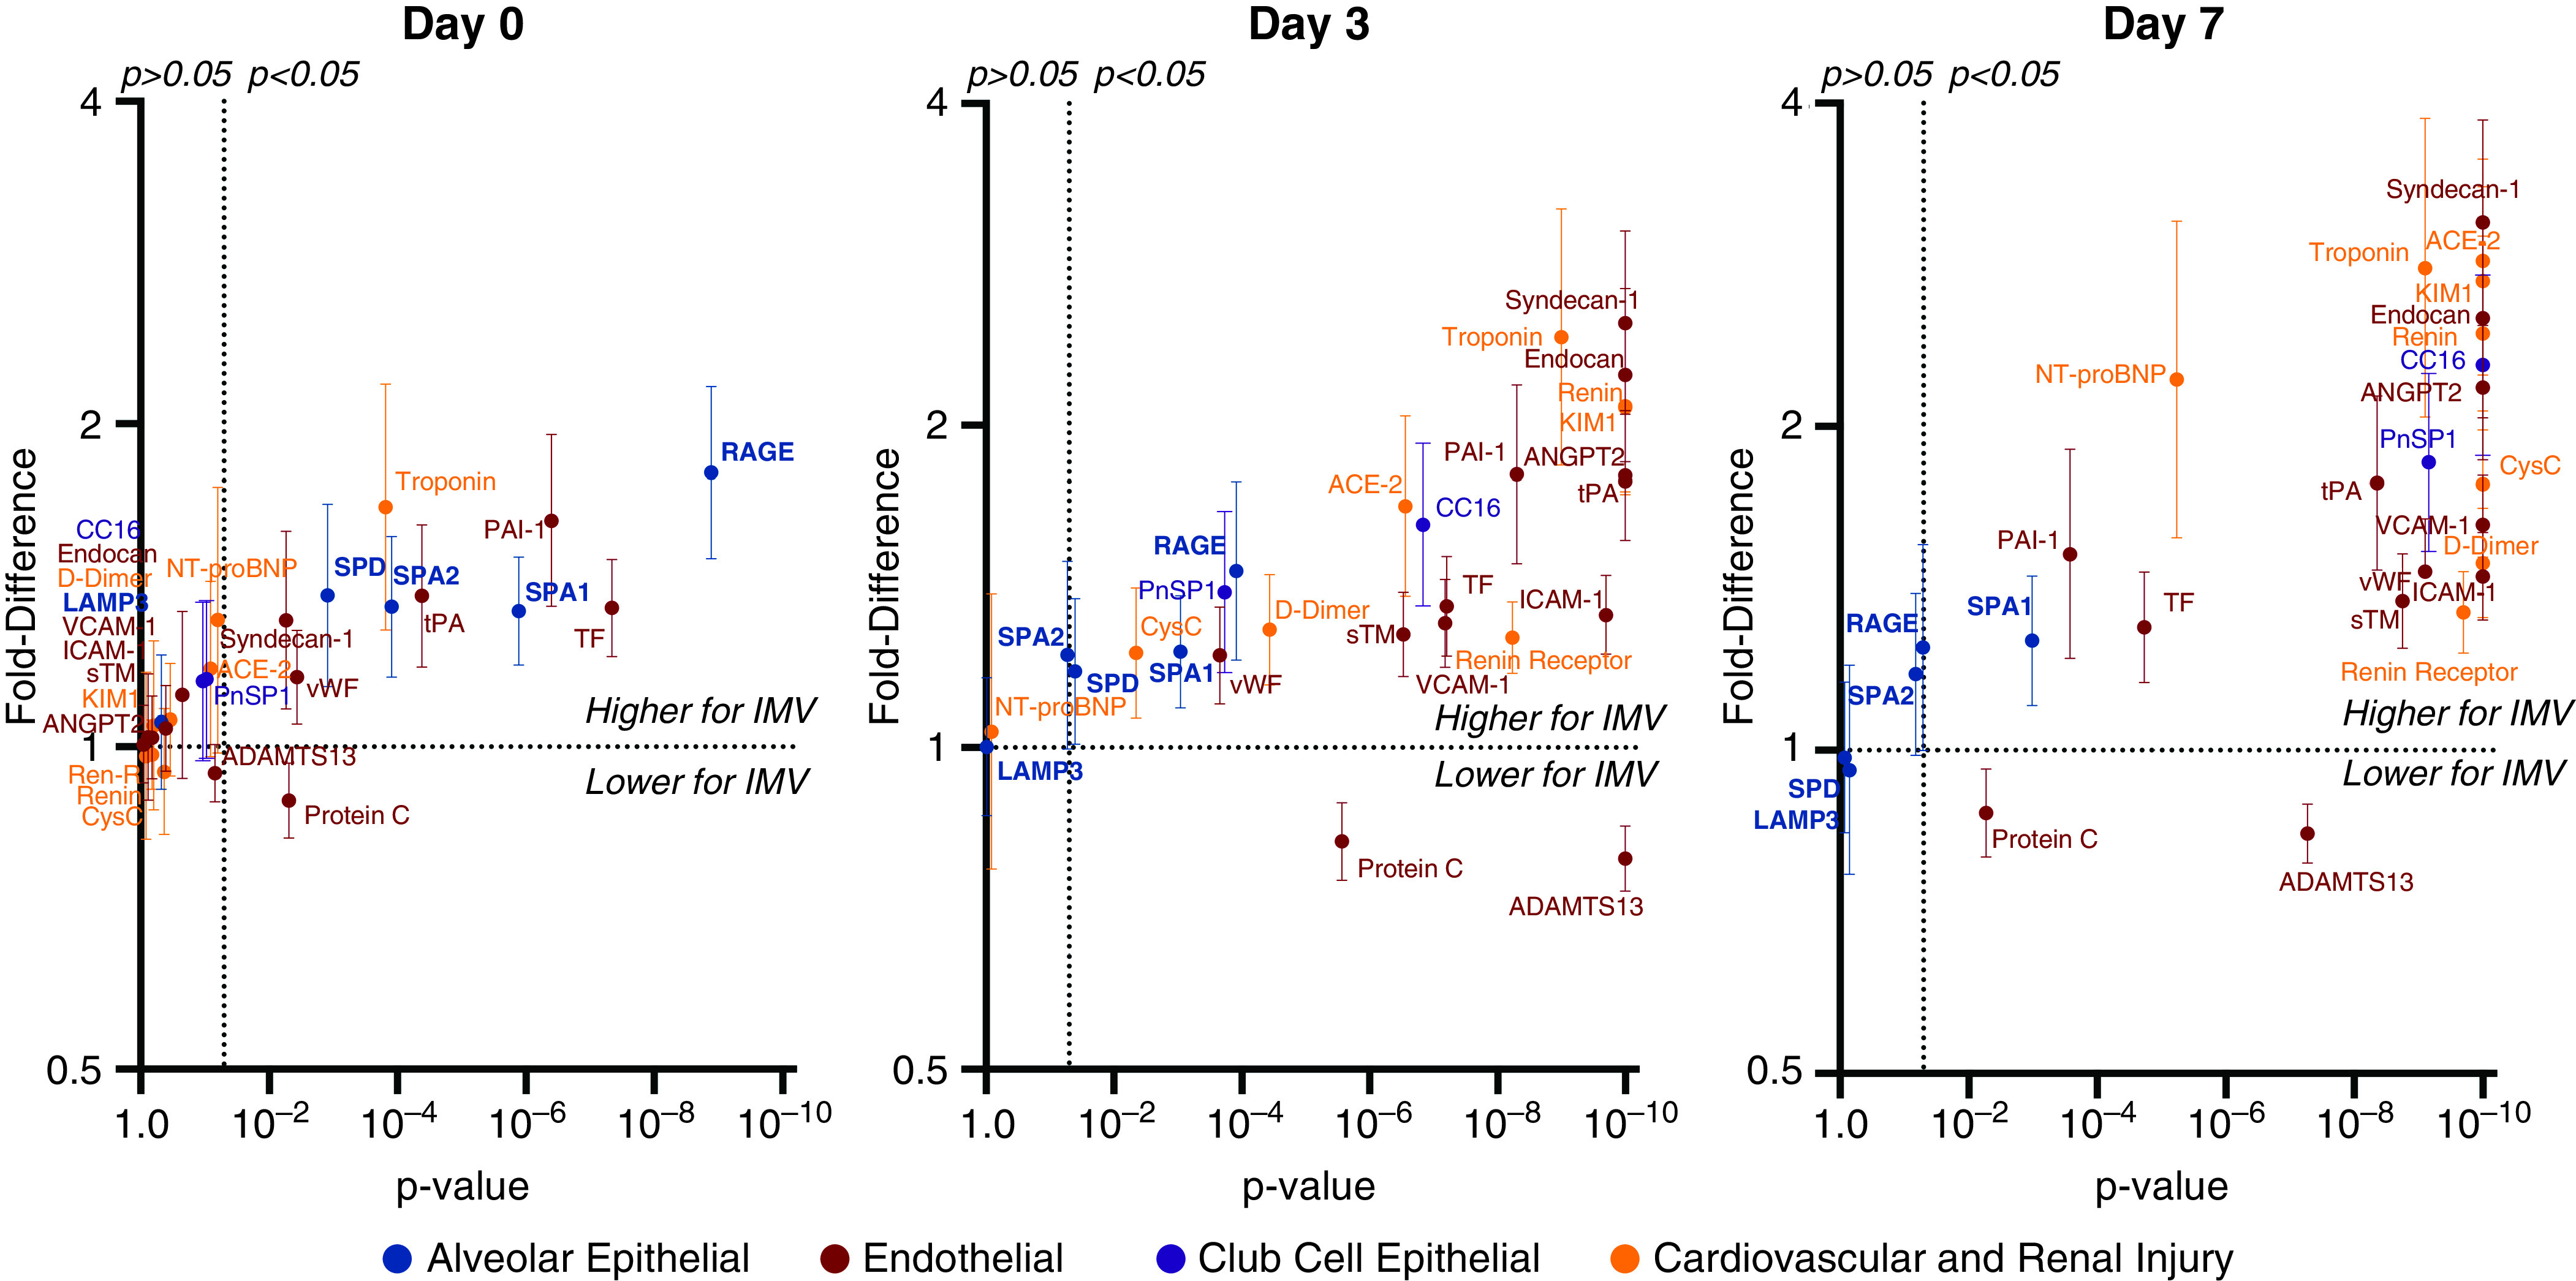
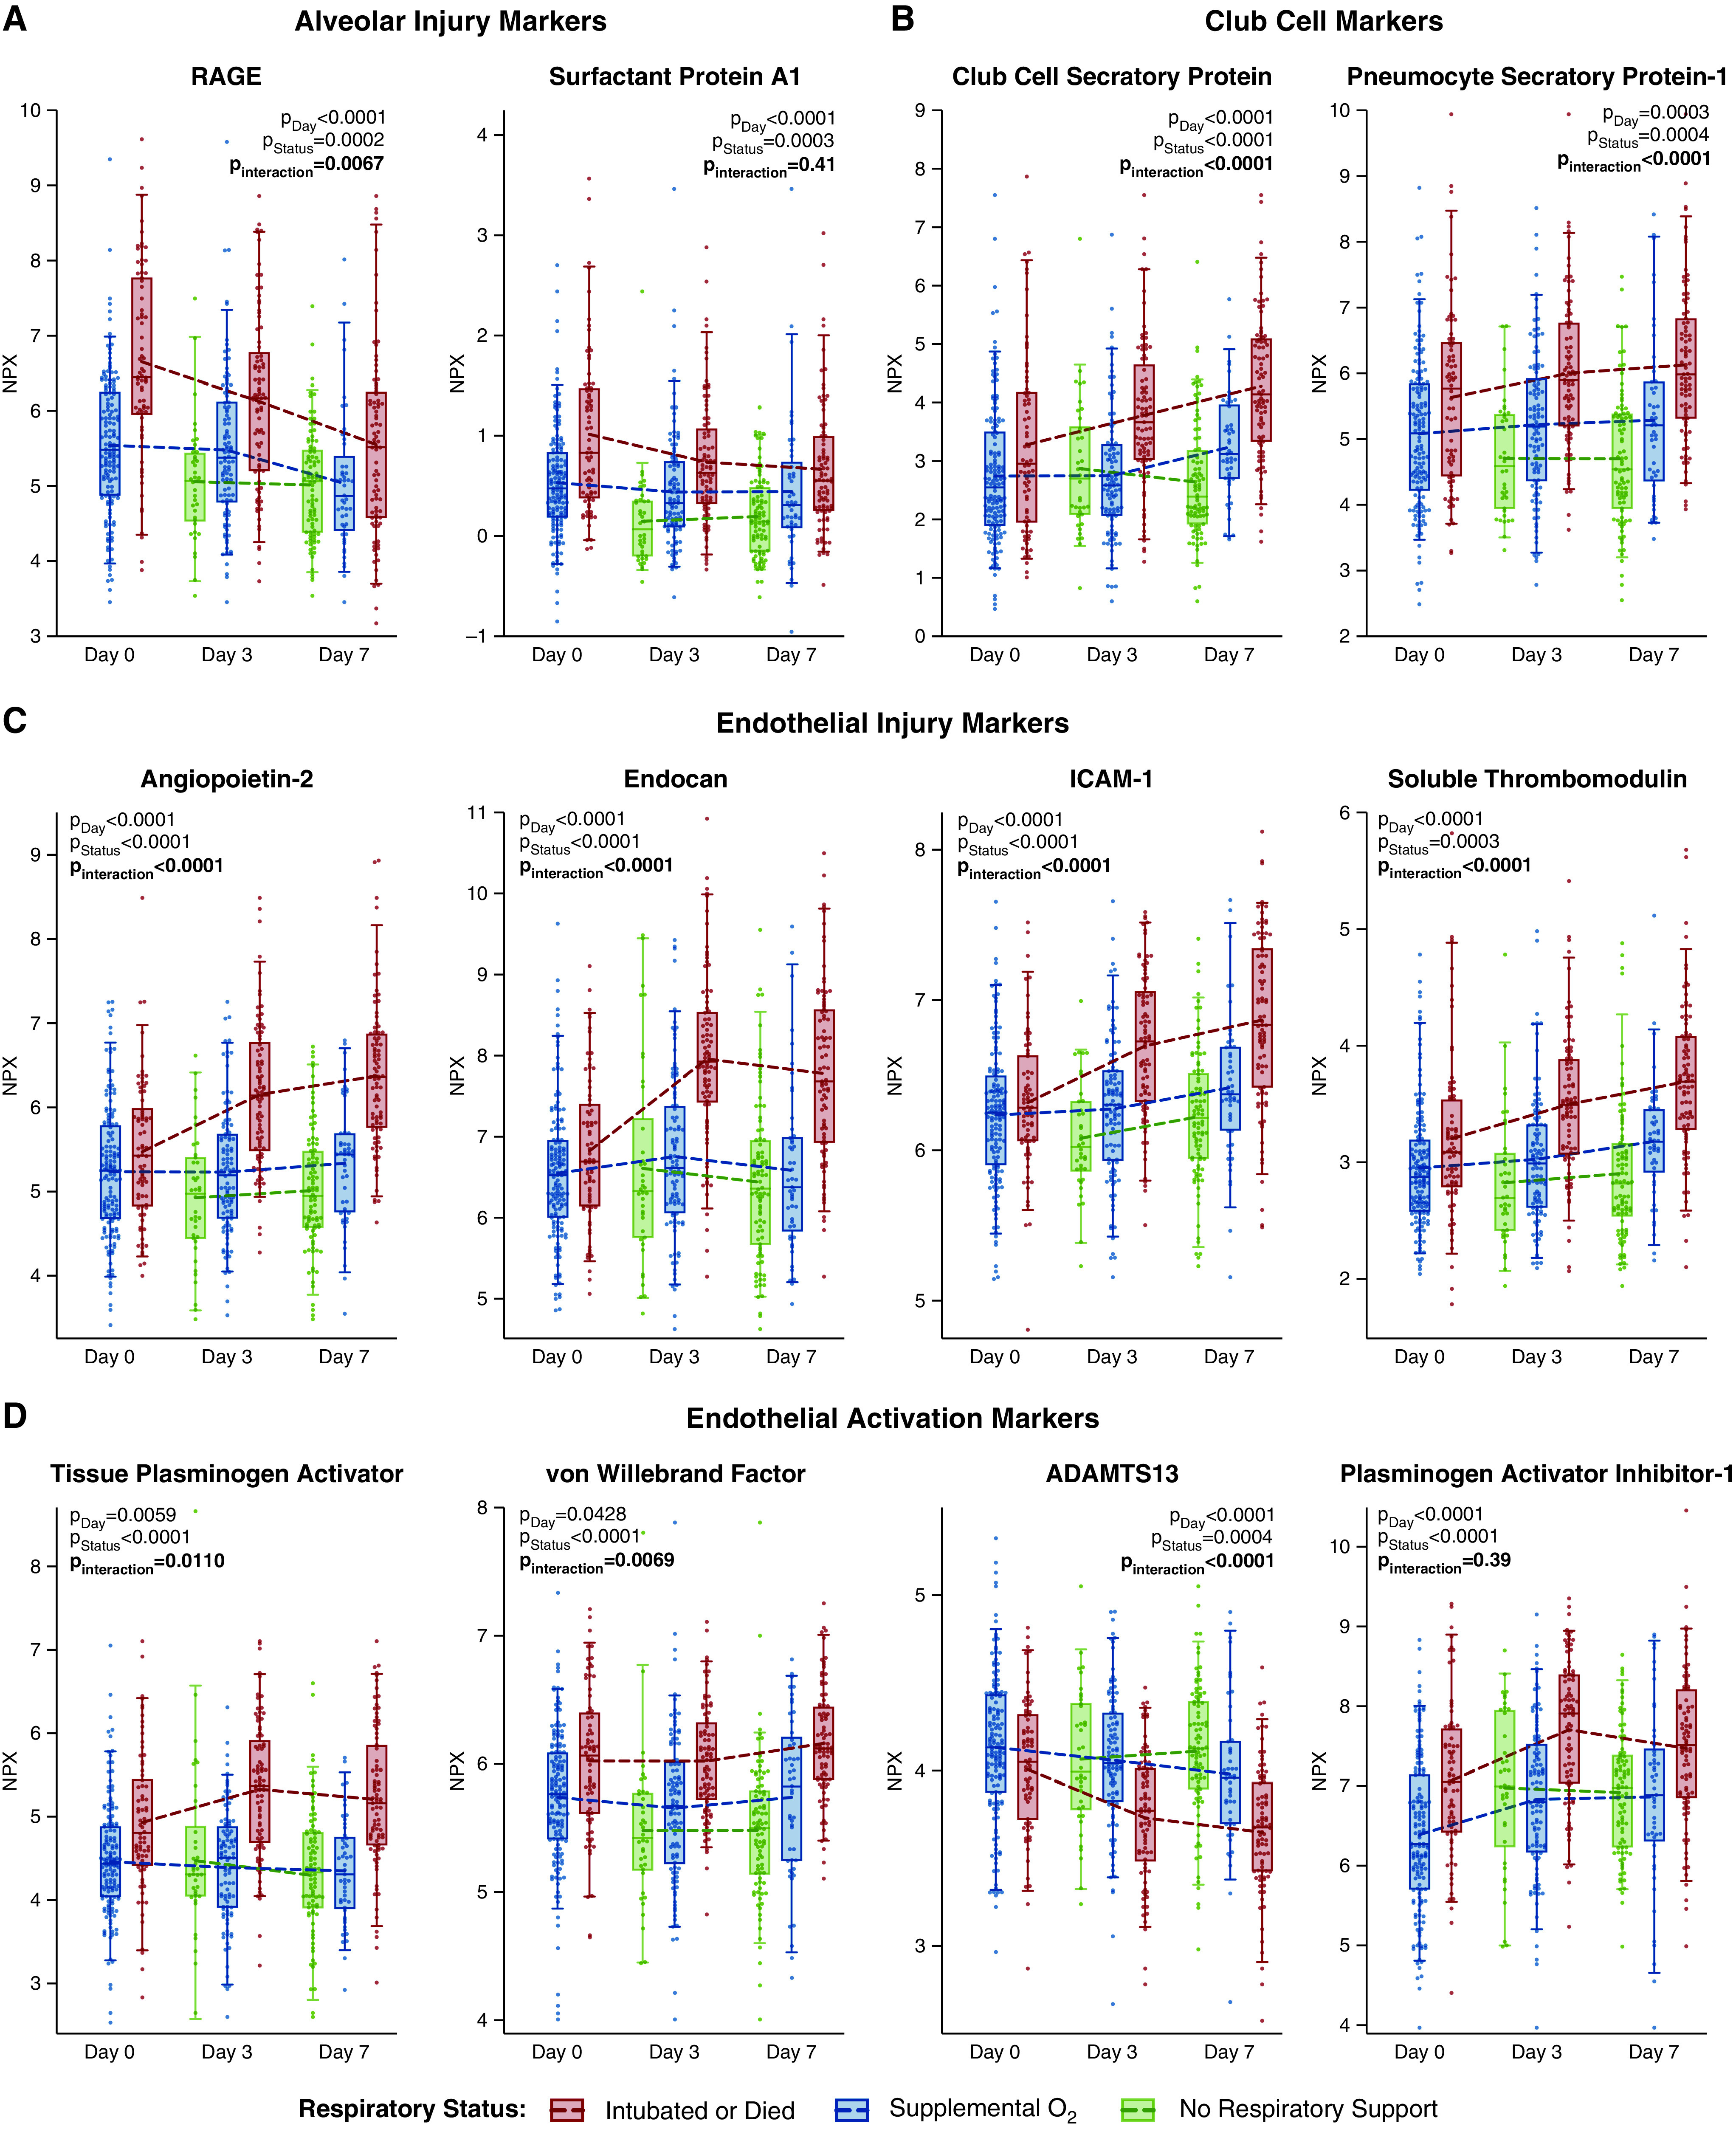
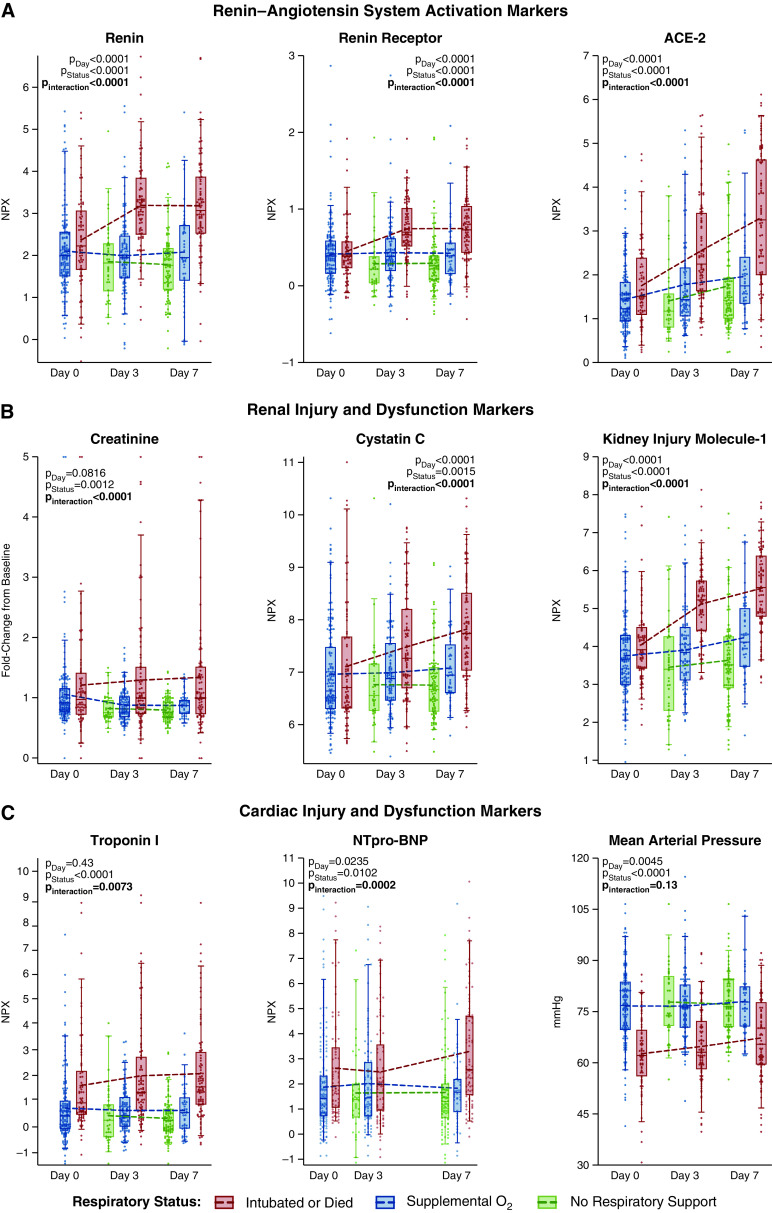
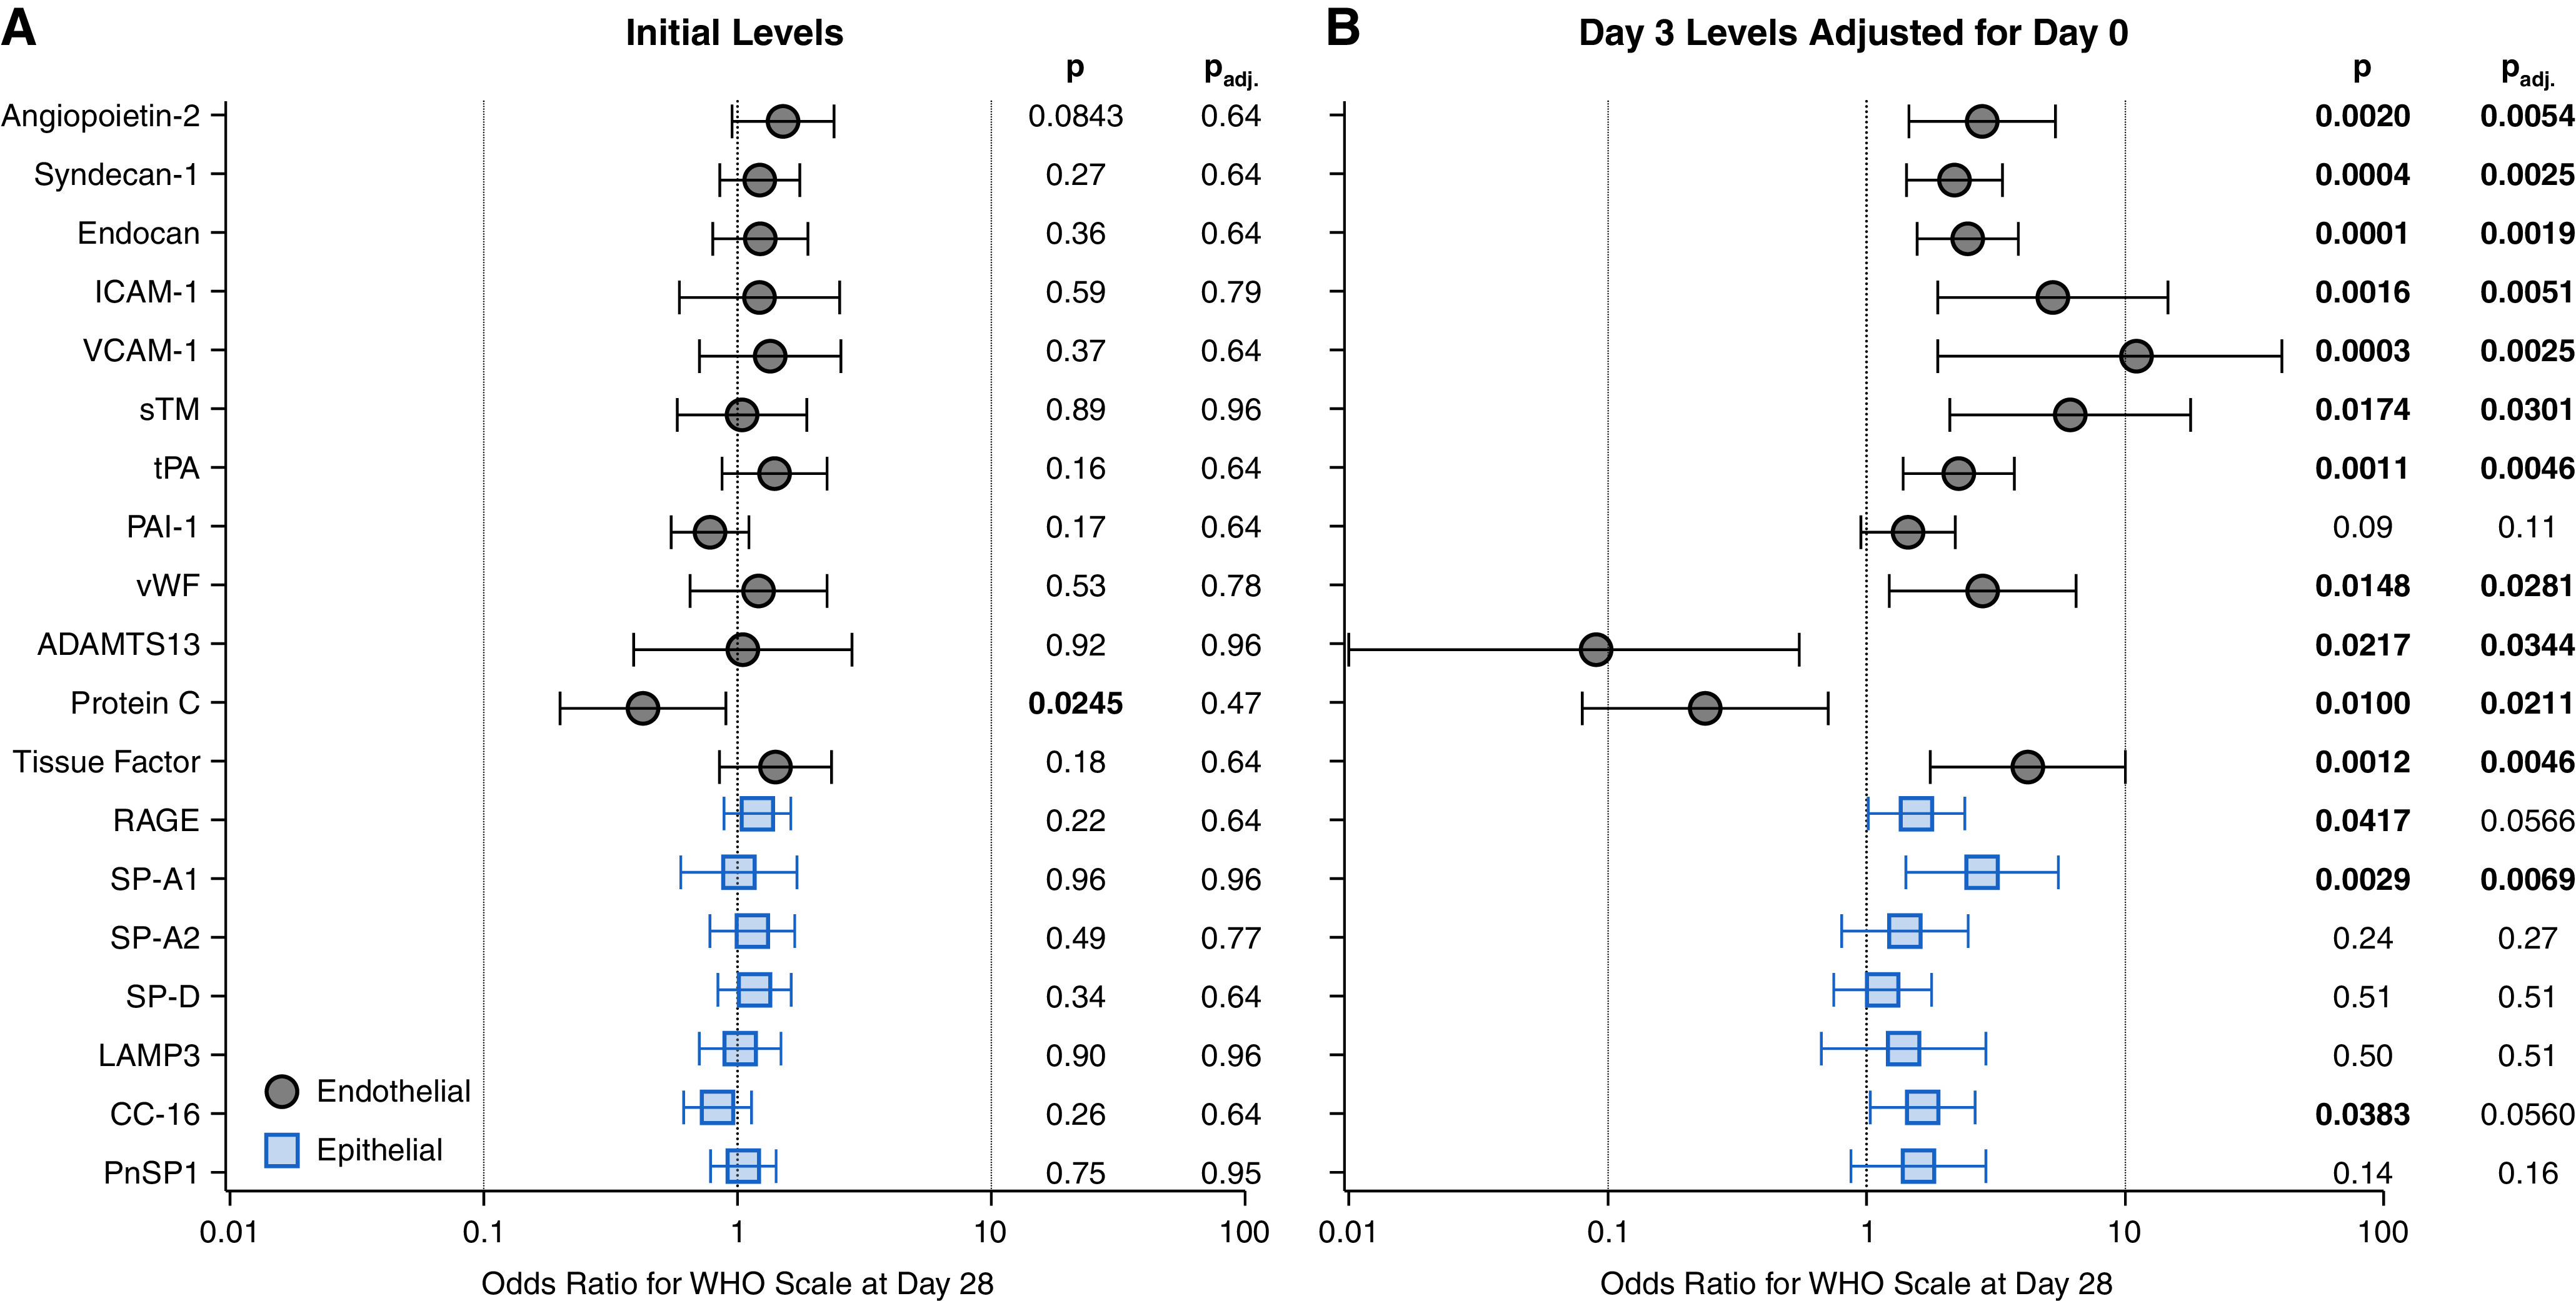
Rationale: Alveolar and endothelial injury may be differentially associated with coronavirus disease (COVID-19) severity over time. Objectives: To describe alveolar and endothelial injury dynamics and associations with COVID-19 severity, cardiorenovascular injury, and outcomes. Methods: This single-center observational study enrolled patients with COVID-19 requiring respiratory support at emergency department presentation. More than 40 markers of alveolar (including receptor for advanced glycation endproducts [RAGE]), endothelial (including angiopoietin-2), and cardiorenovascular injury (including renin, kidney injury molecule-1, and troponin-I) were serially compared between invasively and spontaneously ventilated patients using mixed-effects repeated-measures models. Ventilatory ratios were calculated for intubated patients. Associations of biomarkers with modified World Health Organization scale at Day 28 were determined with multivariable proportional-odds regression. Measurements and Main Results: Of 225 patients, 74 (33%) received invasive ventilation at Day 0. RAGE was 1.80-fold higher in invasive ventilation patients at Day 0 (95% confidence interval [CI], 1.50-2.17) versus spontaneous ventilation, but decreased over time in all patients. Changes in alveolar markers did not correlate with changes in endothelial, cardiac, or renal injury markers. In contrast, endothelial markers were similar to lower at Day 0 for invasive ventilation versus spontaneous ventilation, but then increased over time only among intubated patients. In intubated patients, angiopoietin-2 was similar (fold difference, 1.02; 95% CI, 0.89-1.17) to nonintubated patients at Day 0 but 1.80-fold higher (95% CI, 1.56-2.06) at Day 3; cardiorenovascular injury markers showed similar patterns. Endothelial markers were not consistently associated with ventilatory ratios. Endothelial markers were more often significantly associated with 28-day outcomes than alveolar markers. Conclusions: Alveolar injury markers increase early. Endothelial injury markers increase later and are associated with cardiorenovascular injury and 28-day outcome. Alveolar and endothelial injury likely contribute at different times to disease progression in severe COVID-19.

Keywords: COVID-19; alveolar epithelial cells; endothelium; renin-angiotensin system; respiratory distress syndrome.


Figures

Figure 1.
Figure 1.
Longitudinal clinical status and organ dysfunctions. (A) Longitudinal distribution of patients by modified World Health Organization (WHO) scale. Lines reflect the temporal redistribution or maintenance of patients between WHO scale levels. (B) Oxygen saturation as measured by pulse oximetry (SpO2)/FiO2 ratio for each patient at Day 0, 3, and 7 by level of respiratory support. Box, 25th to 75th percentiles; whiskers, 5th to 95th percentiles; dots, individual patients. (CF) Severity of hypoxemia, presence of circulatory dysfunction, degree of D-dimer elevation, and presence of stage 2 or higher acute kidney injury, respectively. Odds ratios (ORs) display the change in odds of most severe dysfunction per day in a simple mixed effects logistic model with subject as a random effect and day as a fixed effect. Plotted as in A. CI = confidence interval; IMV = invasive mechanical ventilation; KDIGO = Kidney Disease: Improving Global Outcomes; MAP = mean arterial pressure. Panel A adapted by permission from Reference 9.
Figure 2.
Figure 2.
Oxygen saturation as measured by pulse oximetry (SpO2)/FiO2 and ventilatory ratios over time among patients who were invasively ventilated at Day 0. Gray dotted lines show individual patients’ trajectories. Red dots are individual patient data points. Δ95% indicates the 95% confidence interval (CI) for average slope between the two corresponding time points (Day 0, Day 3, or Day 7). Blue line and shaded area indicate mean slope between time points and 95% CI for the mean, respectively. The dotted horizontal line on the ventilatory ratio graph demarcates ventilatory ratios > 2.0, which are considered high.
Figure 3.
Figure 3.
Differences in alveolar, endothelial, club cell, and cardiovascular injury markers among intubated versus nonintubated patients with coronavirus disease (COVID-19) at Day 0, 3, and 7. Multivariable estimates expressed as fold difference in biomarker levels between patients who were invasively ventilated or who died (n = 74) versus patients who were alive and ventilating spontaneously (n = 151), by study day. The y-axis shows the fold difference in biomarker level and the x-axis the P value. Error bars indicate the 95% confidence interval for the fold difference. The horizontal dotted lines indicate a fold difference of 1.0 (no difference). The vertical dotted lines indicate P = 0.05. IMV = invasive mechanical ventilation.
Figure 4.
Figure 4.
Plasma levels of alveolar injury, endothelial activation, and endothelial injury markers show distinct patterns over time. Representative markers of (A) alveolar, (B) club cell, and (C and D) endothelial injury and activation over the study period by level of respiratory support. P values indicate the statistical hypothesis tests from the multivariable mixed-effects repeated measures models for class differences by time in study (day), level of respiratory support (status), and whether respiratory support level is an effect modifier for time (interaction). Each dot represents an individual patient. Box, 25th to 75th percentiles; whiskers, 5th to 95th percentiles. Dashed lines connect the means at each time point. Normalized protein expression (NPX) units are on a log2 scale (i.e., a 1-unit increase corresponds to a doubling in level). ADAMTS13 = a disintegrin and metalloproteinase with thrombospondin motifs 13; ICAM-1 = intercellular adhesion molecule 1; RAGE = receptor for advanced glycation endproducts.
Figure 5.
Figure 5.
Plasma levels of renin–angiotensin system activation, cardiac injury, and renal injury markers over time show patterns similar to endothelial markers. Representative markers of (A) renin–angiotensin system activation, and (B and C) cardiorenal injury and dysfunction over the study period by level of respiratory support. P values indicate the results of the statistical hypothesis tests from the multivariable mixed-effects repeated measures models for class differences by time in study (day), level of respiratory support (status), and whether respiratory support level is an effect modifier for time (interaction). Each dot represents an individual patient. Box, 25th to 75th percentiles; whiskers, 5th to 95th percentiles. Dashed lines connect the means at each time point. Normalized protein expression (NPX) units are on a log2 scale (i.e., a 1-unit increase corresponds to a doubling in level). ACE-2 = angiotensin-converting enzyme-2; NT-proBNP = N-terminal pro-brain natriuretic peptide.
Figure 6.
Figure 6.
Association of initial levels and changes in level of plasma epithelial and endothelial markers with 28-day clinical outcome. Adjusted odds ratios of 12 endothelial and 7 pulmonary epithelial markers based on multivariable proportional odds models for modified World Health Organization (WHO) status at Day 28 for (A) Day 0 levels, and (B) changes in marker level from Day 0 to Day 3. Response levels were died (n = 37, 16%), invasive mechanical ventilation (n = 37, 16%), or off mechanical ventilation (n = 151, 67%; 148 [98%] of whom were discharged alive from the hospital at Day 28). The response is coded in ascending order such that a higher odds ratio indicates worse clinical status at Day 28. All models adjusted for age, sex, body mass index, initial Sequential Organ Failure Assessment (SOFA) score, heart failure, chronic kidney disease, and chronic obstructive pulmonary disease. Error bars, 95% confidence intervals. The right-hand columns display the model estimated P value (P) and the P value after a false-discovery rate correction (Padj). ADAMTS13 = a disintegrin and metalloproteinase with thrombospondin motifs 13; CC-16 = club cell secretory protein; ICAM-1 = intercellular adhesion molecule 1; LAMP3 = lysosome-associated membrane glycoprotein 3; PAI-1 = plasminogen activator inhibitor 1; PnSP1 = pneumocyte secretory protein 1; RAGE = receptor for advanced glycation endproducts; SP-A1 = pulmonary surfactant-associated protein A1; SP-A2 = pulmonary surfactant-associated protein A2; SP-D = pulmonary surfactant-associated protein D; sTM = soluble thrombomodulin; tPA = tissue-type plasminogen activator; VCAM-1 = vascular cell adhesion protein 1; vWF = von Willebrand factor.

Comment in

References

    1. Matthay MA, Zemans RL, Zimmerman GA, Arabi YM, Beitler JR, Mercat A, et al. Acute respiratory distress syndrome. Nat Rev Dis Primers . 2019;5:18. - PMC - PubMed
    1. Wilson JG, Calfee CS. ARDS Subphenotypes: understanding a Heterogeneous Syndrome. Crit Care . 2020;24:102. - PMC - PubMed
    1. Calfee CS, Janz DR, Bernard GR, May AK, Kangelaris KN, Matthay MA, et al. Distinct molecular phenotypes of direct vs indirect ARDS in single-center and multicenter studies. Chest . 2015;147:1539–1548. - PMC - PubMed
    1. Iba T, Levy JH, Levi M, Connors JM, Thachil J. Coagulopathy of coronavirus disease 2019. Crit Care Med . 2020;48:1358–1364. - PMC - PubMed
    1. Reynolds AS, Lee AG, Renz J, DeSantis K, Liang J, Powell CA, et al. Pulmonary vascular dilatation detected by automated transcranial Doppler in COVID-19 pneumonia. Am J Respir Crit Care Med . 2020;202:1037–1039. - PMC - PubMed

Publication types