. 2021 Dec 8;19(12):e3001483.
doi: 10.1371/journal.pbio.3001483. eCollection 2021 Dec.

The 3-phosphoinositide-dependent protein kinase 1 is an essential upstream activator of protein kinase A in malaria parasites

Affiliations

The 3-phosphoinositide-dependent protein kinase 1 is an essential upstream activator of protein kinase A in malaria parasites

Eva Hitz et al. PLoS Biol. .

Abstract

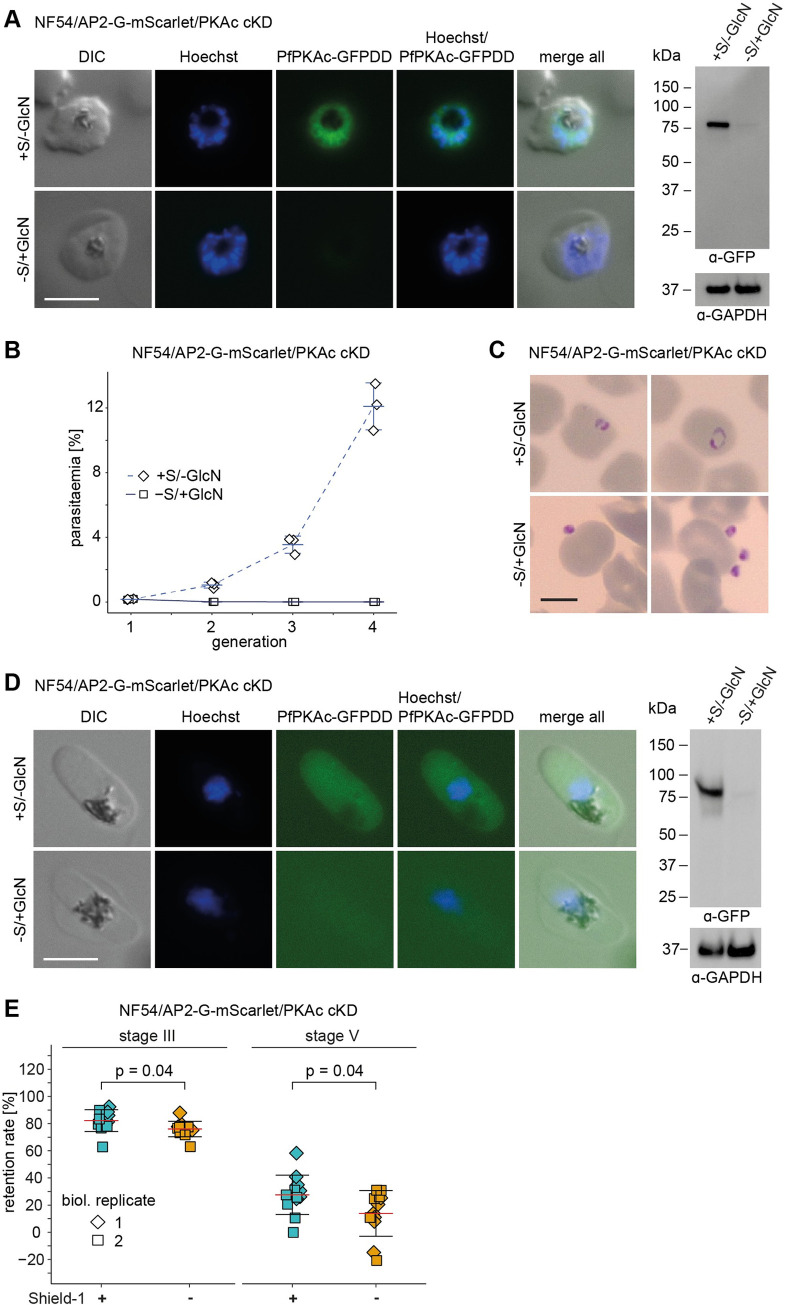
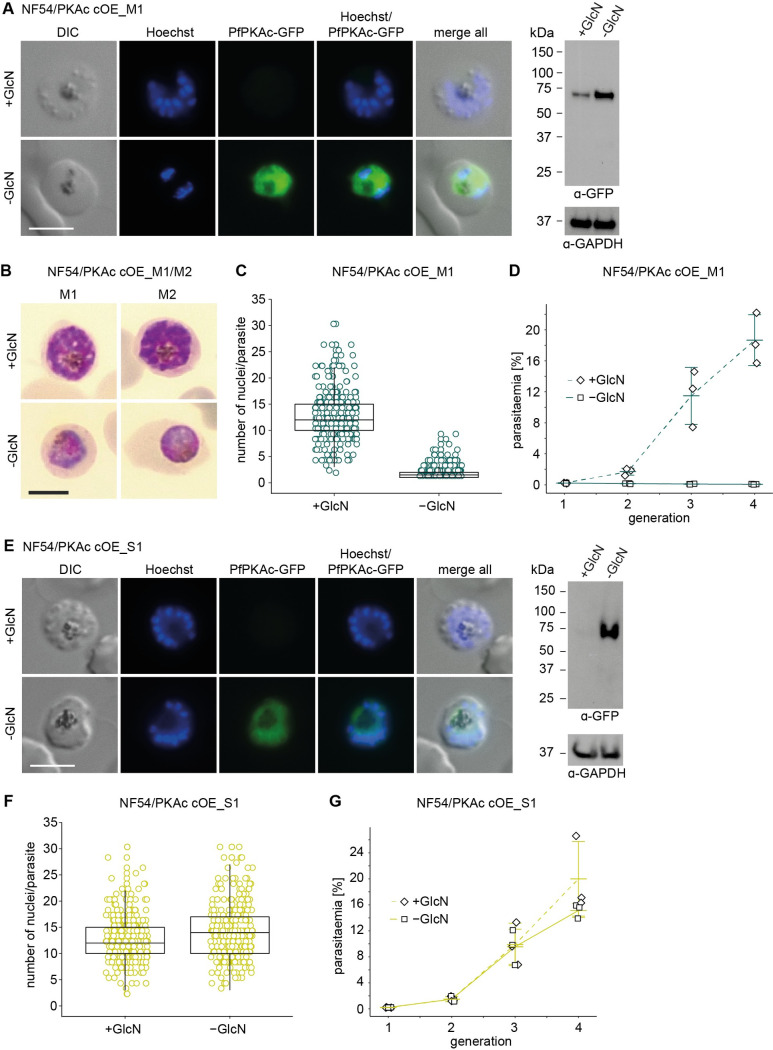
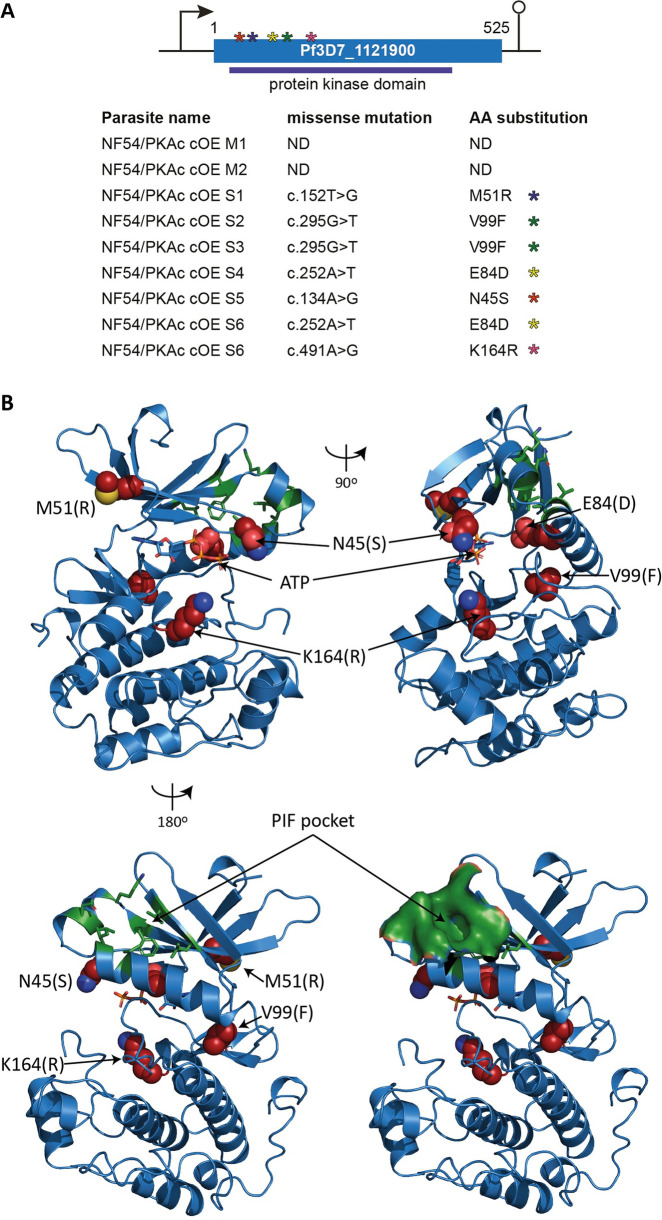
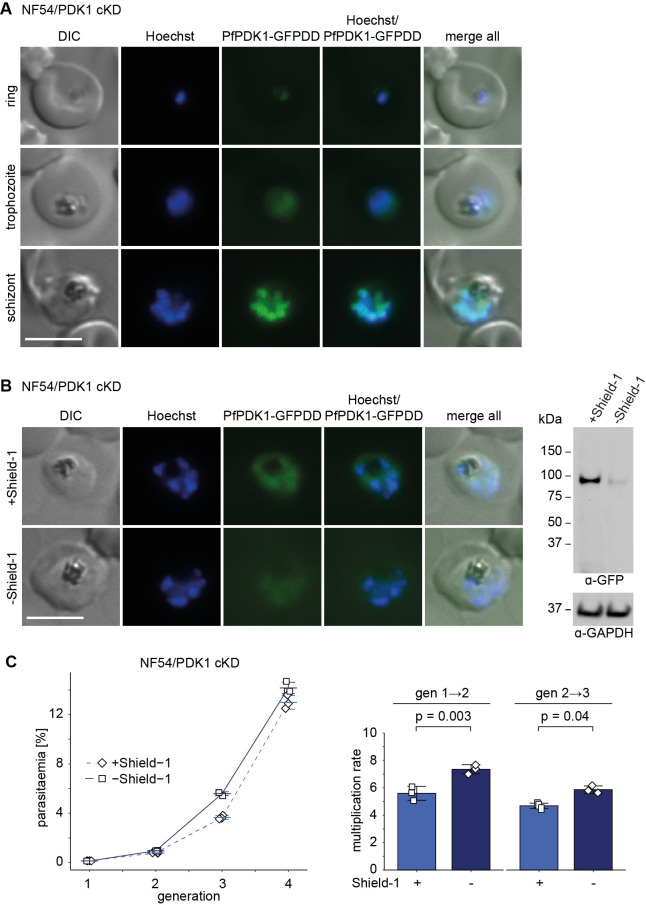
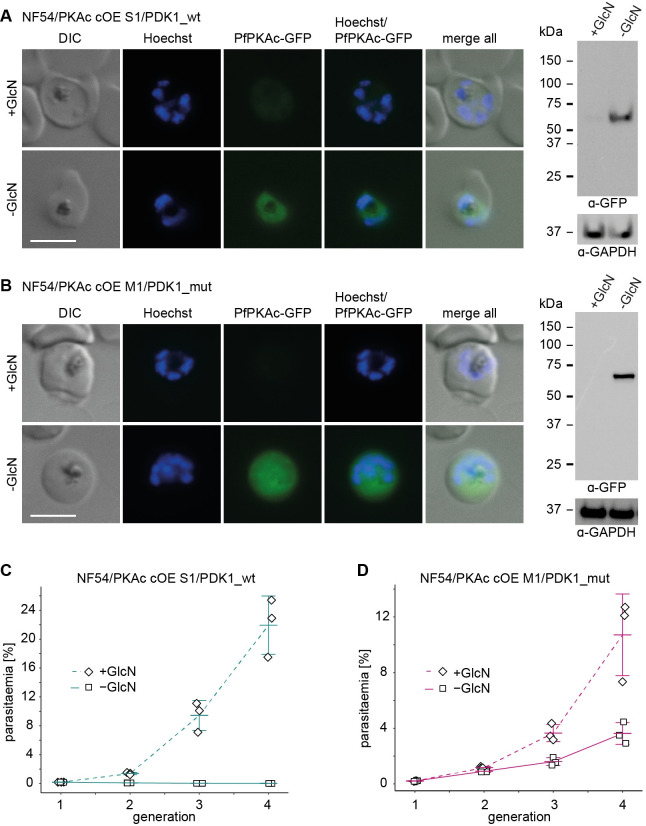
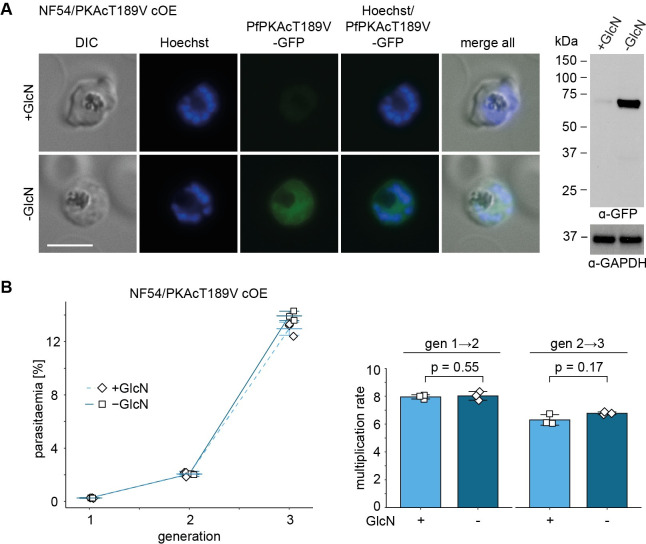
Cyclic adenosine monophosphate (cAMP)-dependent protein kinase A (PKA) signalling is essential for the proliferation of Plasmodium falciparum malaria blood stage parasites. The mechanisms regulating the activity of the catalytic subunit PfPKAc, however, are only partially understood, and PfPKAc function has not been investigated in gametocytes, the sexual blood stage forms that are essential for malaria transmission. By studying a conditional PfPKAc knockdown (cKD) mutant, we confirm the essential role for PfPKAc in erythrocyte invasion by merozoites and show that PfPKAc is involved in regulating gametocyte deformability. We furthermore demonstrate that overexpression of PfPKAc is lethal and kills parasites at the early phase of schizogony. Strikingly, whole genome sequencing (WGS) of parasite mutants selected to tolerate increased PfPKAc expression levels identified missense mutations exclusively in the gene encoding the parasite orthologue of 3-phosphoinositide-dependent protein kinase-1 (PfPDK1). Using targeted mutagenesis, we demonstrate that PfPDK1 is required to activate PfPKAc and that T189 in the PfPKAc activation loop is the crucial target residue in this process. In summary, our results corroborate the importance of tight regulation of PfPKA signalling for parasite survival and imply that PfPDK1 acts as a crucial upstream regulator in this pathway and potential new drug target.


Conflict of interest statement

The authors have declared that no competing interests exist.

Figures

Fig 1
Fig 1. Depletion of PfPKAc in NF54/AP2-G-mScarlet/PKAc cKD parasites leads to a block in merozoite invasion and decreases gametocyte rigidity.
(A) Expression of PfPKAc-GFPDD in late schizonts under protein- and RNA-depleting (–Shield-1/+GlcN) and control conditions (+Shield-1/–GlcN) as assessed by live cell fluorescence imaging and western blot analysis. Synchronous parasites (0 to 8 hpi) were split (±Shield-1/±GlcN) 40 hours before sample collection. Representative fluorescence images are shown. Parasite DNA was stained with Hoechst. Scale bar = 5 μm. For western blot analysis, parasite lysates derived from equal numbers of parasites were loaded per lane. MW PfPKAc-GFPDD = 79.8 kDa, MW PfGAPDH = 36.6 kDa. The full size western blot is shown in S1 Fig. (B) Increase in parasitaemia over 3 generations under PfPKAc-GFPDD-depleting (–Shield-1/+GlcN) and control conditions (+Shield-1/–GlcN). Open squares represent data points for individual replicates and the means and SD (error bars) of 3 biological replicates are shown. The raw data are available in the source data file (S2 Data). (C) Representative images from Giemsa-stained thin blood smears showing the progeny of parasites cultured under PfPKAc-GFPDD-depleting (–Shield-1/+GlcN) or control conditions (+Shield-1/–GlcN) conditions at 0 to 6 hpi (generation 2). Scale bar = 5 μm. (D) Expression of PfPKAc-GFPDD in stage V gametocytes (day 11) under protein- and RNA-depleting (–Shield-1/+GlcN) and control conditions (+Shield-1/–GlcN) as assessed by live cell fluorescence imaging and western blot analysis. Representative fluorescence images are shown. Parasite DNA was stained with Hoechst. Scale bar = 5 μm. For western blot analysis, parasite lysates derived from equal numbers of parasites were loaded per lane. MW PfPKAc-GFPDD = 79.8 kDa, MW PfGAPDH = 36.6 kDa. The full size western blot is shown in S4 Fig. (E) Retention rates of stage III (day 6) and stage V (day 11) gametocytes cultured under PfPKAc-GFPDD-depleting (–Shield-1) (orange) and control conditions (+Shield-1) (blue). Coloured squares represent data points for individual replicates and the means and SD (error bars) of 2 biological replicates performed in 6 technical replicates each are shown. Differences in retention rates have been compared using an unpaired 2-tailed Student t test (statistical significance cutoff: p < 0.05). The raw data are available in the source data file (S2 Data). cKD, conditional PfPKAc knockdown; DIC, differential interference contrast; GlcN, glucosamine; hpi, hours postinvasion; PKA, protein kinase A; S, Shield-1.
Fig 2
Fig 2. Overexpression of PfPKAc in NF54/PKAc cOE M1 parasites is lethal but survivor populations tolerant to PfPKAc OE can be selected.
(A) Expression of PfPKAc-GFP in NF54/PKAc cOE M1 parasites under OE-inducing (–GlcN) and control conditions (+GlcN) as assessed by live cell fluorescence imaging and western blot analysis. Synchronous parasites (0 to 8 hpi) were split (±GlcN) 40 hours before sample collection. Representative fluorescence images are shown. Parasite DNA was stained with Hoechst. Scale bar = 5 μm. For western blot analysis, lysates derived from equal numbers of parasites were loaded per lane. MW PfPKAc-GFP = 67.3 kDa, MW PfGAPDH = 36.6 kDa. The full size western blot is shown in S6 Fig. (B) Representative images from Giemsa-stained thin blood smears showing NF54/PKAc cOE M1 and M2 parasites under PfPKAc-GFP OE-inducing (–GlcN) and control conditions (+GlcN). Synchronous parasites (0 to 8 hpi) were split (±GlcN) 40 hours before the images were captured. Scale bar = 5 μm. (C) Number of nuclei per schizont in NF54/PKAc cOE M1 parasites under PfPKAc-GFP OE-inducing (–GlcN) and control conditions (+GlcN). Each open circle represents one parasite. Data from 3 biological replicate experiments are shown, and 100 parasites were counted in each experiment. The boxplots show data distribution (median, upper, and lower quartile and whiskers). The raw data are available in the source data file (S2 Data). (D) Increase in parasitaemia in NF54/PKAc cOE M1 parasites over 3 generations under PfPKAc-GFP OE-inducing (–GlcN) and control (+GlcN) conditions. Synchronous parasites (0 to 6 hpi) were split (±GlcN) 18 hours before the first measurement in generation 1. Open squares represent data points for individual replicates and the means and SD (error bars) of 3 biological replicates are shown. The raw data are available in the source data file (S2 Data). (E) Expression of PfPKAc-GFP in NF54/PKAc cOE S1 survivor parasites under OE-inducing (–GlcN) and control conditions (+GlcN) as assessed by live cell fluorescence imaging and western blot analysis. Parasites were cultured and samples prepared as described in panel A. Scale bar = 5 μm. MW PfPKAc-GFP = 67.3 kDa, MW PfGAPDH = 36.6 kDa. The full size western blot is shown in S6 Fig. (F) Number of nuclei per schizont in NF54/PKAc cOE S1 survivor parasites under PfPKAc-GFP OE-inducing (–GlcN) and control conditions (+GlcN). Each open circle represents one parasite. Data from 3 biological replicate experiments are shown, and 100 parasites were counted in each experiment. The boxplots show data distribution (median, upper, and lower quartile and whiskers). The raw data are available in the source data file (S2 Data). (G) Increase in parasitaemia in NF54/PKAc cOE S1 survivor parasites over 3 generations under PfPKAc-GFP OE-inducing (–GlcN) and control (+GlcN) conditions. Parasites were cultured as described in panel D. Open squares represent data points for individual replicates and the means and SD (error bars) of 3 biological replicates are shown. The raw data are available in the source data file (S2 Data). cOE, conditional overexpression; DIC, differential interference contrast; GlcN, glucosamine.
Fig 3
Fig 3. WGS reveals mutations in the Pf3D7_1121900/pfpdk1 gene in 6 independently grown NF54/PKAc cOE survivor parasites.
(A) Top: Schematic of the Pf3D7_1121900/pfpdk1 gene. Asterisks indicate the approximate localisation of the 5 missense mutations identified in the 6 different NF54/PKAc cOE survivors. Bottom: Summary of the sequence information obtained from WGS of gDNA of the 2 NF54/PKAc cOE clones (M1, M2) and the 6 independently grown survivors (S1–S6). Missense mutations and their positions within the pfpdk1 coding sequence as well as the corresponding amino acid substitutions in the PfPDK1 protein sequence are shown. (B) Predicted PfPDK1 structure shown in orthogonal (top left versus top right) or opposing (top left versus lower left) views. PfPDK1 was modelled on the crystallographic structure of human PDK1 (PDB ID 1UU9) [52]. PfPDK1 segments with no correspondence in human PDK1 (amino acids 1 to 27, 188 to 307, and 423 to 525) were omitted from modelling. The ATP substrate (sticks), mutated amino acids (substitution in parenthesis; red spheres), and residues forming the PIF-binding pocket [22] (green sticks) are indicated. The PIF-binding pocket is shown in surface representation in the lower right view. c., cDNA; cOE, conditional overexpression; PIF, PDK1-interacting fragment; WGS, whole genome sequencing.
Fig 4
Fig 4. Knockdown of PfPDK1 expression in NF54/PDK1 cKD parasites has no major effect on asexual parasite growth.
(A) Expression of PfPDK1-GFPDD in ring (18 to 24 hpi), trophozoite (24 to 30 hpi), and schizont (42 to 48 hpi) stages cultured under protein-stabilising (+Shield-1) conditions by live cell fluorescence imaging. Representative fluorescence images are shown. Parasite DNA was stained with Hoechst. Scale bar = 5 μm. (B) Expression of PfPDK1-GFPDD under protein-depleting (–Shield-1) and control conditions (+Shield-1) by live cell fluorescence imaging and western blot analysis. Synchronous parasites (0 to 8 hpi) were split (±Shield-1) 40 hours before collection of the samples. Representative fluorescence images are shown. Parasite DNA was stained with Hoechst. Scale bar = 5 μm. For western blot analysis, lysates derived from an equal numbers of parasites were loaded per lane. MW PfPDK1-GFPDD = 101.1 kDa, MW PfGAPDH = 36.6 kDa. The full size western blot is shown in S9 Fig. (C) Increase in parasitaemia (left) and parasite multiplication rates (right) under PfPDK1-GFPDD-depleting (–Shield-1) and control (+Shield-1) conditions. Synchronous parasites (0 to 6 hpi) were split (±Shield-1) 18 hours before the first measurement in generation 1. Open squares represent data points for individual replicates and the means and SD (error bars) of 3 biological replicates are shown. Differences in multiplication rates have been compared using a paired 2-tailed Student t test (statistical significance cutoff: p < 0.05). The raw data are available in the source data file (S2 Data). cKD, conditional PfPKAc knockdown; DIC, differential interference contrast.
Fig 5
Fig 5. Targeted mutagenesis of PfPDK1 confirms its essential role in activating PfPKAc.
(A, B) Expression of PfPKAc-GFP under OE-inducing (–GlcN) and control conditions (+GlcN) in NF54/PKAc cOE S1/PDK1_wt parasites (A) and NF54/PKAc cOE M1/PDK1_mut parasites (B) by live cell fluorescence imaging and western blot analysis. Synchronous parasites (0 to 8 hpi) were split (±GlcN) 40 hours before collection of the samples. Representative fluorescence images are shown. Parasite DNA was stained with Hoechst. Scale bar = 5 μm. For western blot analysis, lysates derived from an equal number of parasites were loaded per lane. MW PfPKAc-GFP = 67.3 kDa, MW PfGAPDH = 36.6 kDa. The full size western blots are shown in S11 Fig. (C, D) Increase in parasitaemia of NF54/PKAc cOE S1/PDK1_wt parasites (C) and NF54/PKAc cOE M1/PDK1_mut parasites (D) over 3 generations under PfPKAc-GFP OE-inducing (–GlcN) and control conditions (+GlcN). Synchronous parasites (0 to 6 hpi) were split (±GlcN) 18 hours before the first measurement in generation 1. Open squares represent data points for individual replicates and the means and SD (error bars) of 3 biological replicates are shown. The raw data are available in the source data file (S2 Data). DIC, differential interference contrast; GlcN, glucosamine.
Fig 6
Fig 6. Overexpression of PfPKAcT189V has no effect on intraerythrocytic parasite development and multiplication.
(A) Expression of PfPKAcT189V-GFP under OE-inducing (–GlcN) and control conditions (+GlcN) by live cell fluorescence imaging and western blot analysis. Synchronous parasites (0 to 8 hpi) were split (±GlcN) 40 hours before collection of the samples. Representative fluorescence images are shown. Parasite DNA was stained with Hoechst. Scale bar = 5 μm. GlcN, glucosamine. For western blot analysis, lysates derived from equal numbers of parasites were loaded per lane. MW PfPKAc-GFP = 67.3 kDa, MW PfGAPDH = 36.6 kDa. The full size western blot is shown in S13 Fig. (B) Increase in parasitaemia (left) and parasite multiplication rates (right) of NF54/PKAcT189V cOE parasites over 3 generations under PfPKAcT189V-GFP OE-inducing (–GlcN) and control conditions (+GlcN). Synchronous parasites (0 to 6 hpi) were split (±GlcN) 18 hours before the first measurement in generation 1. Open squares represent data points for individual replicates and the means and SD (error bars) of 3 biological replicates are shown. Differences in multiplication rates have been compared using a paired 2-tailed Student t test (statistical significance cutoff: p < 0.05). The raw data are available in the source data file (S2 Data). DIC, differential interference contrast.

Similar articles

Cited by

References

    1. Sinha A, Hughes KR, Modrzynska KK, Otto TD, Pfander C, Dickens NJ, et al.. A cascade of DNA-binding proteins for sexual commitment and development in Plasmodium. Nature. 2014;507 (7491):253–7. doi: 10.1038/nature12970 - DOI - PMC - PubMed
    1. Kafsack BF, Rovira-Graells N, Clark TG, Bancells C, Crowley VM, Campino SG, et al.. A transcriptional switch underlies commitment to sexual development in malaria parasites. Nature. 2014;507 (7491):248–52. doi: 10.1038/nature12920 - DOI - PMC - PubMed
    1. Brancucci NMB, Gerdt JP, Wang C, De M, Philip N, Adapa SR, et al.. Lysophosphatidylcholine Regulates Sexual Stage Differentiation in the Human Malaria Parasite Plasmodium falciparum. Cell. 2017;171 (7):1532–44 e15. doi: 10.1016/j.cell.2017.10.020 - DOI - PMC - PubMed
    1. Cowman AF, Tonkin CJ, Tham WH, Duraisingh MT. The Molecular Basis of Erythrocyte Invasion by Malaria Parasites. Cell Host Microbe. 2017;22 (2):232–45. doi: 10.1016/j.chom.2017.07.003 - DOI - PubMed
    1. Prinz B, Harvey KL, Wilcke L, Ruch U, Engelberg K, Biller L, et al.. Hierarchical phosphorylation of apical membrane antigen 1 is required for efficient red blood cell invasion by malaria parasites. Sci Rep. 2016;6:34479. doi: 10.1038/srep34479 - DOI - PMC - PubMed

Publication types

MeSH terms

Substances