. 2021 Dec 8;16(12):e0256973.
doi: 10.1371/journal.pone.0256973. eCollection 2021.

Role of miR-181c in Diet-induced obesity through regulation of lipid synthesis in liver

Affiliations

Role of miR-181c in Diet-induced obesity through regulation of lipid synthesis in liver

Kei Akiyoshi et al. PLoS One. .

Abstract

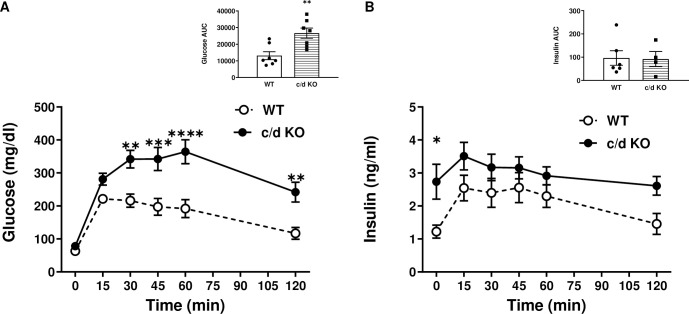
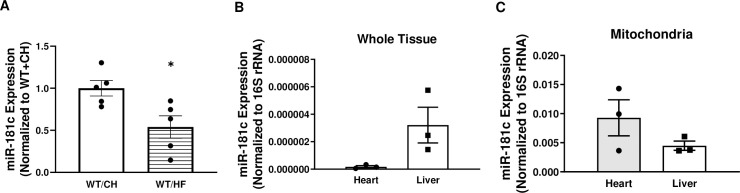
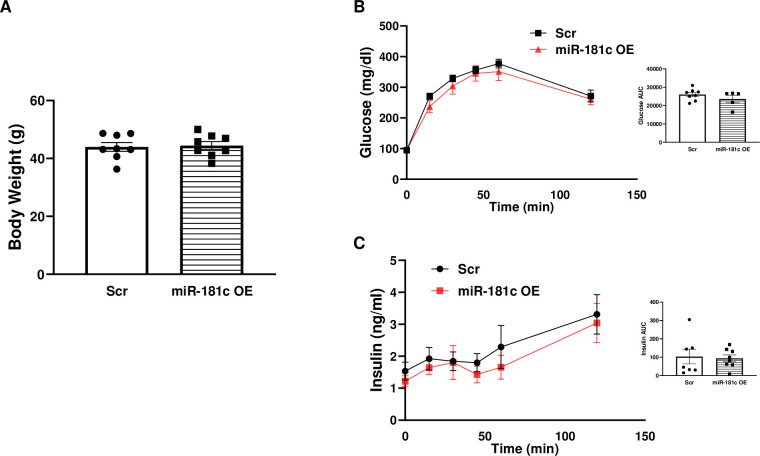
We recently identified a nuclear-encoded miRNA (miR-181c) in cardiomyocytes that can translocate into mitochondria to regulate mitochondrial gene mt-COX1 and influence obesity-induced cardiac dysfunction through the mitochondrial pathway. Because liver plays a pivotal role during obesity, we hypothesized that miR-181c might contribute to the pathophysiological complications associated with obesity. Therefore, we used miR-181c/d-/- mice to study the role of miR-181c in hepatocyte lipogenesis during diet-induced obesity. The mice were fed a high-fat (HF) diet for 26 weeks, during which indirect calorimetric measurements were made. Quantitative PCR (qPCR) was used to examine the expression of genes involved in lipid synthesis. We found that miR-181c/d-/- mice were not protected against all metabolic consequences of HF exposure. After 26 weeks, the miR-181c/d-/- mice had a significantly higher body fat percentage than did wild-type (WT) mice. Glucose tolerance tests showed hyperinsulinemia and hyperglycemia, indicative of insulin insensitivity in the miR-181c/d-/- mice. miR-181c/d-/- mice fed the HF diet had higher serum and liver triglyceride levels than did WT mice fed the same diet. qPCR data showed that several genes regulated by isocitrate dehydrogenase 1 (IDH1) were more upregulated in miR-181c/d-/- liver than in WT liver. Furthermore, miR-181c delivered in vivo via adeno-associated virus attenuated the lipogenesis by downregulating these same lipid synthesis genes in the liver. In hepatocytes, miR-181c regulates lipid biosynthesis by targeting IDH1. Taken together, the data indicate that overexpression of miR-181c can be beneficial for various lipid metabolism disorders.


Conflict of interest statement

The authors have declared that no competing interests exist.

Figures

Fig 1
Fig 1. Metabolic profiling of miR-181c/d-/- (c/d KO) mice.
(A) Oxygen consumption (VO2), (B) carbon dioxide production (VCO2), (C) respiratory exchange rate (RER), and (D) energy expenditure (EE) were measured before and during the 26 weeks of high-fat (HF) diet. Data are expressed as mean ± SEM (n = 4/genotype). *p<0.05 by Bonferroni post hoc analysis after intergroup differences were found by 2-way ANOVA. *p<0.05, ****p<0.0001 by two-sample t-test.
Fig 2
Fig 2. Effect of high-fat (HF) diet on miR-181c/d-/- (c/d KO) mice.
(A) Body weight (n = 4/genotype/diet), (B) percent fat mass (n = 8-13/genotype/diet), and (C) percent lean mass (n = 8-13/genotype/diet) were measured before and during the 26 weeks of HF diet. Data are expressed as mean ± SEM. *p<0.05 by Bonferroni post hoc analysis after intergroup differences were found by 1-way ANOVA. *p<0.05, ***p<0.001, ****p<0.0001 by two-sample t-test.
Fig 3
Fig 3. Metabolic consequences of high-fat (HF) diet on miR-181c/d-/- (c/d KO) mice.
(A) Blood glucose and area under the curve during an intraperitoneal glucose tolerance test (IPGTT) and (B) plasma insulin levels and area under the curve during an IPGTT. Data are expressed as mean ± SEM and are from 6–7 mice/genotype/diet. *p<0.05 by Bonferroni post hoc analysis after intergroup differences were found by 2-way ANOVA. *p<0.05, **p<0.01, ***p<0.001, ****p<0.0001 by two-sample t-test.
Fig 4
Fig 4. Effect of high-fat (HF) diet on the liver of c/d KO mice.
(A) Liver Oil-Red-O staining for lipid droplets. Analysis of plasma leptin levels (B), plasma triglyceride levels (C), and liver triglyceride content (D) in WT and c/d KO groups fed normal chow or a HF diet. Data are expressed as mean ± SEM (n = 5–7 mice/genotype/diet). *p<0.05 by Bonferroni post hoc analysis after intergroup differences were found by 1-way ANOVA. *p<0.05, **p<0.01, ****p<0.0001 by two-sample t-test.
Fig 5
Fig 5. Cytosolic localization of miR-181c in the liver.
Quantitative polymerase chain reaction (qRT-PCR) analysis of miR-181c expression in total RNA from the liver of normal chow (CH)-fed and high-fat (HF)-fed WT mice (A), in total RNA from the heart and liver tissue (B), and in the mitochondrial pellets of WT heart and liver tissue (C). Data are expressed as mean ± SEM (n = 3-7/genotype/diet). *p<0.05 by t-test analysis after intergroup differences were found by 2-way ANOVA. *p<0.05 by two-sample t-test.
Fig 6
Fig 6. In the absence of miR-181c, lipogenesis is activated by IDH1 upregulation.
Western blot analysis of protein lysate from liver IDH1 (A) and IDH2 (B). (C) Quantitative polymerase chain reaction (qRT-PCR) was used to assess liver mRNA expression of genes involved in lipogenesis. Sterol regulatory element binding transcription factor 1 (SREBP1), fatty acid synthase (FASN), and ATP citrate lyase (ACLY) were more highly expressed in WT than in c/d KO mice. Data are expressed as mean ± SEM (n = 5-7/genotype/diet). *p<0.05 by t-test analysis after intergroup differences were found by 2-way ANOVA. *p<0.05 by two-sample t-test.
Fig 7
Fig 7. Liver-specific miR-181c delivery and validation.
(A) In vivo miR-181c overexpression protocol. Quantitative polymerase chain reaction (qRT-PCR) analysis of miR-181c expression in total RNA isolated from liver (B), heart (C), lung (D), spleen (E), and kidney (F). OE, overexpression; Scr, scrambled oligonucleotide. Data are expressed as mean ± SEM; n = 8 for panels B-F. * p<0.05 by t-test analysis. *p<0.05 by two-sample t-test.
Fig 8
Fig 8. Effect of miR-181c overexpression in liver on insulin secretion.
(A) Body weight. (B) Blood glucose and area under the curve during an IPGTT. (C) Plasma insulin levels and area under the curve during an IPGTT. OE, overexpression; Scr, scrambled oligonucleotide. Data are expressed as mean ± SEM; n = 8 per group. *p<0.05 by Bonferroni post hoc analysis after intergroup differences were found by 2-way ANOVA.
Fig 9
Fig 9. Effect of liver-specific miR-181c overexpression on lipogenesis.
Western blot (A) and quantitative polymerase chain reaction (qRT-PCR, B) of IDH1 in the liver from AAV-8 vector-injected mice. Western blot (C) and qRT-PCR (D) of IDH2 in the liver of AAV-8 vector-injected mice. (E) qRT-PCR was used to assess liver mRNA expression of sterol regulatory element binding transcription factor 1 (SREBP1), fatty acid synthase (FASN), and ATP citrate lyase (ACLY) genes, which are involved in lipogenesis. OE, overexpression; Scr, scrambled oligonucleotide. Data are expressed as mean ± SEM; n = 8 per group. * p<0.05 by t-test analysis. *p<0.05, **p<0.01 by two-sample t-test.
Fig 10
Fig 10. Effect of liver-specific miR-181c overexpression on metabolic consequences of a high-fat (HF) diet.
AAV-8-miR-181c-injected and AAV-8-scramble-injected mice were compared after 10 weeks of a HF diet. (A) Total liver weight. (B) Liver histology, Oil-Red-O staining, Masson-Trichrome, and H&E staining. (C) Liver triglyceride content. (D) Plasma triglyceride levels. (E) Plasma leptin levels. OE, overexpression; Scr, scrambled oligonucleotide. Data are expressed as mean ± SEM; n = 8 per group. *p<0.05 by Bonferroni post hoc analysis after intergroup differences were found by 1-way ANOVA. *p<0.05, **p<0.01, ***p<0.001 by two-sample t-test.
Fig 11
Fig 11. Role of miR-181c in regulating high-fat diet-induced lipogenesis.
This schematic diagram illustrates key steps in the signaling pathway linking a high fat diet with increased lipogenesis. According to this model, high fat triggers lipogenesis by activating IDH1 though SREBF, ACLY, and FASN pathways. Liver-specific miR-181c can directly bind to the 3′-UTR of IDH 1 mRNA and mitigate lipogenesis.

Similar articles

Cited by

References

    1. Alberti KG, Eckel RH, Grundy SM, Zimmet PZ, Cleeman JI, Donato KA, et al.. Harmonizing the metabolic syndrome: a joint interim statement of the International Diabetes Federation Task Force on Epidemiology and Prevention; National Heart, Lung, and Blood Institute; American Heart Association; World Heart Federation; International Atherosclerosis Society; and International Association for the Study of Obesity. Circulation. 2009;120(16):1640–5. Epub 2009/10/07. doi: 10.1161/CIRCULATIONAHA.109.192644 . - DOI - PubMed
    1. Chu B, Wu T, Miao L, Mei Y, Wu M. MiR-181a regulates lipid metabolism via IDH1. Sci Rep. 2015;5:8801. Epub 2015/03/06. doi: 10.1038/srep08801 ; PubMed Central PMCID: PMC4350072. - DOI - PMC - PubMed
    1. Das S, Bedja D, Campbell N, Dunkerly B, Chenna V, Maitra A, et al.. miR-181c regulates the mitochondrial genome, bioenergetics, and propensity for heart failure in vivo. PLoS One. 2014;9(5):e96820. Epub 2014/05/09. doi: 10.1371/journal.pone.0096820 ; PubMed Central PMCID: PMC4014556. - DOI - PMC - PubMed
    1. Das S, Ferlito M, Kent OA, Fox-Talbot K, Wang R, Liu D, et al.. Nuclear miRNA regulates the mitochondrial genome in the heart. Circ Res. 2012;110(12):1596–603. doi: 10.1161/CIRCRESAHA.112.267732 ; PubMed Central PMCID: PMC3390752. - DOI - PMC - PubMed
    1. Das S, Kohr M, Dunkerly-Eyring B, Lee DI, Bedja D, Kent OA, et al.. Divergent Effects of miR-181 Family Members on Myocardial Function Through Protective Cytosolic and Detrimental Mitochondrial microRNA Targets. J Am Heart Assoc. 2017;6(3). Epub 2017/03/01. doi: 10.1161/JAHA.116.004694 ; PubMed Central PMCID: PMC5524005. - DOI - PMC - PubMed

Publication types