. 2021 Dec 8;17(12):e1009658.
doi: 10.1371/journal.pcbi.1009658. eCollection 2021 Dec.

Multifunctional RNA-binding proteins influence mRNA abundance and translational efficiency of distinct sets of target genes

Affiliations

Multifunctional RNA-binding proteins influence mRNA abundance and translational efficiency of distinct sets of target genes

Valentin Schneider-Lunitz et al. PLoS Comput Biol. .

Abstract

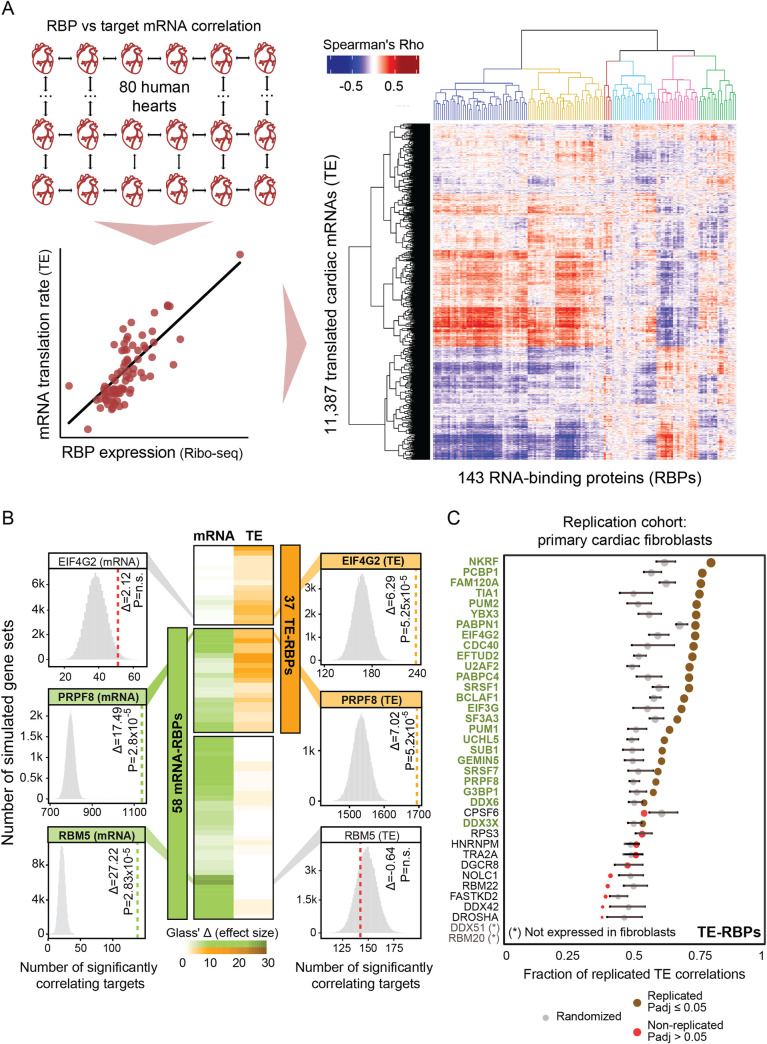
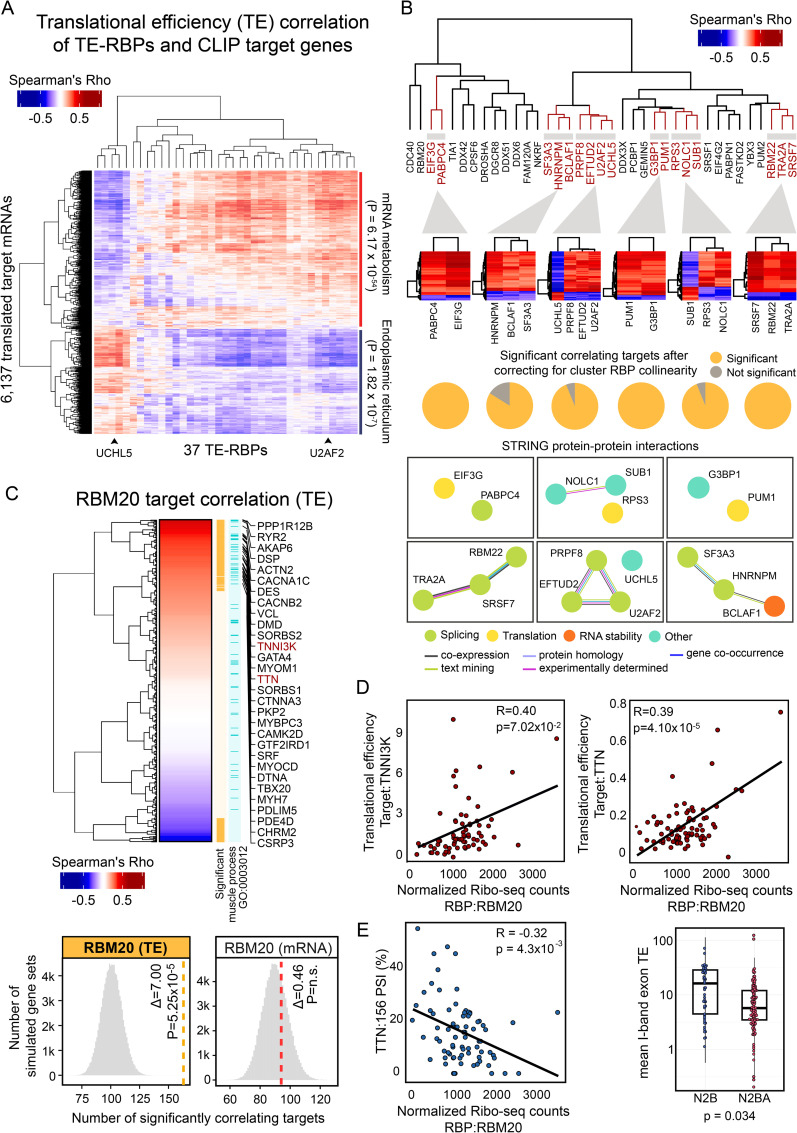
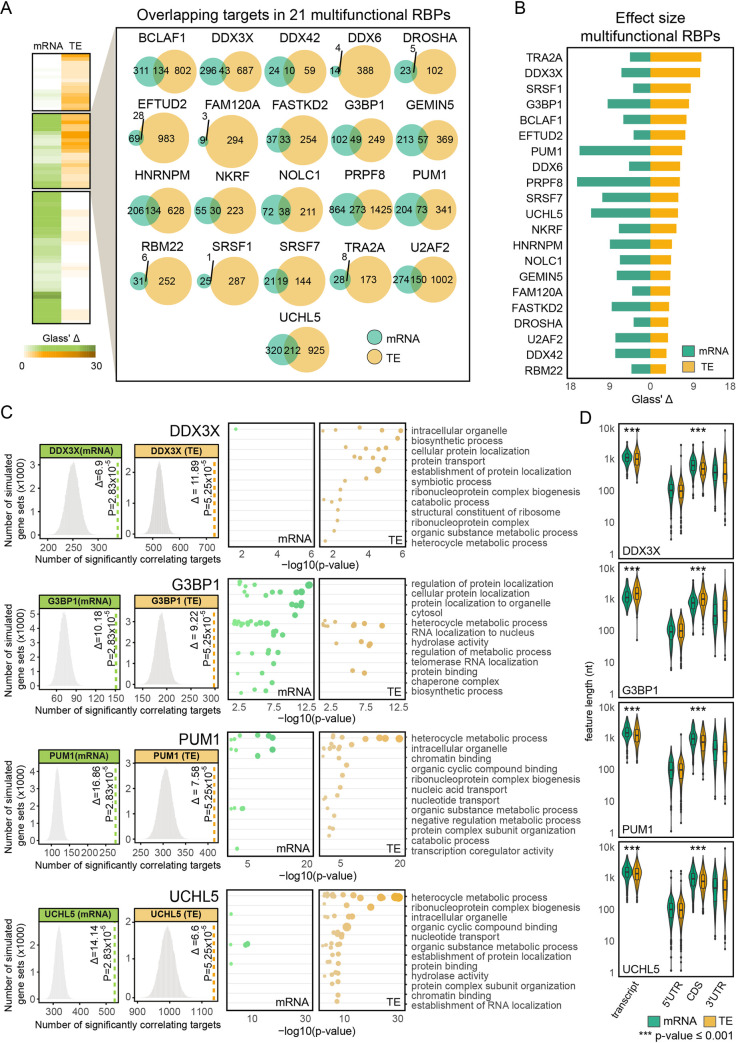
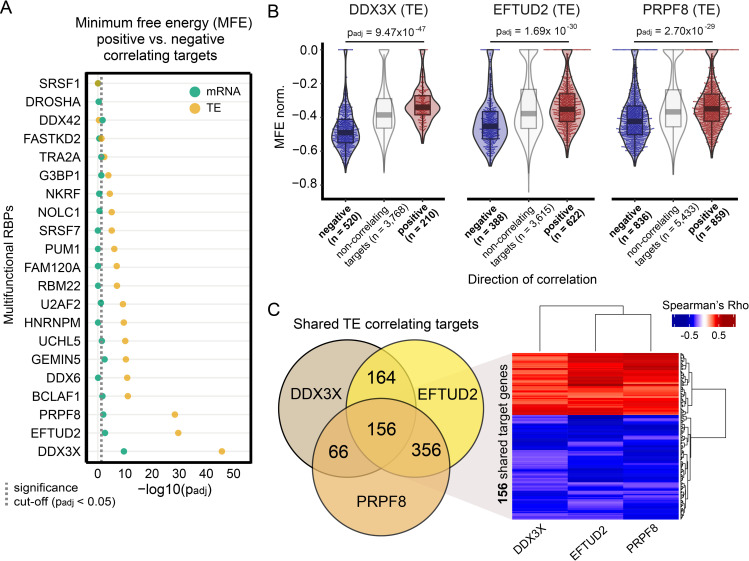
RNA-binding proteins (RBPs) can regulate more than a single aspect of RNA metabolism. We searched for such previously undiscovered multifunctionality within a set of 143 RBPs, by defining the predictive value of RBP abundance for the transcription and translation levels of known RBP target genes across 80 human hearts. This led us to newly associate 27 RBPs with cardiac translational regulation in vivo. Of these, 21 impacted both RNA expression and translation, albeit for virtually independent sets of target genes. We highlight a subset of these, including G3BP1, PUM1, UCHL5, and DDX3X, where dual regulation is achieved through differential affinity for target length, by which separate biological processes are controlled. Like the RNA helicase DDX3X, the known splicing factors EFTUD2 and PRPF8-all identified as multifunctional RBPs by our analysis-selectively influence target translation rates depending on 5' UTR structure. Our analyses identify dozens of RBPs as being multifunctional and pinpoint potential novel regulators of translation, postulating unanticipated complexity of protein-RNA interactions at consecutive stages of gene expression.


Conflict of interest statement

The authors have declared that no competing interests exist.

Figures

Fig 1
Fig 1. RNA-binding protein abundance predicts target translational regulation.
(A) Schematic of the RBP-target correlation approach. Using the quantified Ribo-seq and RNA-seq data from 80 hearts, pairwise RBP versus target mRNA abundance or translational efficiency correlations were calculated. A heatmap with hierarchically clustered translational efficiency Spearman’s Rho correlations of RBPs and translated mRNAs in the human heart are shown. Six clusters of coregulated RBPs are highlighted (See also S1 Table). (B) Heatmap with Glass’ △ scores that quantify the effect size of the witnessed significance of associations between RBPs and target gene mRNA abundance and TE. Only significant RBPs are shown: 37 TE-RBPs (orange) and 58 mRNA-RBPs (green). For three selected RBPs (one per category), histograms illustrate the significance of the calculated associations. (C) Dot plot displaying the fraction of translational efficiency RBP-target correlations that can be replicated in an independent set of primary cardiac fibroblasts [30]. For each RBP, the significance of the replication was evaluated by comparing the replicated fraction between observed and randomized sets and it is represented as a brown (significant) or red (non-significant) dot. The size of the dots indicates the strength of significance (-log10 (padj)) and grey dots correspond to the fraction of replicated correlations in randomized sets. Error bars indicate mean values with standard deviation (SD).
Fig 2
Fig 2. CLIP analysis identifies coregulated in vivo targets of novel master regulators of translation in the human heart.
(A) Heatmap displaying the hierarchically clustered correlations between the cardiac expression levels of the 37 TE-RBPs (as determined by normalized Ribo-seq expression) and the cardiac TE of 6,153 correlating target genes. Each of the significantly correlating target genes was previously found to be bound by at least one of these 37 TE-RBPs based on CLIP experiments (see Methods). The clustering separates two groups with opposite effects on TE, whose targets are enriched for mRNA metabolism (padj = 6.17 x 10−54) and endoplasmic reticulum (padj = 1.82 x 10⁻⁷) GO terms, respectively. (B) Dendrogram with hierarchically clustered TE-RBPs based on pairwise RBP-RBP overlaps. Shared target genes of all paired RBPs were included for clustering. Bottom heatmaps with translational efficiency correlations of selected RBP clusters and shared significant targets. These plots illustrate distinct cooperative and competitive RBP-target regulation modes. Pie charts illustrate the fraction of targets that remain significant after correcting for RBP collinearity per cluster. STRING protein-protein interaction networks [40] from selected RBP clusters reveal functional association of coregulated RBPs. Colours in edges and nodes indicate the sources of STRING evidence and known RBP functions. (C) Heatmap with hierarchically clustered Spearman’s Rho correlation scores of RBM20 and the translational efficiency of the predicted target genes. Significant correlating targets (n = 163, padj ≤ 0.05) and targets involved in muscle process (GO: 0003012) are highlighted in orange and light blue colours respectively. A list of sarcomere gene targets positively correlating with RBM20 is displayed. Selected bottom histograms illustrate the significance of RBM20 with correlating TE targets and the absence of significance with correlating mRNA targets. (D) Scatter plots representing the correlation between RBM20 expression (as measured by normalized Ribo-seq counts; x-axis) and the translational efficiency (TE; y-axis) of two sarcomere genes: TNNI3K and TTN. Score and level of significance of the two Spearman’s correlations are displayed. (E) Left: Scatter plot showing the correlation between normalized RBM20 expression levels (as measured by Ribo-seq) and the percent spliced in (PSI) of TTN exon 156. Right: Box plot comparing average TTN I-Band isoform-specific TEs, showing a marked difference between TTN isoform N2B (ENST00000460472), displaying a significantly higher TE than TTN isoform N2BA (ENST00000591111) (Wilcoxon rank sum test, p-value = 0.034).
Fig 3
Fig 3. Multifunctional RBPs regulate translation of distinct sets of target genes.
(A) Heatmap with Glass’ △ scores quantifying the effect size of the witness effects for mRNA and TE correlations. Both effect sizes are significant for a highlighted set of 21 multifunctional RBPs. For this set of RBPs, individual Venn Diagrams representing the overlap in the total number of mRNA and TE targets are displayed. (B) Bar plot quantifying the magnitude of mRNA and TE effect size (Glass’ △ scores) for multifunctional RBPs. RBP effect sizes are largely independent of the mode of regulation. (C) Selected histograms and dot plots illustrating the significance of RBP-target correlations and the enrichment of GO terms for the targets bound by 4 multifunctional RBPs: DDX3X, G3BP1, PUM1, and UCHL5. For each RBP, the 12 most significant parental GO terms are displayed. For three of the RBPs, mRNA and TE targets exhibit different enrichment of significant GO terms. (D) Box plots with transcript, 5’ UTR, CDS, and 3’ UTR sequence lengths in nucleotides for mRNA and TE targets corresponding to the four selected multifunctional RBPs in (C). A total of 9 multifunctional RBPs bind targets with significantly different CDS lengths (Wilcoxon rank sum test). See also S3 Fig.
Fig 4
Fig 4. Differential affinity of multifunctional RBPs for 5’ UTR structures often drives opposite quantitative TE effects.
(A) Dot plot displaying the significance of the differences in 5’ UTR minimum free energy (MFE, normalized by length) between target genes that correlate positively or negatively with each multifunctional RBP. Significance values are calculated separately for mRNA (green) and TE (brown) targets. Adjusted p-values are shown on a -log10 scale and calculated using the Wilcoxon Rank Sum test and only 5’ UTR sequences with a minimum length of 20 nucleotides were evaluated. A dashed vertical line indicates the minimum adjusted p-value to consider the differences in MFE as significant (padj < 0.05). (B) Box and violin plots with length normalized MFE scores for positively and negatively correlated TE targets corresponding to the three selected multifunctional RBPs with the highest significance (Wilcoxon rank sum test) in Fig 4A (DDX3X, EFTUD2, PRPF8). For comparison, non-correlating target genes were included in the panel figure. (C) Three-way Venn Diagram representing the overlap in the number of TE targets for the three selected RBPs. The heatmap represents TE correlations of 156 shared target genes for the three cases.

References

    1. Gerstberger S, Hafner M, Tuschl T. A census of human RNA-binding proteins. Nat Rev Genet. 2014;15: 829–845. doi: 10.1038/nrg3813 - DOI - PMC - PubMed
    1. Caudron-Herger M, Rusin SF, Adamo ME, Seiler J, Schmid VK, Barreau E, et al. R-DeeP: Proteome-wide and Quantitative Identification of RNA-Dependent Proteins by Density Gradient Ultracentrifugation. Mol Cell. 2019;75: 184—199.e10. doi: 10.1016/j.molcel.2019.04.018 - DOI - PMC - PubMed
    1. Mallam AL, Sae-Lee W, Schaub JM, Tu F, Battenhouse A, Jang YJ, et al. Systematic Discovery of Endogenous Human Ribonucleoprotein Complexes. Cell Rep. 2019;29: 1351—1368.e5. doi: 10.1016/j.celrep.2019.09.060 - DOI - PMC - PubMed
    1. Trendel J, Schwarzl T, Horos R, Prakash A, Bateman A, Hentze MW, et al. The Human RNA-Binding Proteome and Its Dynamics during Translational Arrest. Cell. 2019;176: 391—403.e19. doi: 10.1016/j.cell.2018.11.004 - DOI - PubMed
    1. Castello A, Fischer B, Frese CK, Horos R, Alleaume A-M, Foehr S, et al. Comprehensive Identification of RNA-Binding Domains in Human Cells. Mol Cell. 2016;63: 696–710. doi: 10.1016/j.molcel.2016.06.029 - DOI - PMC - PubMed

Publication types

MeSH terms