. 2022 Jan 1;127(1):173-187.
doi: 10.1152/jn.00208.2021. Epub 2021 Dec 8.

The effect of limb position on a static knee extension task can be explained with a simple spinal cord circuit model

Affiliations

The effect of limb position on a static knee extension task can be explained with a simple spinal cord circuit model

Gareth York et al. J Neurophysiol. .

Abstract

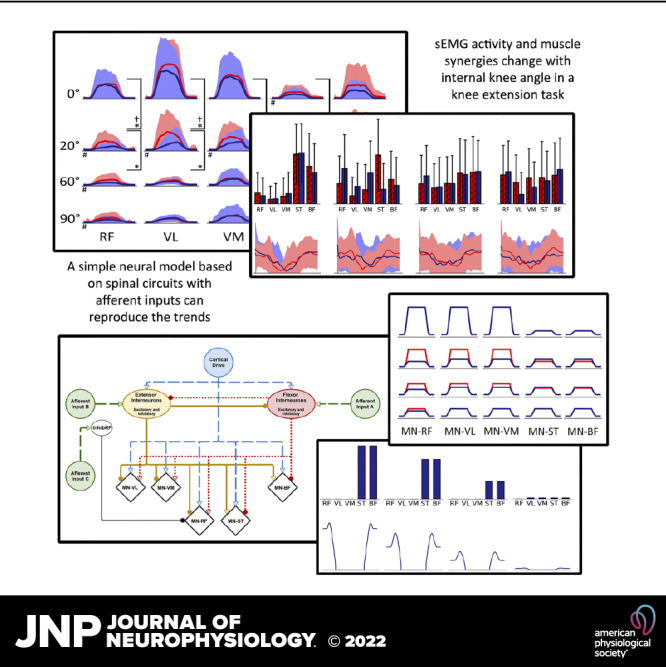
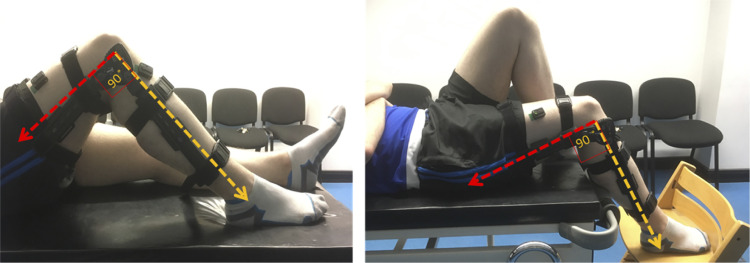
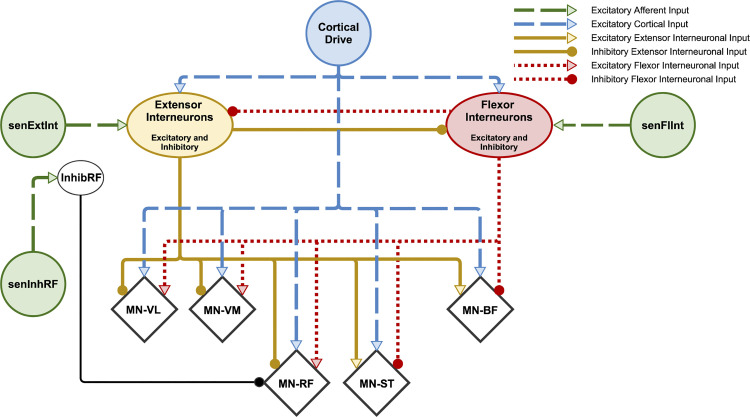
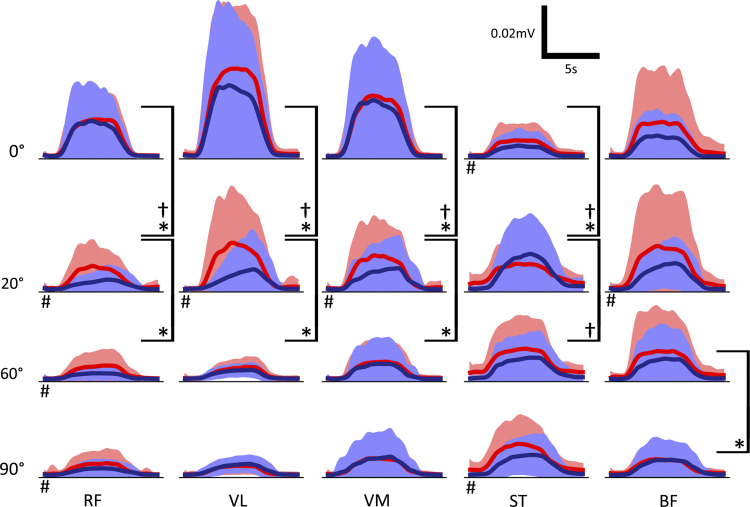
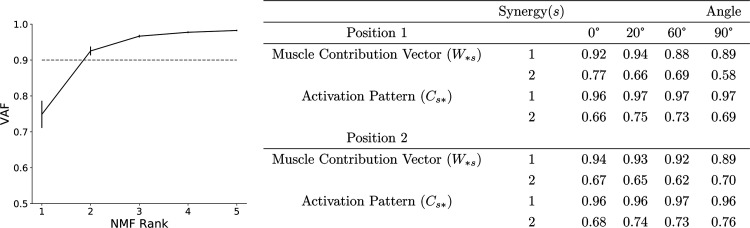
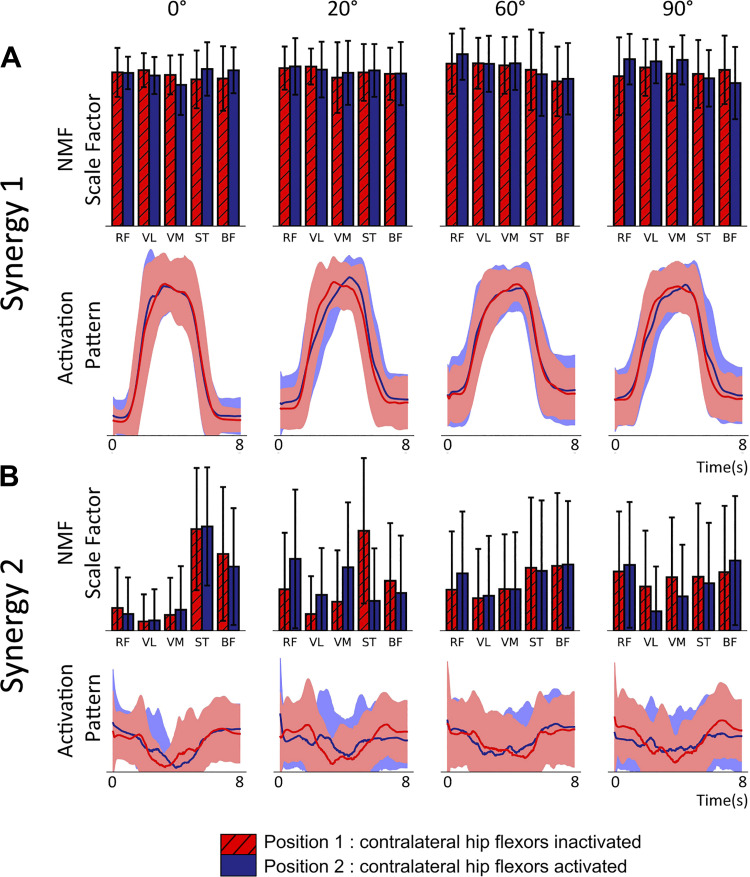
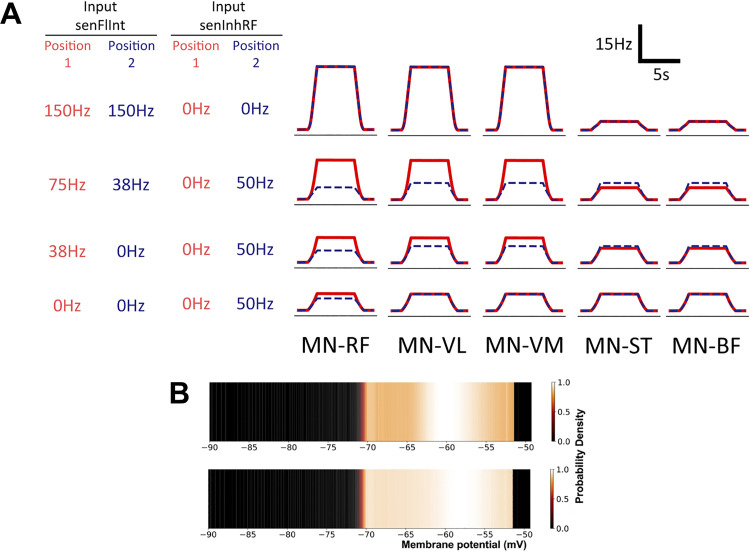
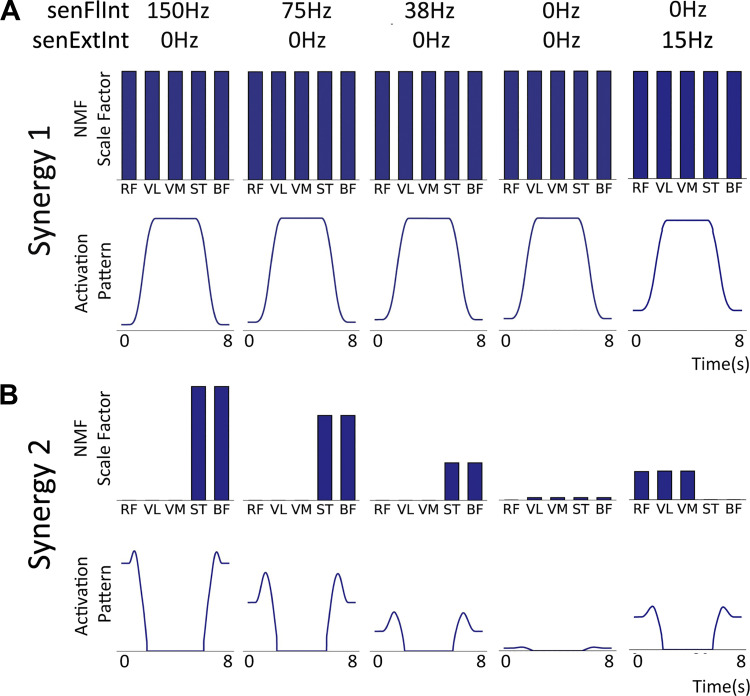
The influence of proprioceptive feedback on muscle activity during isometric tasks is the subject of conflicting studies. We performed an isometric knee extension task experiment based on two common clinical tests for mobility and flexibility. The task was carried out at four preset angles of the knee, and we recorded from five muscles for two different hip positions. We applied muscle synergy analysis using nonnegative matrix factorization on surface electromyograph recordings to identify patterns in the data that changed with internal knee angle, suggesting a link between proprioception and muscle activity. We hypothesized that such patterns arise from the way proprioceptive and cortical signals are integrated in neural circuits of the spinal cord. Using the MIIND neural simulation platform, we developed a computational model based on current understanding of spinal circuits with an adjustable afferent input. The model produces the same synergy trends as observed in the data, driven by changes in the afferent input. To match the activation patterns from each knee angle and position of the experiment, the model predicts the need for three distinct inputs: two to control a nonlinear bias toward the extensors and against the flexors, and a further input to control additional inhibition of rectus femoris. The results show that proprioception may be involved in modulating muscle synergies encoded in cortical or spinal neural circuits.NEW & NOTEWORTHY The role of sensory feedback in motor control when limbs are held in a fixed position is disputed. We performed a novel experiment involving fixed position tasks based on two common clinical tests. We identified patterns of muscle activity during the tasks that changed with different leg positions and then inferred how sensory feedback might influence the observations. We developed a computational model that required three distinct inputs to reproduce the activity patterns observed experimentally. The model provides a neural explanation for how the activity patterns can be changed by sensory feedback.

Keywords: isometric knee extension; neural control; population model; proprioception; spinal circuits.


Conflict of interest statement

No conflicts of interest, financial or otherwise, are declared by the authors.

Figures

None
Graphical abstract
Figure 1.
Figure 1.
An image of the 2 positions of the experiment (position 1 on the left and position 2 on the right) and the leg brace used to constrain the knee.
Figure 2.
Figure 2.
Schematic of connections between simulated spinal populations. Motor neuron (MN)-vastus lateralis (VL), MN-vastus medialis (VM), MN-rectus femoris (RF), MN-semitendinosus (ST), and MN-biceps femoris (BF) populations are identified as diamonds although all populations consist of exponential integrate-and-fire neurons. The Extensor and Flexor Interneuron Populations allow both outgoing excitatory and inhibitory connections. All populations receive a background level of input producing a baseline activity. Parameters for the network connectivity are provided in Table 1. The InhibRF population is used to offset the level of bias given to the MN-RF population. Afferent Input senFlInt and senExtInt control the balance of input to the flexor and extensor interneuron populations, respectively, which influences the agonist/antagonist bias. Afferent Input senInhRF represents an additional input, activated to reproduce the change in activity of RF in position 2. Connections that exist in other models but that are not required to produce the observed synergies have been omitted. For example, direct afferent inputs to motor neuron populations. The relative strengths of each connection are not shown but can be found in the connectivity parameters (Table 1).
Figure 3.
Figure 3.
Mean surface EMG traces for each muscle (columns), angle (rows), and position (bright red for position 1 and dark blue for position 2). Significance between plots with P < 0.05 was calculated based on a two-sided t test of the mean of the central 4 s of each sEMG trace to compare the activity of the contraction. *Significance between angles in position 1. †Significance between angles in position 2. #Significance between position 1 and position 2 for the same angle; n = 17 (male: 9; female: 8). RF, rectus femoris; VL, vastus lateralis; VM, vastus medialis; ST, semitendinosus; BF, biceps femoris.
Figure 4.
Figure 4.
Average variance accounted for (VAF) screen plot for rank 1 to 5 nonnegative matrix factorization (NMF) dimensionality reduction across all angles and both positions of the static knee extension task. The 90% VAF threshold indicates that 2 is the appropriate rank to use and therefore the number of synergies to extract. Error bars show SE. In the table, synergy rows (activation patterns) and columns (contribution vectors as defined in Data Preprocessing) were compared across all pairs of participants using cosine similarity analysis giving a value between 0 (uncorrelated) and 1 (highly correlated). For both positions (activating or inactivating the contralateral hip flexors) and for all internal knee angles, there is high correlation between subjects indicating that, during the task, the same synergy patterns are being recruited by the majority of subjects; n = 17 (male: 9; female: 8).
Figure 5.
Figure 5.
Muscle synergies extracted using rank two nonnegative matrix factorization (NMF) from a static knee extension task at 4 internal angles of the knee (0°, 20°, 60°, and 90°) [n = 17, mixed gender, female = 8, age range of 18–30 yr (24.4 ± 2.57 yr)]. Subjects performed 6 contractions of 5 s with the subject being asked to maximize rectus femoris activity. NMF was performed on the normalized surface EMG (sEMG) of each subject’s 6 contractions. The experiment was repeated across2 positions inactivating (red values) or activating (blue) contralateral hip flexors. Line charts are activation patterns identified by NMF as underlying structure in the original sEMG time series. Filled areas show SD. Bar charts show the contribution of the associated activation pattern to the activity of each of the 5 muscles in arbitrary units. Error bars represent SD. A: synergy 1 demonstrates the coordinated contraction across muscle groups in line with what is observed in the rectified and smoothed sEMG data. B: synergy 2 captures the inverse of the range of sEMG activity in each muscle. For both positions, at 0°, the antagonist muscles have significantly less activity than the agonists, which results in a high values for the antagonists. RF, rectus femoris; VL, vastus lateralis; VM, vastus medialis; ST, semitendinosus; BF, biceps femoris.
Figure 6.
Figure 6.
A: output firing rates of the 5 simulated motor neuron (MN) populations for different levels of afferent input. The significant differences observed in the surface EMG data have been reproduced here with a nonlinear reduction in activity of afferent input senFlInt and with a change in afferent input senInhRF between positions. Red solid lines represent approximations for position 1. Blue dashed lines represent approximations for position 2. RF, rectus femoris; VL, vastus lateralis; VM, vastus medialis; ST, semitendinosus; BF, biceps femoris. B: the probability density function of the MN-RF population in the model before input from cortical drive (top) and during the contraction (bottom). Color brightness indicates the probability of a neuron in the population having the indicated membrane potential. The y-axis of the plots represents an arbitrary value for simple exponential integrate-and-fire neurons. A higher probability at the threshold of −51 mV indicates a higher average firing rate for the population.
Figure 7.
Figure 7.
Muscle synergy features extracted using rank 2 nonnegative matrix factorization (NMF) applied to the normalized average firing rates of the 5 motor neuron populations in the model for different levels of afferent senFlInt and senExtInt (Fig. 2). As with the experimental results, line plots indicate the activation pattern for each synergy and bar charts indicate that pattern’s contribution to each motor neuron population’s activity. The contribution vector values are labeled with the muscle names that correspond to the motor neuron population names. BF, biceps femoris; RF, rectus femoris; ST, semitendinosus; VL, vastus lateralis; VM, vastus medialis. A: synergy 1. The contribution vector is the same for all muscles across all levels of afferent activity. There is a small increase in the baseline of the activation pattern but the shape, caused by the cortical drive, appears at all angles. B: synergy 2. The high contribution vector values for the knee flexor populations are high when senFlInt is 150 Hz. The values reduce with afferent senFlInt, and at 0 Hz, there is effectively no synergy 2. When senExtInt is raised above senFlInt, the trend flips to an agonist bias.

Similar articles

Cited by

References

    1. Rothwell JC, Traub MM, Day BL, Obeso JA, Thomas PK, Marsden CD. Manual motor performance in a deafferented man. Brain 105: 515–542, 1982. doi:10.1093/brain/105.3.515. - DOI - PubMed
    1. Roh J, Rymer WZ, Beer RF. Robustness of muscle synergies underlying three-dimensional force generation at the hand in healthy humans. J Neurophysiol 107: 2123–2142, 2012. doi:10.1152/jn.00173.2011. - DOI - PMC - PubMed
    1. Haffajee D, Moritz U, Svantesson G. Isometric knee extension strength as a function of joint angle, muscle length and motor unit activity. Acta Orthop Scand 43: 138–147, 1972. doi:10.3109/17453677208991252. - DOI - PubMed
    1. Onishi H, Yagi R, Oyama M, Akasaka K, Ihashi K, Handa Y. EMG-angle relationship of the hamstring muscles during maximum knee flexion. J Electromyogr Kinesiol 12: 399–406, 2002. doi:10.1016/S1050-6411(02)00033-0. - DOI - PubMed
    1. Ema R, Wakahara T, Kawakami Y. Effect of hip joint angle on concentric knee extension torque. J Electromyogr Kinesiol 37: 141–146, 2017. doi:10.1016/j.jelekin.2017.10.012. - DOI - PubMed

Publication types