. 2021 Dec 22;184(26):6326-6343.e32.
doi: 10.1016/j.cell.2021.11.022. Epub 2021 Dec 7.

A transcriptional rheostat couples past activity to future sensory responses

Affiliations

A transcriptional rheostat couples past activity to future sensory responses

Tatsuya Tsukahara et al. Cell. .

Abstract

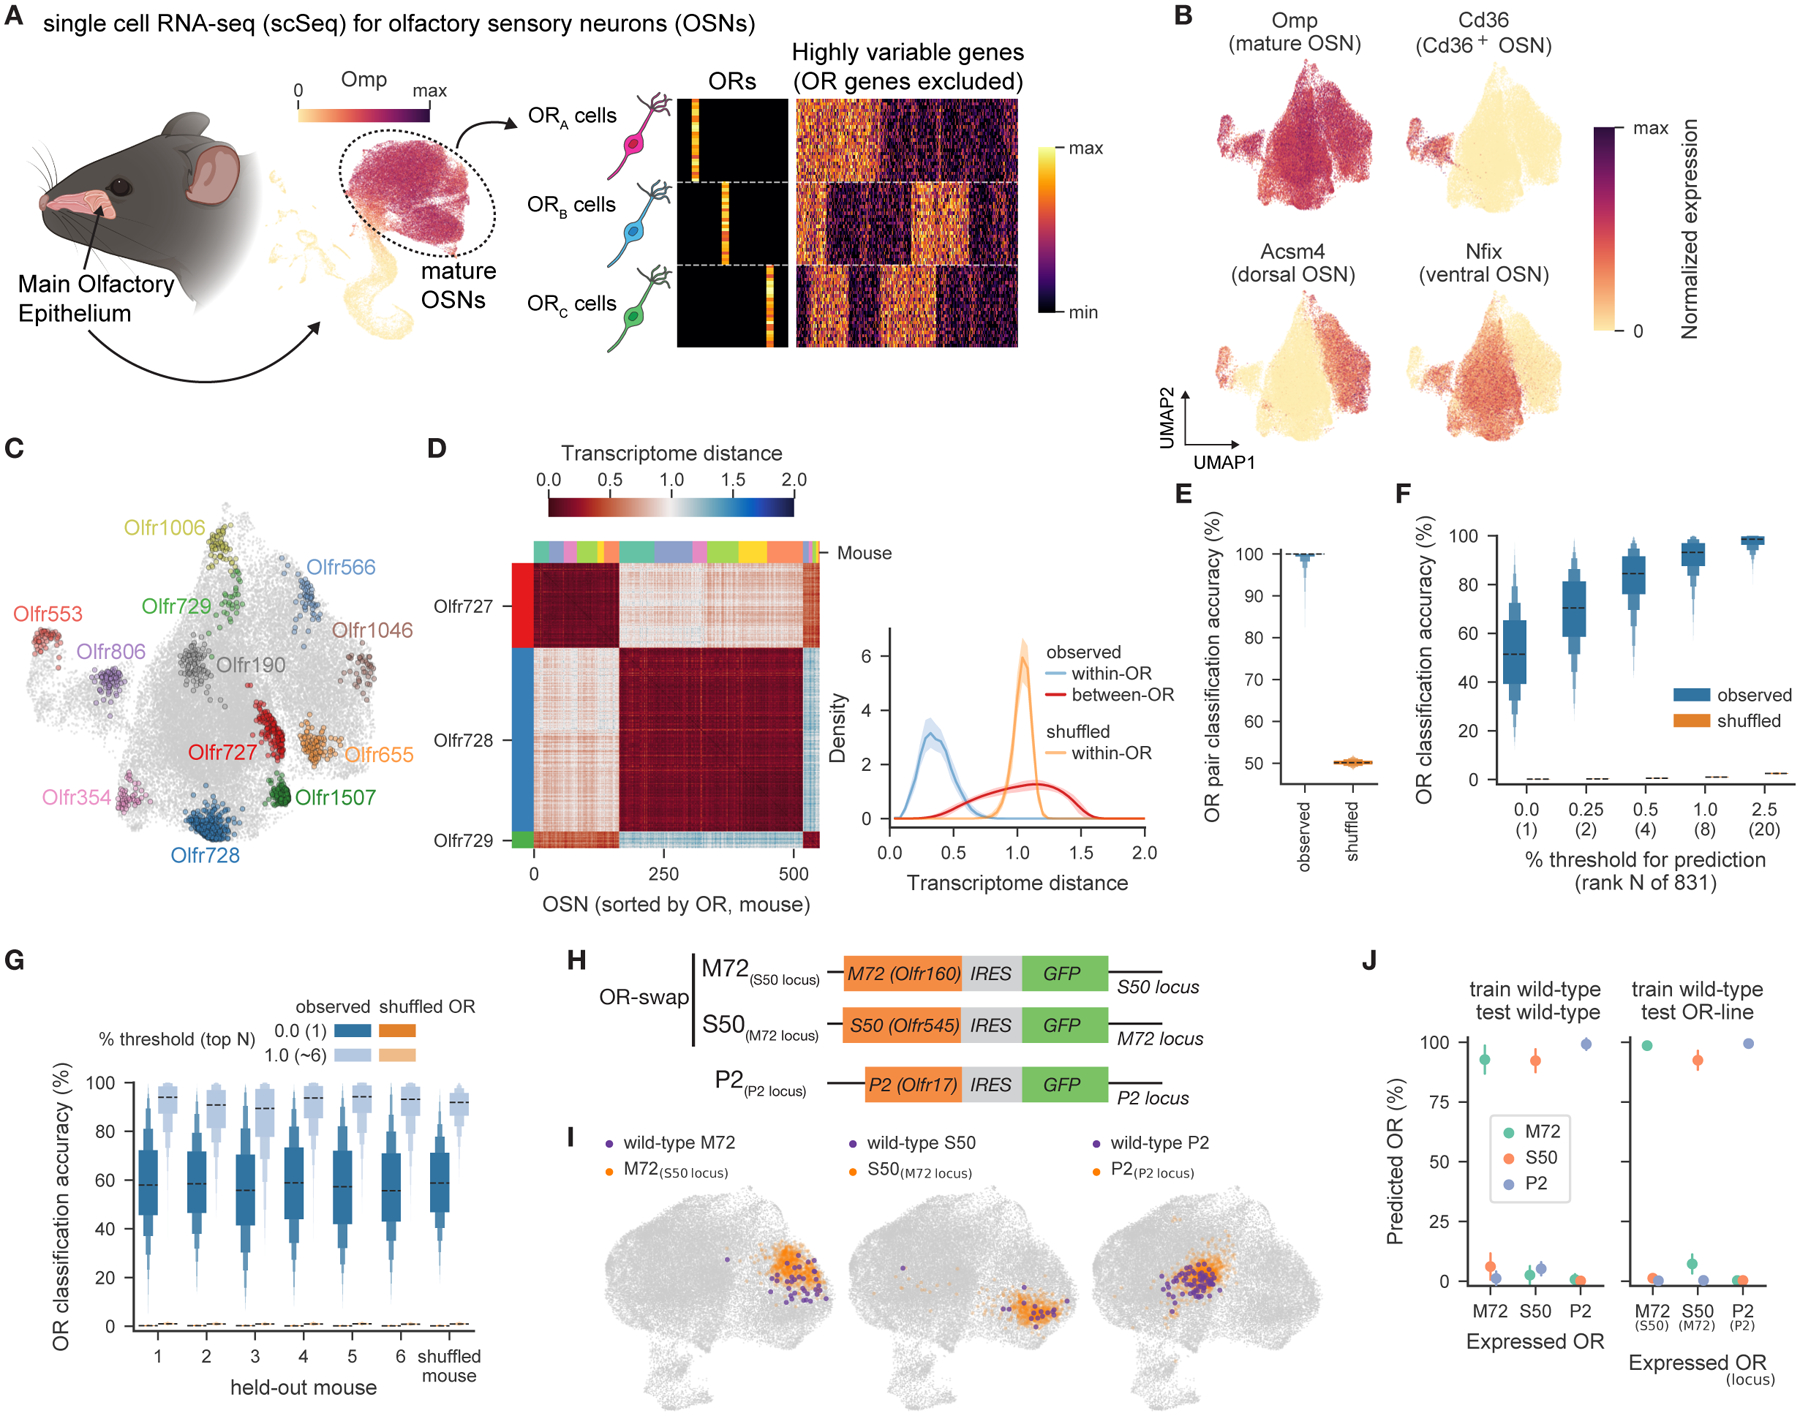
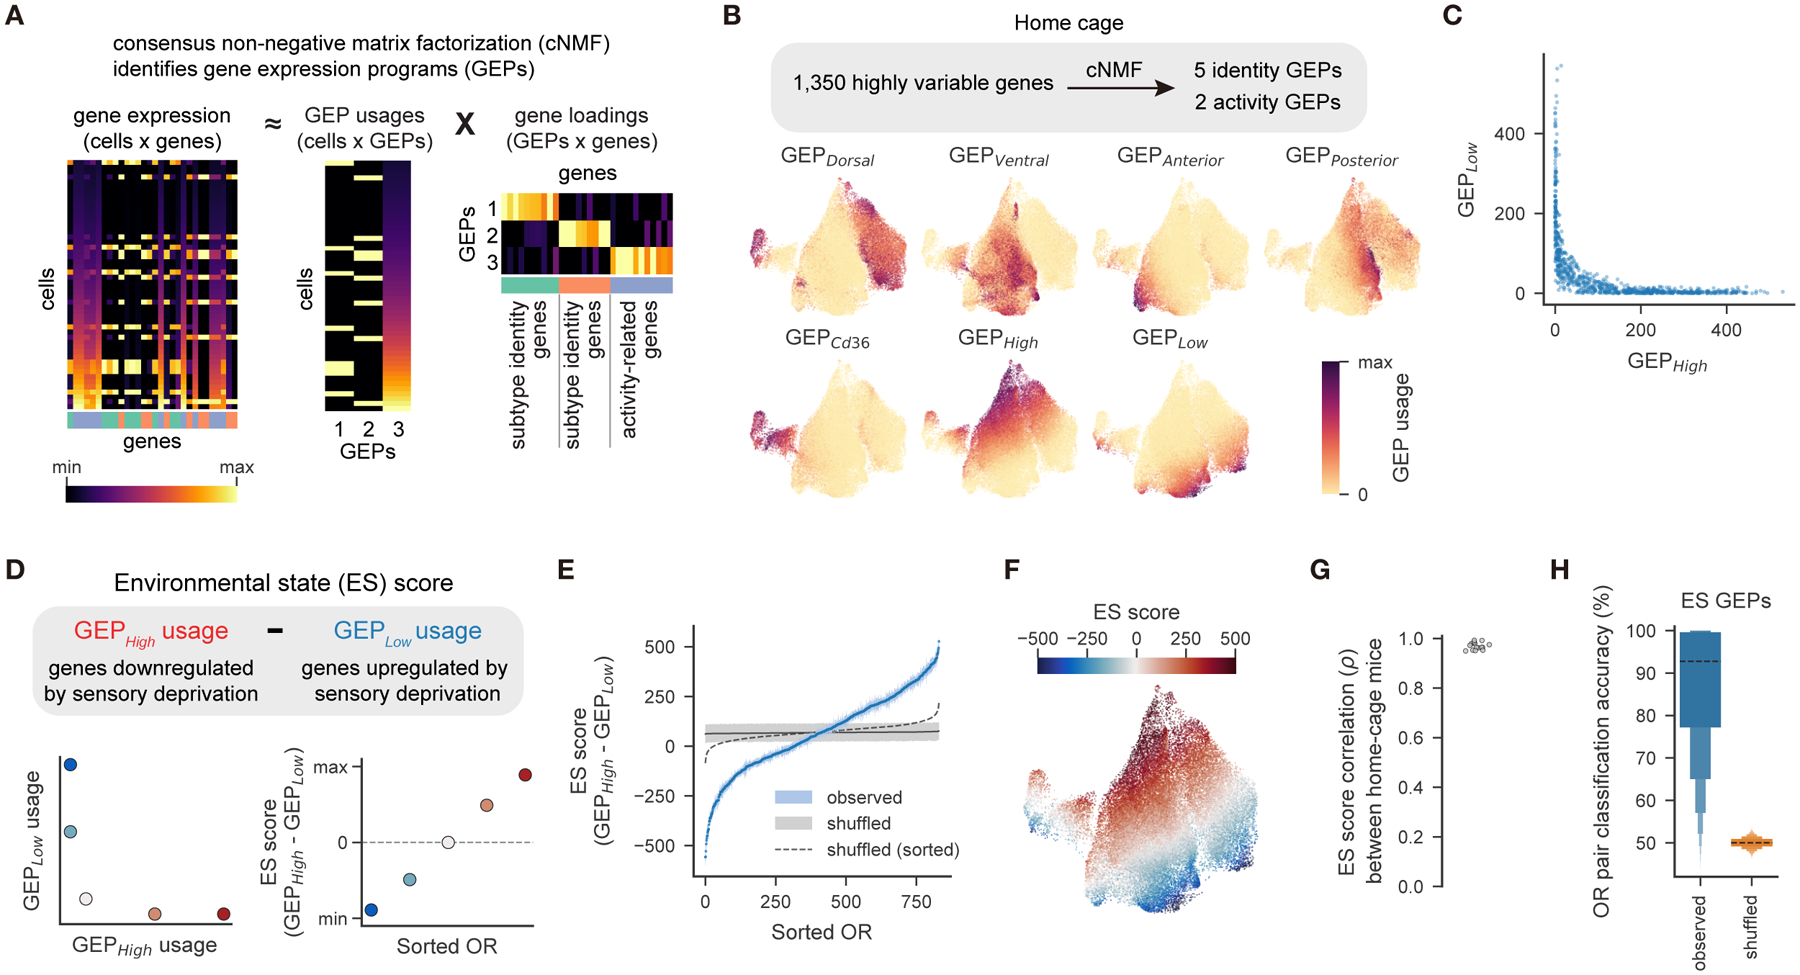
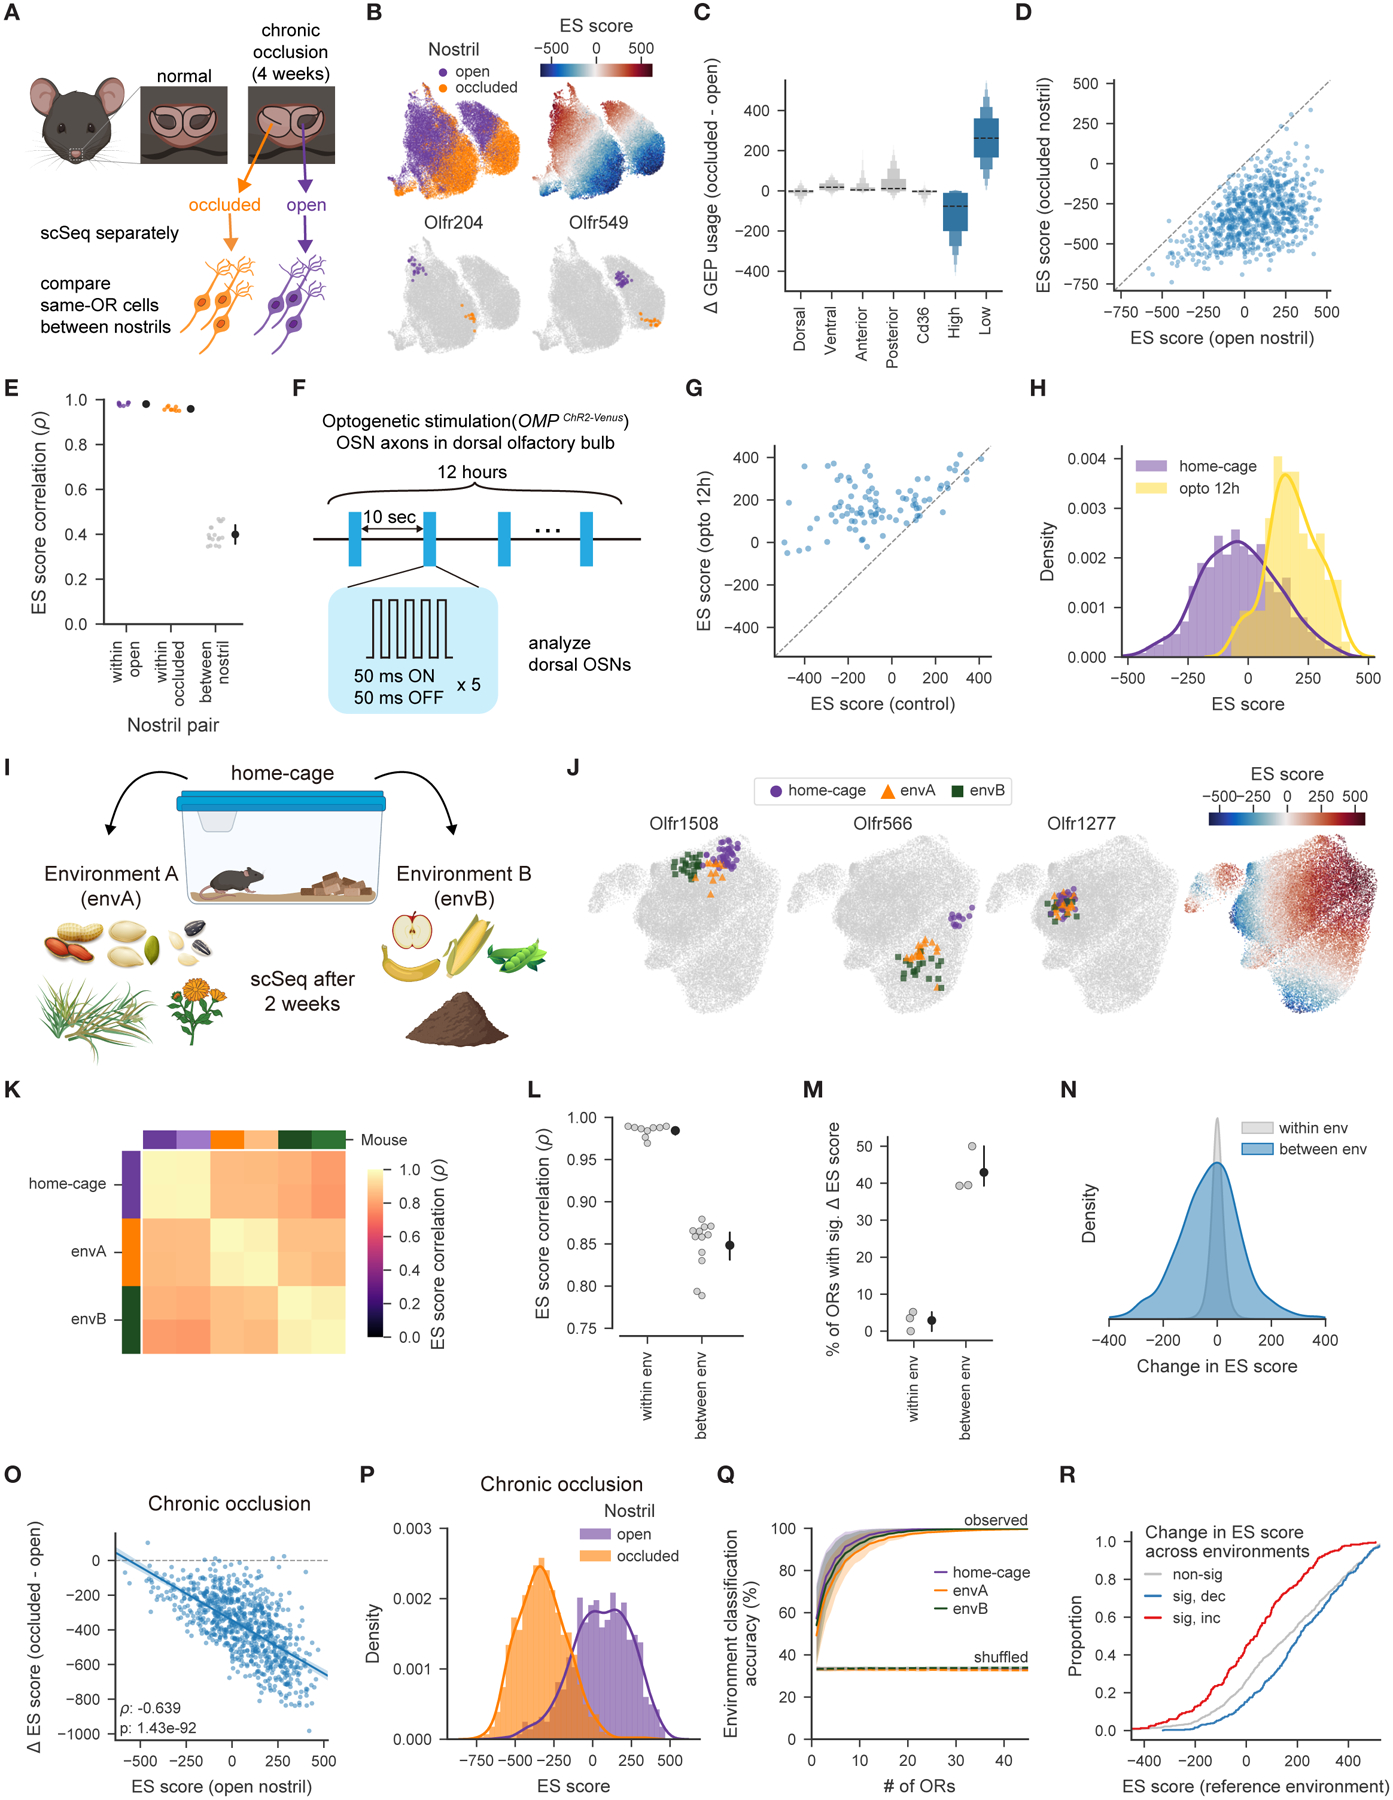
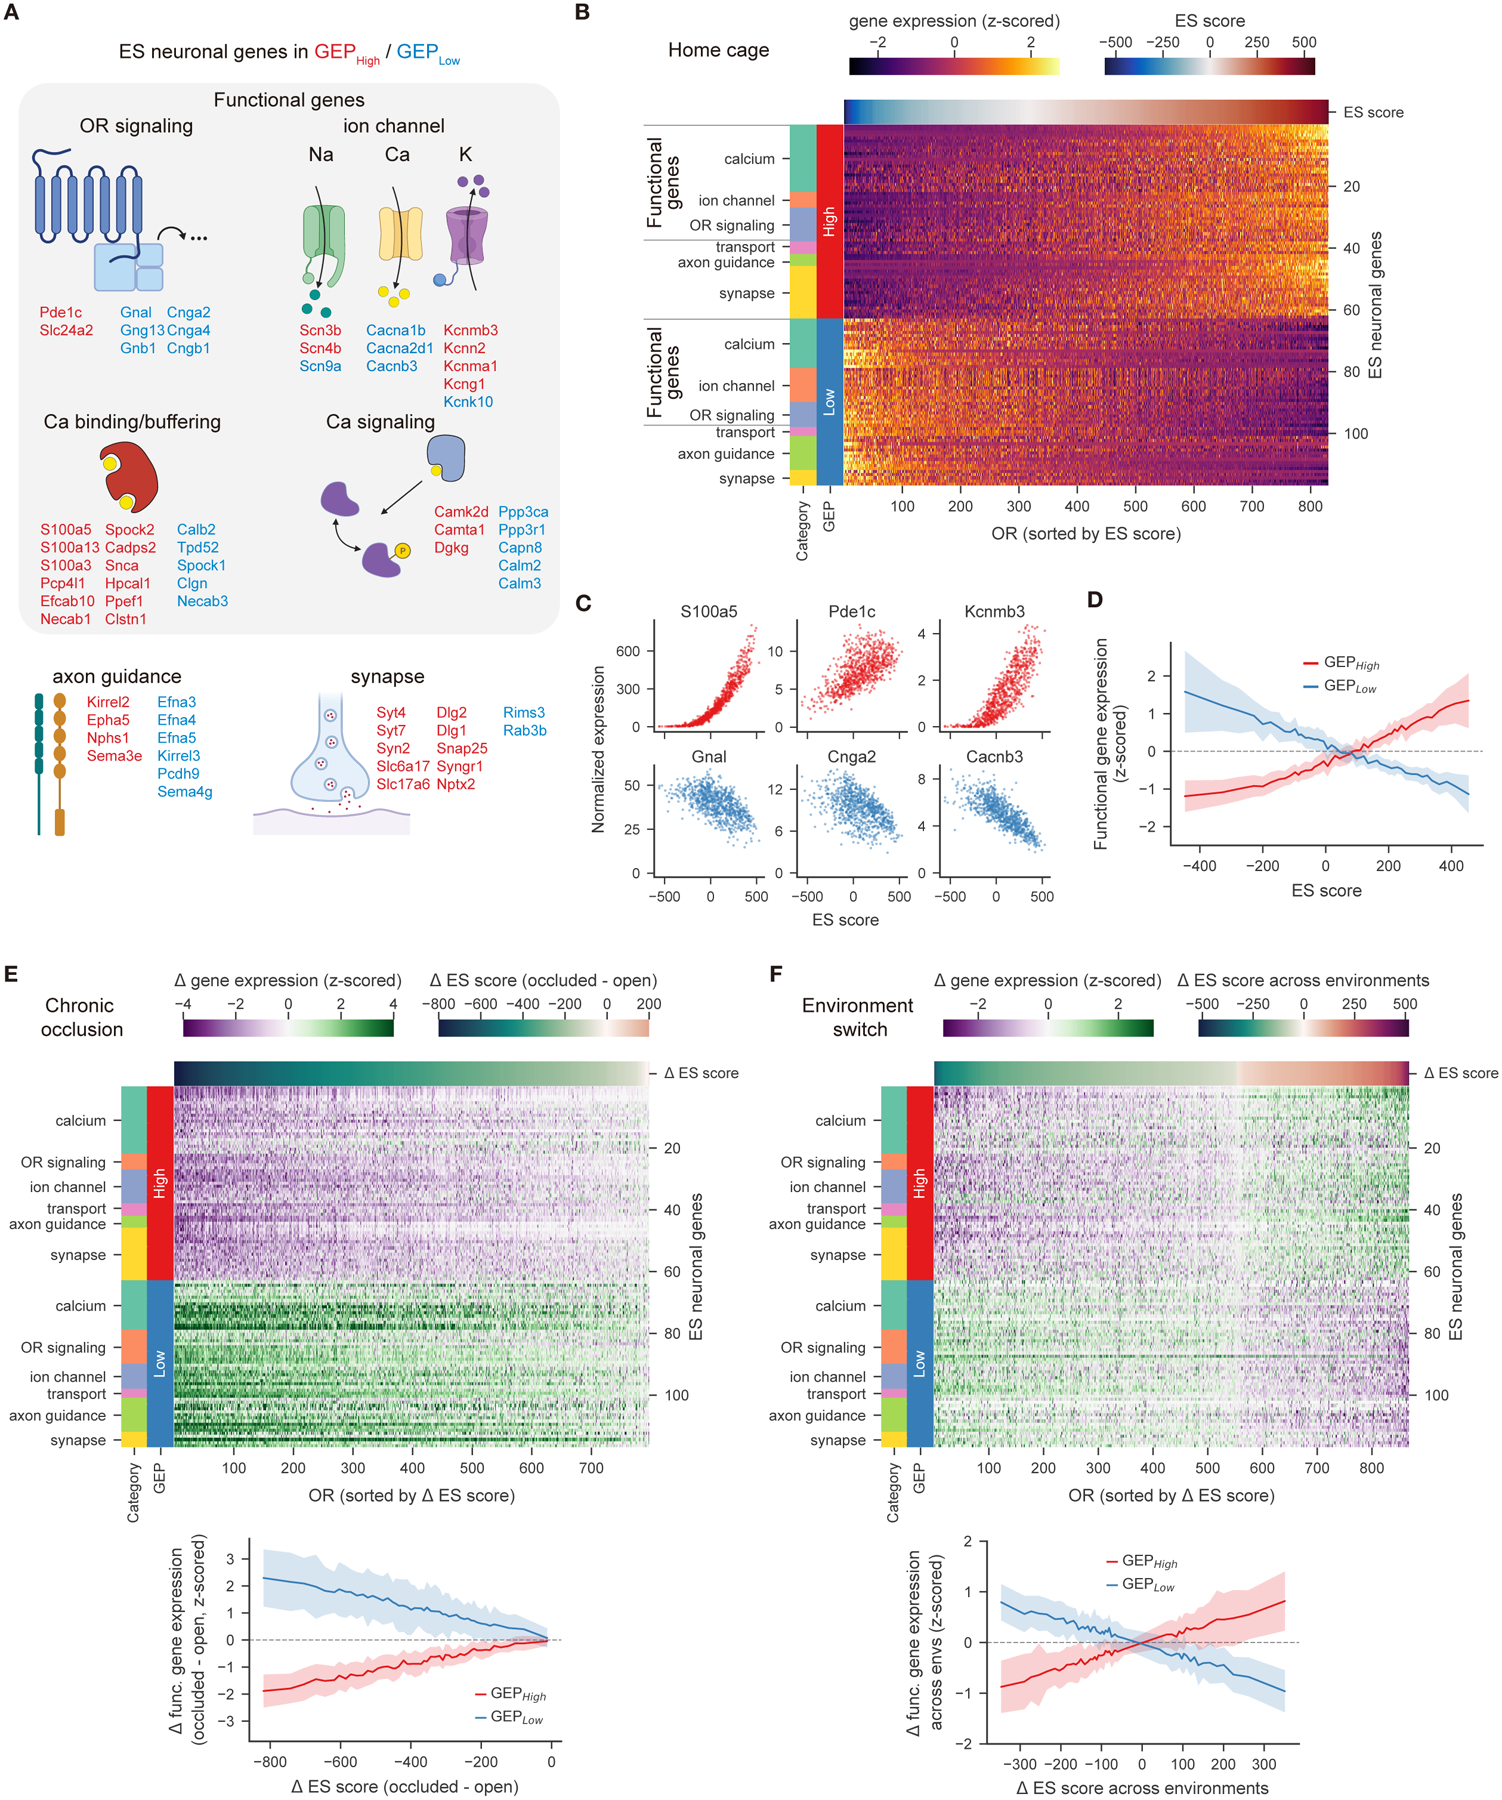
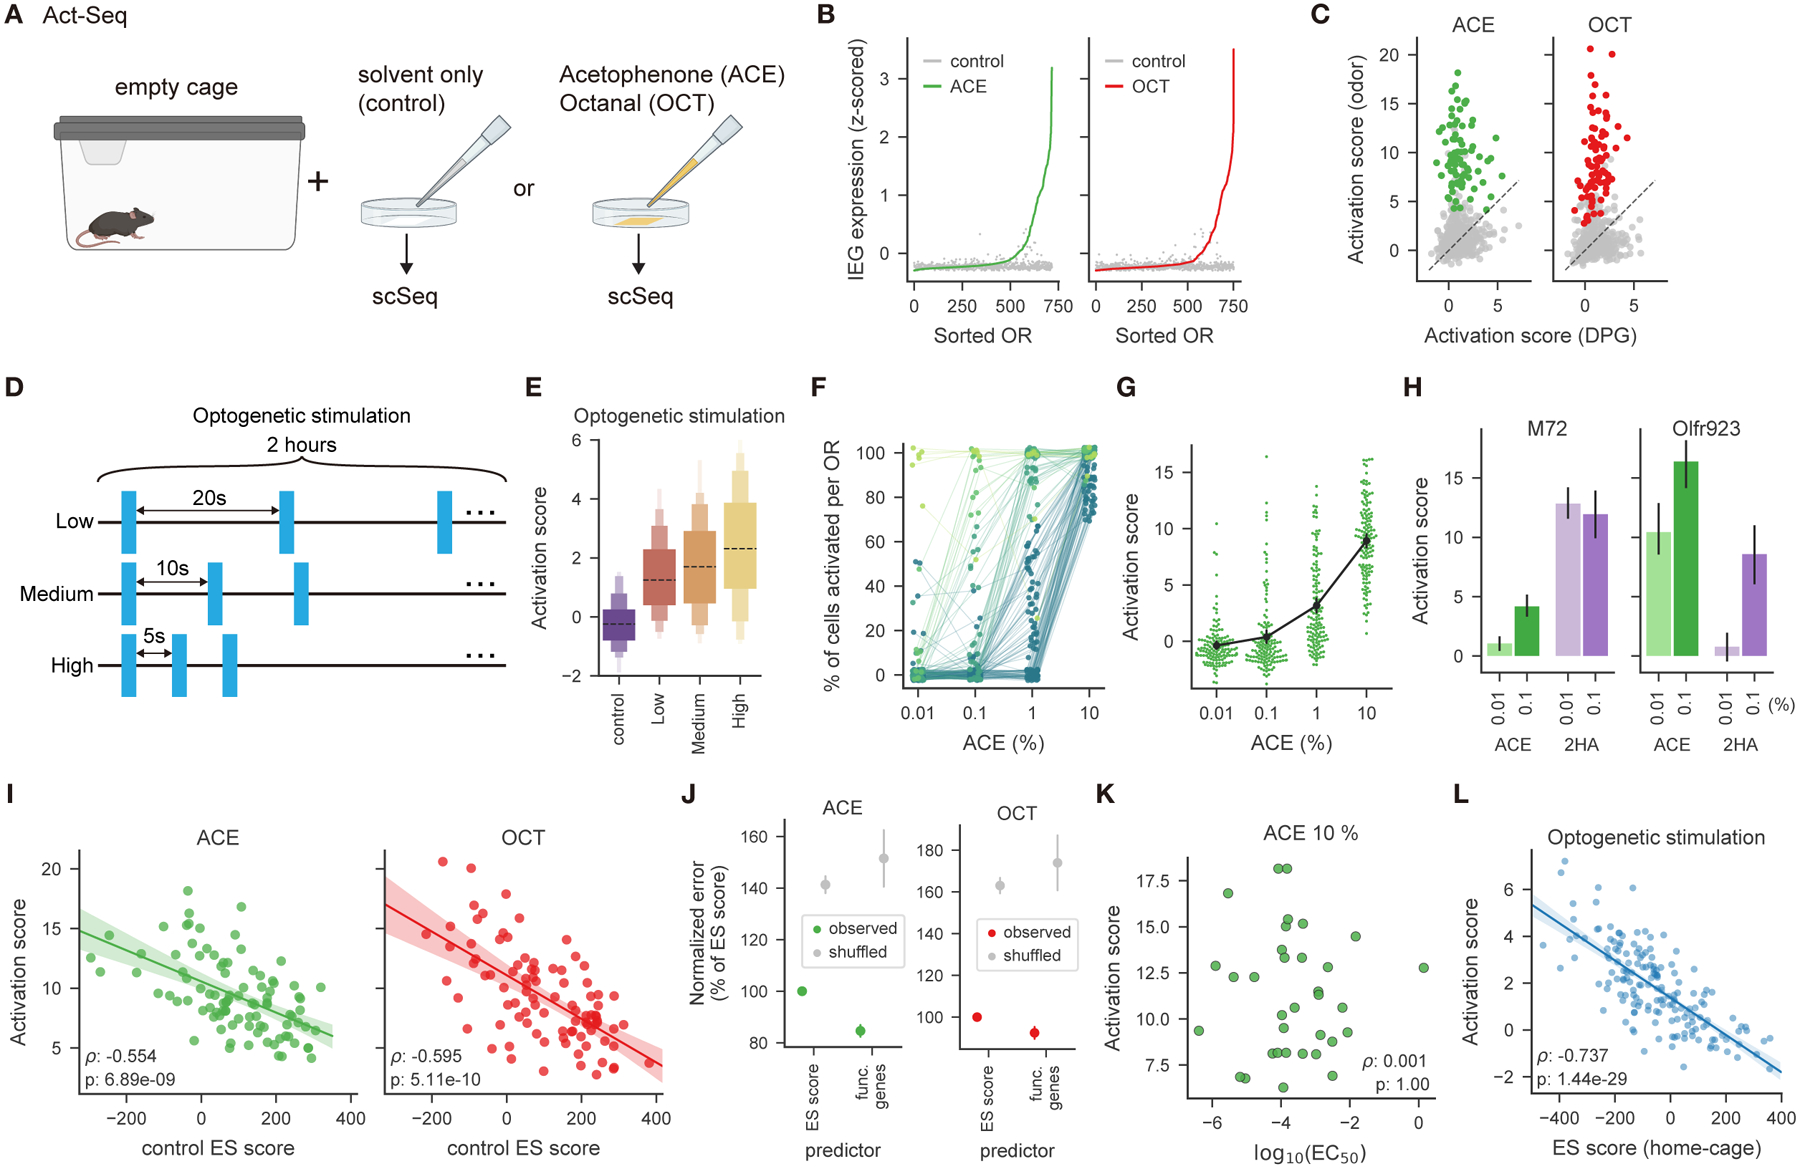
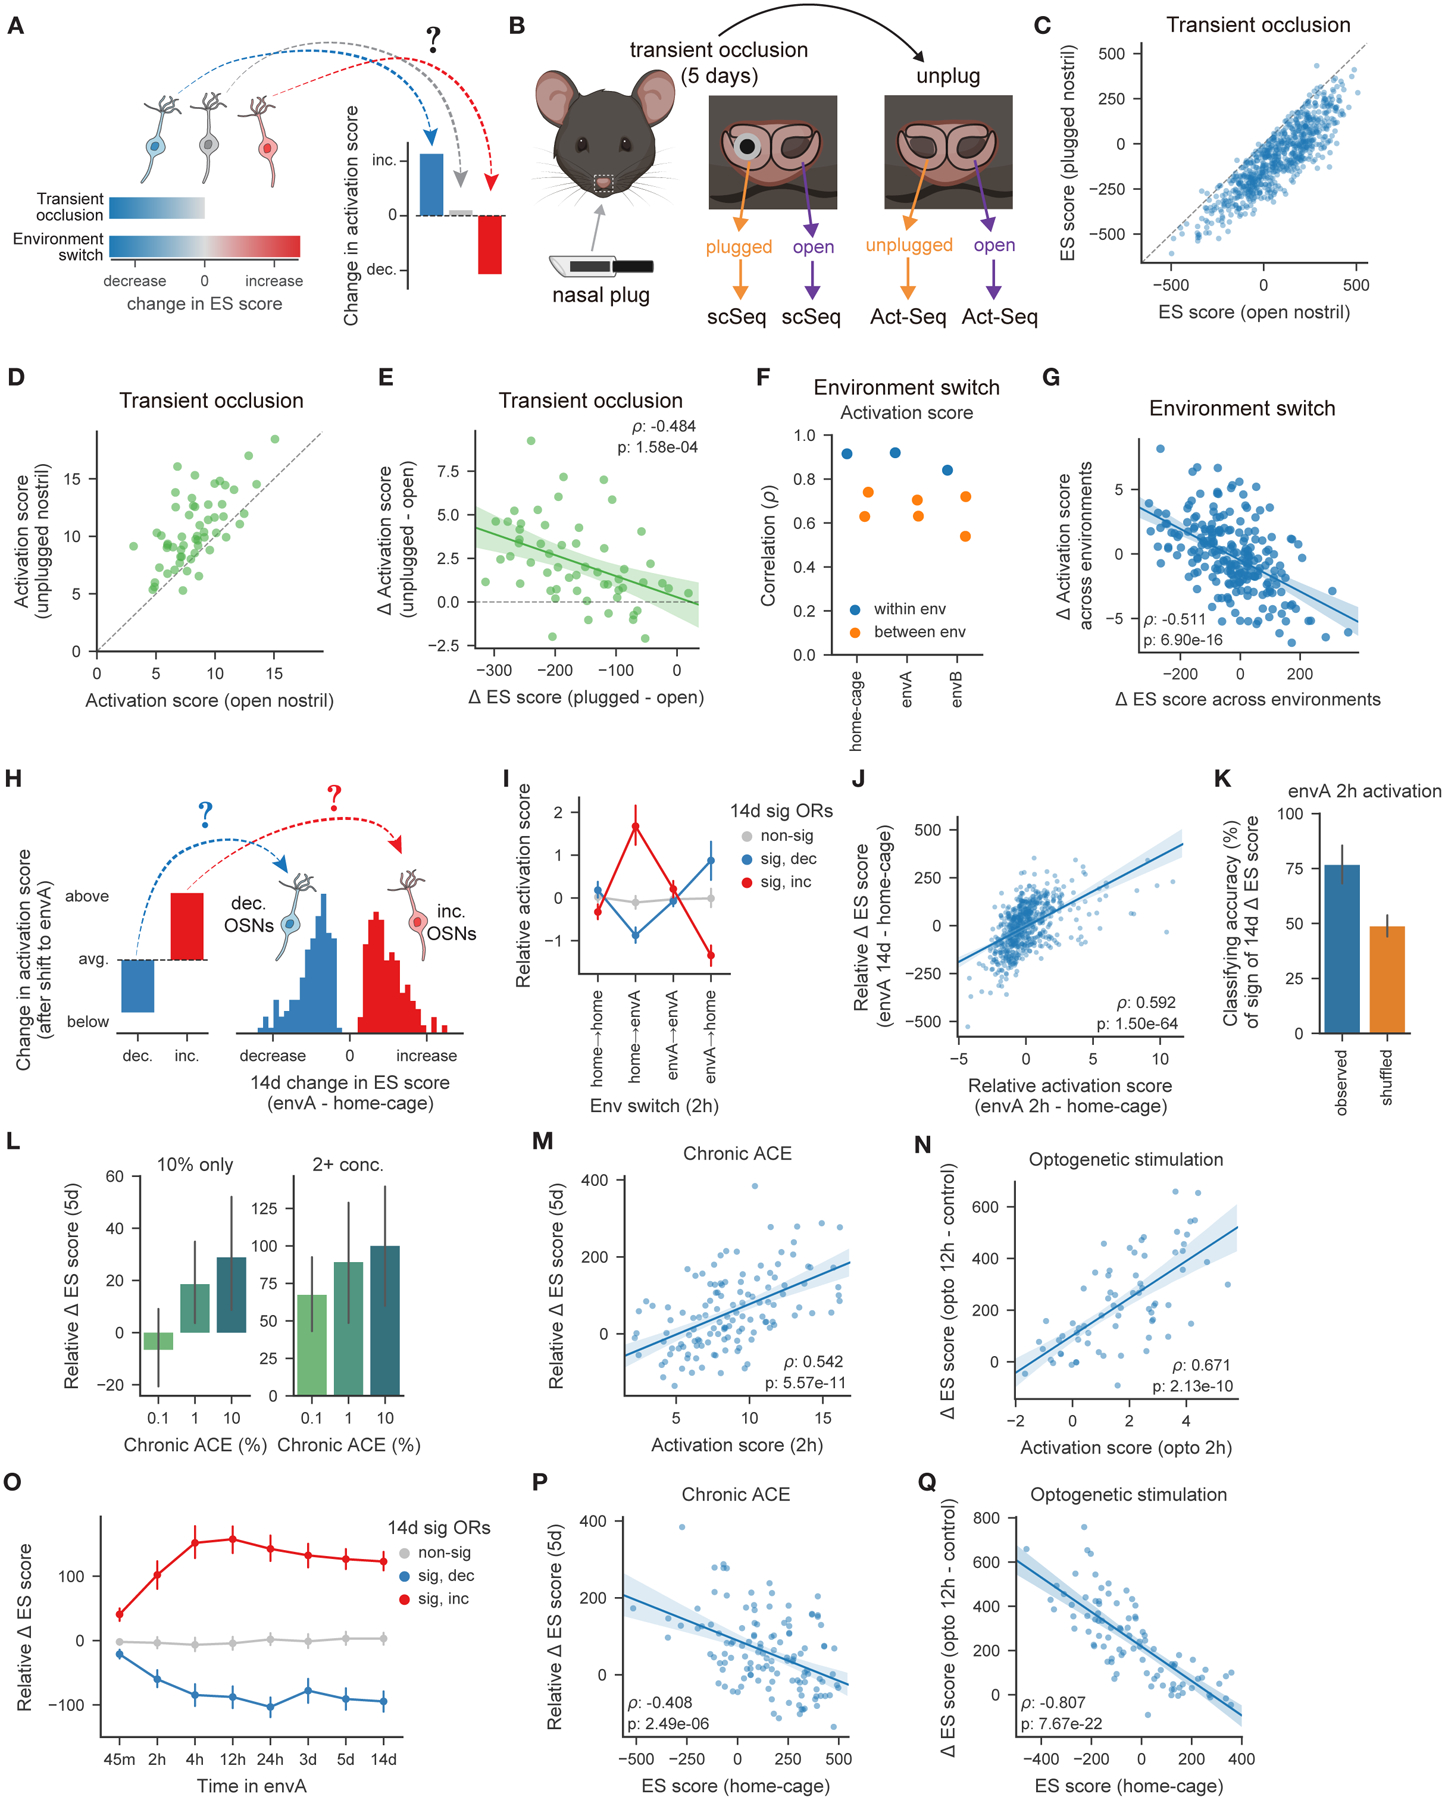
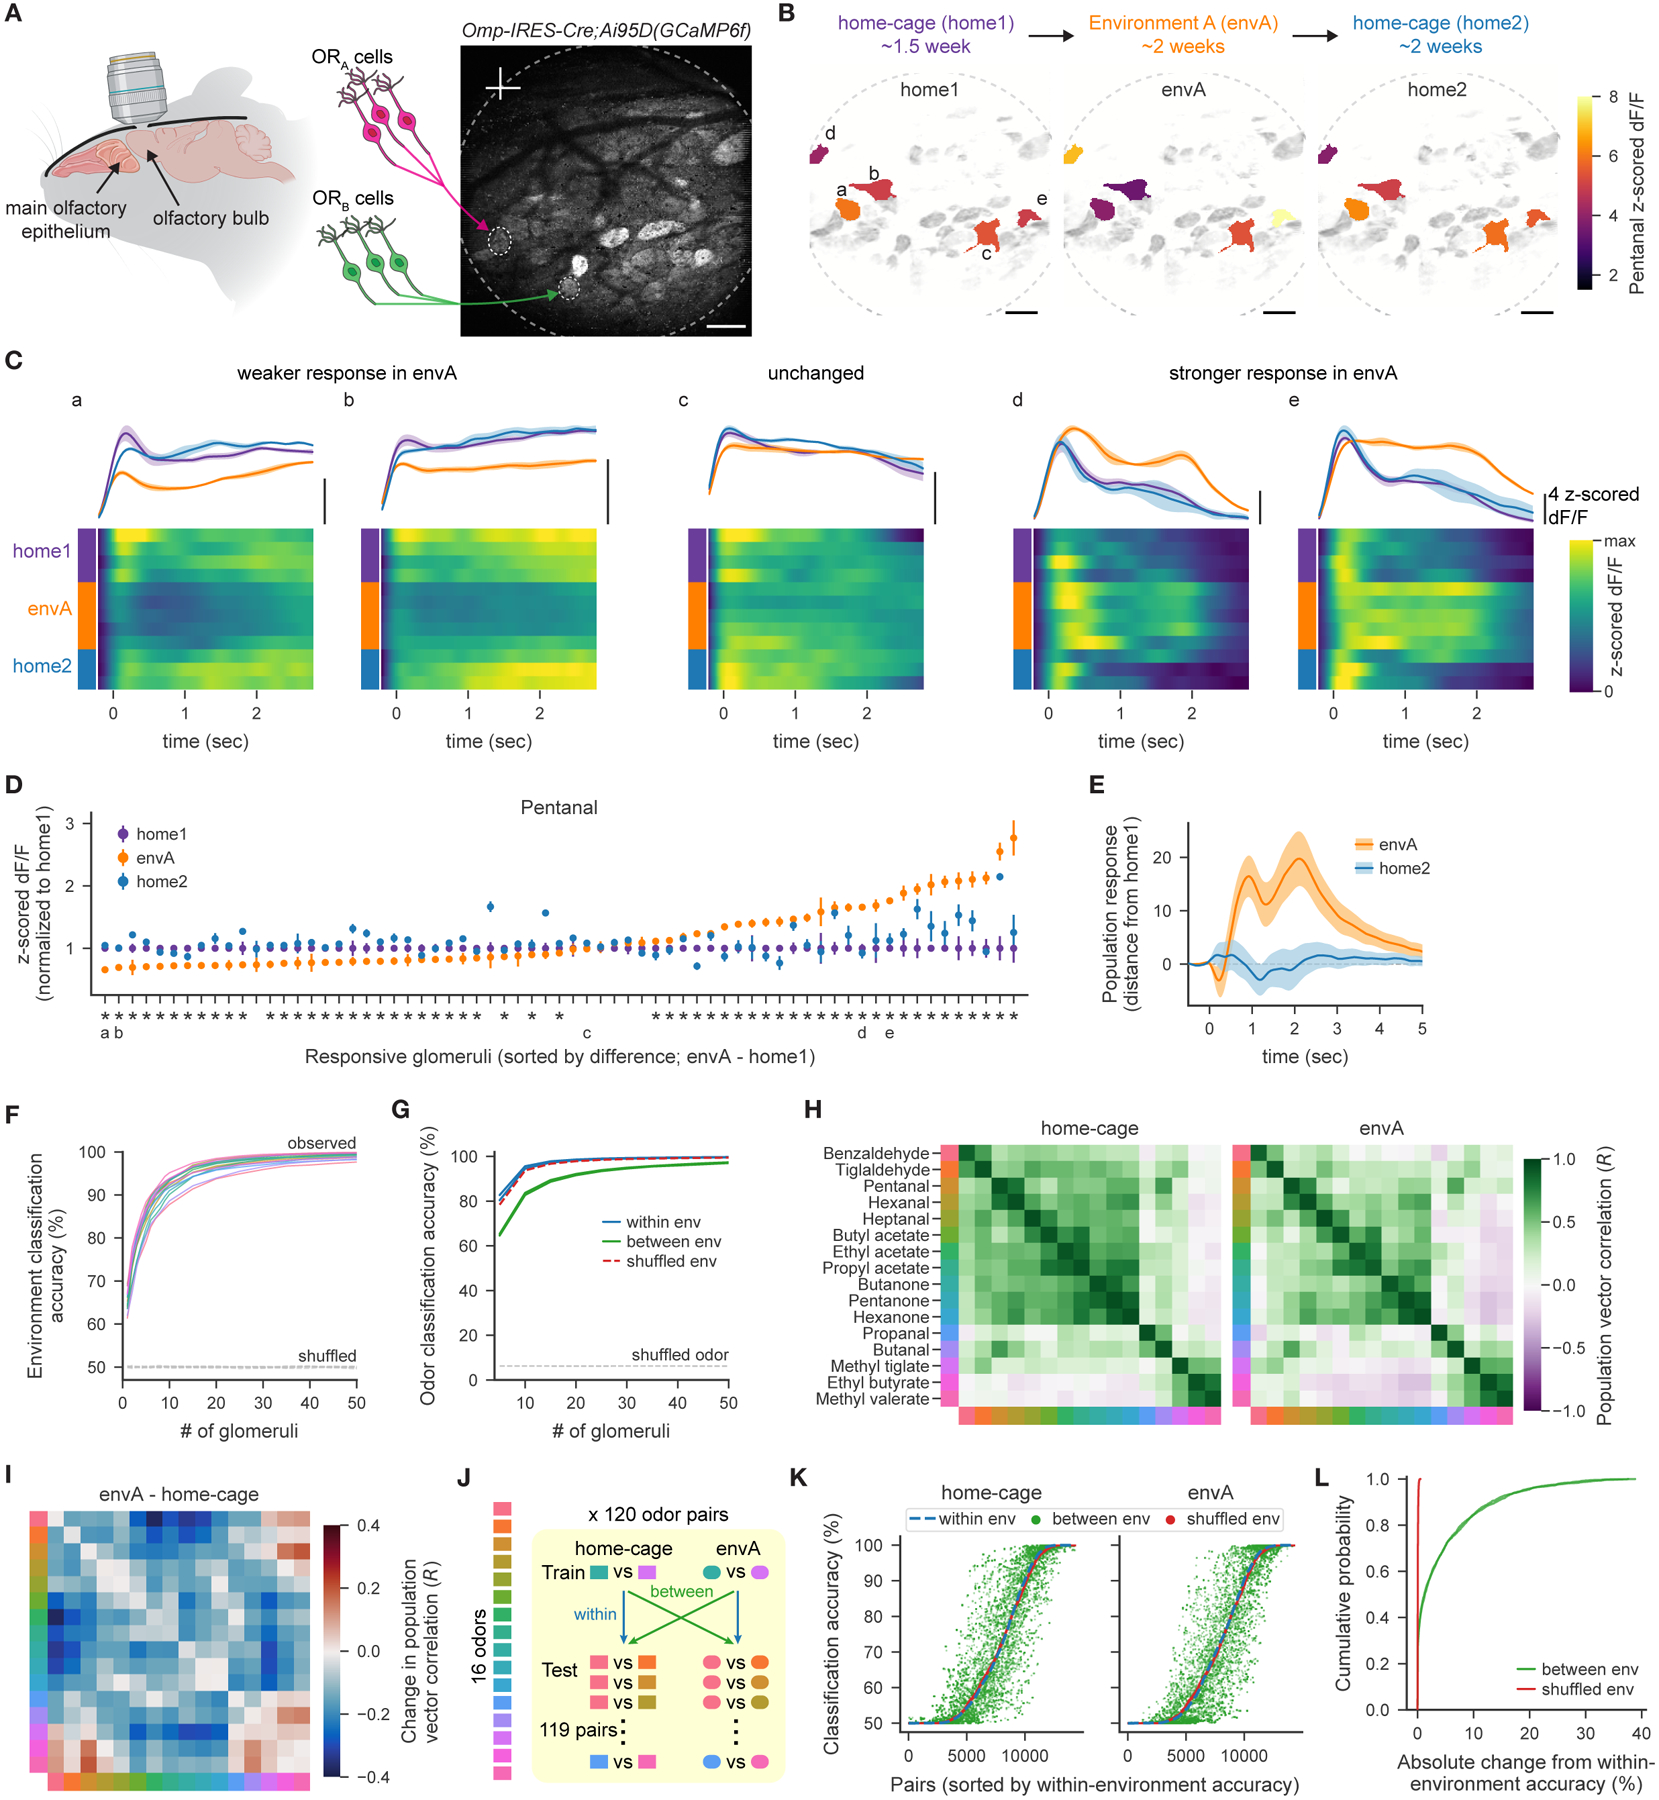
Animals traversing different environments encounter both stable background stimuli and novel cues, which are thought to be detected by primary sensory neurons and then distinguished by downstream brain circuits. Here, we show that each of the ∼1,000 olfactory sensory neuron (OSN) subtypes in the mouse harbors a distinct transcriptome whose content is precisely determined by interactions between its odorant receptor and the environment. This transcriptional variation is systematically organized to support sensory adaptation: expression levels of more than 70 genes relevant to transforming odors into spikes continuously vary across OSN subtypes, dynamically adjust to new environments over hours, and accurately predict acute OSN-specific odor responses. The sensory periphery therefore separates salient signals from predictable background via a transcriptional rheostat whose moment-to-moment state reflects the past and constrains the future; these findings suggest a general model in which structured transcriptional variation within a cell type reflects individual experience.

Keywords: Act-seq; adaptation; functional imaging; gene expression programs; homeostasis; odor coding; odorant receptor; olfaction; sensory neurons; single-cell RNA sequencing; transcription.


Conflict of interest statement

Declaration of interests The authors declare no competing interests.

Figures

Figure 1.
Figure 1.. Each OR is associated with a distinct OSN transcriptome
A. Schematic of single cell RNA-seq (scSeq) experiments. Odorant receptor (OR) genes, which identify each OSN subtype, were excluded from the highly variable genes used in downstream analyses of OSN gene expression. B. UMAP plots visualizing gene expression in mature OSNs, with normalized expression of known identity-related marker genes (38,345 mature OSNs from 6 mice depicted). C. UMAP plot depicting OSN subtypes expressing the indicated ORs. D. (left) Transcriptome distances between individual OSNs expressing Olfr727, Olfr728 or Olfr729 (color bars indicate individual mice). (right) Distributions of distances between cells expressing the same OR (within-OR, mean and 2.5–97.5th percentile across 1,000 restarts indicated) or different ORs (between-OR, mean and interquartile range across OSN subtypes of the pairwise distances between a given OSN subtype and all others indicated). E. Accuracy of pairwise linear classifiers at predicting via OSN transcriptomes which OR is expressed by a given OSN (black dashed line indicates median, boxes represent 25th/75th percentile, 12.5th/87.5th percentile, etc. across 831C2 =344,865 pairs). Classification performance is at chance levels upon shuffling OR labels across OSNs. F. Accuracy of linear classifiers predicting which OR (out of 831) is expressed, at varying levels of prediction accuracy, from perfect (0.0%) to the rate at which the correct OR was within the top 2.5% of predicted ORs. Distributions depict the mean accuracy across the 831 OR-defined OSN subtypes (each averaged across 1,000 restarts). Performance is at chance levels upon shuffling OR labels across OSNs. G. Accuracy of linear classifiers predicting which OR is expressed in an OSN from a held-out mouse, with training data provided from 5 separate mice. Both perfect (dark blue) and the top 1% (light blue) of predictions are shown. H. Schematic of the genomic loci for the OR-swap and P2-IRES-GFP mouse lines. I. UMAP plots of mature OSNs from wild-type and the mice shown in H. highlighting OSNs expressing M72, S50, or P2 receptors. J. Accuracy of linear classifiers predicting OR identity for OSNs expressing M72, S50, or P2, trained and tested as indicated. See also Figure S1.
Figure 2.
Figure 2.. OSN transcriptional variation can be decomposed into identity and activity gene expression programs.
A. Consensus non-negative matrix factorization (cNMF) identifies coherent gene expression programs (GEPs). Gene expression in each cell can be decomposed into a set of usages across a small number of GEPs, each of which are defined by their loadings for each gene. B. UMAP plots showing the usage of each functionally annotated GEP in mature OSNs from wild-type mice housed in the home cage. C. GEPHigh and GEPLow usages by the OSNs shown in B. Each point indicates the mean GEP usage for all OSNs expressing the same OR for each of the 831 ORs detected in at least 10 OSNs. D. Environmental state (ES) scores for each OSN are calculated by taking the difference between GEPHigh and GEPLow. E. Mean ES score for each OSN subtype. ES scores were shuffled 1,000 times across cells, and the mean interquartile range across shuffles is depicted in gray for each OSN subtype, with the mean across sorted shuffles depicted by the dashed line. F. As in B. but for ES scores. G. Between-mouse correlation coefficients of the mean ES score for each OSN subtype. H. Accuracy of pairwise linear classifiers (as in Fig. 1E) predicting OR identity using only the usages of GEPHigh and GEPLow. See also Figure S2, and Table S2.
Figure 3.
Figure 3.. OSN transcriptomes are shaped by the odor environment.
A. Schematic of the chronic naris occlusion experiment. B. UMAP plots of mature OSNs depicting the nostril of origin, ES scores, and OSNs expressing example ORs. C. Mean occlusion-dependent changes in GEP usage across OSN subtypes, as defined by OR expression. D. Mean ES score for each OSN subtype for each nostril. ES scores decreased by occlusion for 770 out of 797 OSN subtypes (FDR ≤ 0.01). E. Correlation of the mean ES scores for each OSN subtype from the indicated nostril pairs (p=1.68 × 10⁻⁵, Mann-Whitney U test, for both within- vs. between-nostril comparisons). F. Schematic of the chronic optogenetic stimulation experiment. G. Mean ES score for each dorsal OSN subtype from stimulated and control (no-light) mice. ES scores increased following optogenetic stimulation for 56 out of 90 subtypes (FDR ≤ 0.01). H. Distribution of mean ES scores across OSN subtypes from each condition. ES scores following optogenetic stimulation are right-shifted (p=1.33 × 10⁻³⁴, KS-test). I. Schematic of the environment switch experiment. J. UMAP plots highlighting (left) OSNs expressing example ORs from mice housed in each of the three environments. (right) OSN ES scores. K. Pairwise correlations of the mean ES scores for each OSN subtype, across mice from the indicated environments. L. Pairwise correlations from K. separated by the type of comparison. Correlations are higher for mice housed within the same environment (p=7.17 × 10⁻⁷, Mann-Whitney U test). M. Percent of OSN subtypes whose ES scores change significantly (FDR ≤ 0.01), for animals from the same or different environments. N. Distribution of ES score changes, for OSN subtypes from the same or different environments. ES score changes are larger between environments (p=5.16 × 10−140, KS-test). O. The observed occlusion-induced change in ES scores for each OSN subtype, as a function of ES scores from open nostrils. P. Distribution of the mean ES scores across OSN subtypes from each nostril. ES scores following occlusion are left-shifted (p=3.74 × 10−217, KS-test). Q. Accuracy of a minimum distance classification procedure (see Methods) to predict in which environment a mouse was housed, based upon ES scores for each OSN subtype (observed or shuffled environment as labeled, curves depict the mean and interquartile range of classification accuracy for each environment across 1000 restarts). R. Cumulative distribution of ES scores in a given reference environment for OSN subtypes whose ES scores were significantly increased, decreased, or unchanged across environments. Those OSNs whose ES scores decreased tended to have higher ES scores in the reference environment (p=4.03 × 10⁻⁸, KS-test); the opposite was true for those OSNs whose scores increased (p=2.32 × 10⁻¹⁴). See also Figure S3.
Figure 4.
Figure 4.. Large-scale transcriptional variation is organized into an environment-dependent rheostat.
A. Categorization of ES neuronal genes with high loadings in either GEPHigh or GEPLow, including “functional” genes that may regulate sensory responses. A subset of the 117 genes used in B, E, F are shown. B. Heatmap of the z-scored expression across OSN subtypes of 117 ES neuronal genes (including 73 functional genes). C. Expression (normalized by the total number of transcripts per cell and averaged across cells for each OSN subtype) of example functional genes associated with either GEPHigh (red) or GEPLow (blue), as a function of ES scores. D. Expression of 73 functional genes as a function of OSN ES scores (binned into 50 quantiles); plots depict the mean and standard deviation of the z-scored expression of functional genes associated with GEPHigh (red) and GEPLow (blue). E. (top) Heatmap of the chronic occlusion-dependent change in z-scored expression of ES neuronal genes for each OSN subtype. (bottom) Similar to D., but for changes in both functional gene expression and ES scores. F. Similar to E. but for environment-dependent changes in functional gene expression. See also Figure S4, and Tables S3 and S4.
Figure 5.
Figure 5.. Act-Seq identifies odor-responsive receptors and reveals that OSN transcriptomes determine acute in vivo odor responses.
A. Schematic of the Act-Seq experiment. B. z-scored expression of 10 immediate early genes (IEGs, listed in Methods) for each OSN subtype from control or odor conditions (acetophenone (ACE) or octanal (OCT)), sorted for each odor. IEG expression was higher in the odor conditions (p < 1 × 10⁻¹⁸ for each odor via Wilcoxon signed-rank test). C. Odor-evoked activation score for each OSN subtype, as a function of that evoked by control solvent (dipropylene glycol, DPG). Odor-evoked activation scores are higher for responsive OSN subtypes (in color, p < 1 × 10⁻¹⁴, one-sided Wilcoxon signed-rank test for each odor). D. Schematic of the acute (two hour) optogenetic stimulation experiment. E. Distribution of mean activation scores for OSN subtypes expressing dorsal ORs in optogenetically-stimulated and control conditions. Activation scores increase with stimulation frequency (p < 1 × 10⁻⁵, one-sided Jonckheere-Terpstra trend test). F. Percent of cells activated by acetophenone, for OSN subtypes that were responsive at 10% (and colored dark to light by the number of concentrations that activated each OSN subtype), increase with concentration (p < 1 × 10⁻⁵, one-sided Jonckheere-Terpstra trend test). G. Activation scores, for OSN subtypes that were responsive at 10%, increase with increasing concentrations of acetophenone, (p < 1 × 10⁻⁵, one-sided Jonckheere-Terpstra trend test). H. Activation scores for OSNs expressing either M72 (Olfr160) or Olfr923 to either acetophenone or 2-hydroxy acetophenone (2HA) at the indicated concentrations. I. Activation scores for each odor as a function of control ES scores, for odor-responsive OSN subtypes. J. Mean-squared error of predicted activation scores via linear regression models fit on either ES scores or expression of 73 functional genes, for odor-responsive OSN subtypes. Error bars represent mean and SD across 1,000 restarts, normalized to the models fit on ES scores. K. Activation scores for acetophenone-responsive OSN subtypes whose ORs have known in vitro EC50 values (Jiang et al., 2015; von der Weid et al., 2015). L. Similar to I. but for optogenetically-activated dorsal OSN subtypes (Medium intensity in D.). See also Figure S5, and Table S5.
Figure 6.
Figure 6.. Changes in OSN transcriptomes predict changes in acute odor responses, and acute odor responses predict long-term transcriptome changes.
A. Model depicting how occlusion- or environment-dependent changes in ES scores could affect acute odor responses. B. Schematic of transient naris occlusion followed by Act-Seq. C. ES score, for the 745 OSN subtypes identified in transiently-occluded (but not unplugged) mice. Occlusion decreased ES scores for 726 OSN subtypes (554 significantly at FDR ≤ 0.01). D. Activation scores for acetophenone-responsive OSN subtypes are higher in unplugged than open nostrils (p = 2.29 × 10⁻⁷, Wilcoxon signed-rank test). E. Changes in activation scores between acetophenone-responsive OSN subtypes from open or unplugged nostrils, as a function of the occlusion-dependent change for each subtype (as measured in the data in C.). F. Correlation of the activation scores for acetophenone-responsive OSN subtypes, using data from either the same or different environments. Activation scores are more consistent within a given environment (p = 0.014 Mann-Whitney U test). G. Changes in activation scores across environments, as a function of changes in ES scores across environments, for acetophenone-responsive OSN subtypes. H. Model depicting how activation upon a shift to a novel odor environment like environment A (envA) could subsequently change ES scores. I. Activation scores (relative to the mean across all OSN subtypes) two hours after the indicated environment shift. Compared to shifts between the same environment, home-envA and envA-home shifts induced opposing changes in activation scores, specifically for OSN subtypes with either significant increases or decreases in ES scores after two weeks (p < 1 × 10⁻⁵ one-sided Jonckheere-Terpstra trend test for both; p= p = 0.662 for OSN subtypes that remained constant after two weeks). J. Changes in ES scores as a function of activation scores observed two hours after a shift to envA, for each OSN subtype (relative to their mean across all OSN subtypes). K. Accuracy of classifiers predicting whether ES scores would rise or fall after two weeks, based upon the activation scores observed two hours after a shift to envA. For 1,000 restarts, classifiers were fit using only OSN subtypes with significant ES scores changes after two weeks in envA, and the mean accuracy was summarized across OSN subtypes (error bars depict the mean and SD across restarts, accuracy is at chance levels after permuting the signs of the ES score changes). L. Mean change in ES scores after five days of chronic exposure (relative to the mean across all OSN subtypes) to the indicated concentration of acetophenone for OSN subtypes that were acutely responsive to 10% odor (as identified in the experiments depicted in Fig. 5). Subtypes were separated into those responding to either 10% alone or at least two concentrations (significant effect of OR responsivity (10% only vs. at least two concentrations, F(1,270) = 43.04, p = 2.72 × 10⁻¹⁰) and chronic acetophenone concentration (F(2,270) = 4.48, p = 0.012) on ES score changes, but the interaction was not significant (F(2,270) = 0.0085, p = 0.99), via two-way ANOVA). M. Change in ES scores (relative to the mean across all OSN subtypes) after chronic exposure to acetophenone, as a function of the acute activation score, for all acetophenone-responsive OSN subtypes identified at each concentration. N. Same as M, but for ES score changes as a function of activation scores after acute optogenetic stimulation (Medium intensity, see Fig. 5D). O. Change in ES scores (relative to the mean across all OSN subtypes), at various timepoints after a home-envA shift, for OSN subtypes categorized based on the sign and significance of their two-week ES score changes. P. Similar to M. but for changes in ES scores (relative to the mean across all OSN subtypes) induced by chronic exposure to acetophenone as a function of ES scores from mice housed in the home-cage. Q. Similar to P. but for optogenetic stimulation and plotting changes in ES scores. See also Figure S6.
Figure 7.
Figure 7.. The ambient odor environment determines functional odor responses.
A. Schematic of the olfactory bulb imaging experiment. Scale bar = 200 μm. Data shown in A.-D. are from mouse 1 (see Fig. S7B). B. Mean z-scored dF/F responses to pentanal for example glomeruli and the mean fluorescence image (in gray) for each environment. Data from glomeruli marked a-e are depicted in C. and D. Scale bars = 200 μm. C. Z-scored dF/F responses for example glomeruli. Heatmaps depict average across trials within each session, and the mean ± SEM across sessions for each environment are shown above. D. Glomerular responses to pentanal for each environment (mean ± SEM across sessions), normalized to the home-cage (home1) response, for pentanal-responsive glomeruli. Asterisks indicate glomeruli whose responses in environment A (envA) differ from those of home1 (FDR ≤ 0.01, permutation test). E. Distance between the population response to pentanal in home1 and the response in either envA or home2, as a function of time (see Methods). Shaded error bars depict the mean and SD across 1000 restarts. F. Accuracy of pairwise linear classifiers predicting in which environment (home-cage or envA) a mouse was housed from the mean odor responses of increasing populations of glomeruli for each odor (as colored in H.). G. Accuracy of linear classifiers predicting odor identity from mean glomerular responses, to each of 16 odors, using increasing populations of glomeruli. Classification in which training and test data are from either the same or different environments, and from data with shuffled environment labels, are shown separately. H. Correlation matrix summarizing pairwise relationships between mean odor responses across the population of glomeruli from mouse 5 (see Fig. S7B). I. The difference between the correlation matrices shown in H. J. Procedure for evaluating changes in odor codes across environments, by assessing how well a given pairwise odor classifier generalizes, across all other odor pairs, to test data from the same or different environments. K. Classification accuracy for each of the test × train pairs (120 × 119 pairs), sorted by the accuracy when training and test data are from the same environment (within-environment). Colors depict whether training and test data are either from same or different environments, or from data with shuffled environment labels. L. Summary of K. showing the cumulative fraction of the absolute change in generalization accuracy, relative to within-environment accuracy. See also Figure S7.

References

    1. Aibar S, González-Blas CB, Moerman T, Huynh-Thu VA, Imrichova H, Hulselmans G, Rambow F, Marine J-C, Geurts P, Aerts J, et al. (2017). SCENIC: single-cell regulatory network inference and clustering. Nature Methods 14, 1083–1086. - PMC - PubMed
    1. Arneodo EM, Penikis KB, Rabinowitz N, Licata A, Cichy A, Zhang J, Bozza T, and Rinberg D (2018). Stimulus dependent diversity and stereotypy in the output of an olfactory functional unit. Nat Commun 9, 1347. - PMC - PubMed
    1. Attneave F (1954). Some informational aspects of visual perception. Psychol Rev 61, 183–193. - PubMed
    1. Barber CN, and Coppola DM (2015). Compensatory plasticity in the olfactory epithelium: age, timing, and reversibility. Journal of Neurophysiology 114, 2023–2032. - PMC - PubMed
    1. Barlow H (1961). Possible principles underlying the transformation of sensory messages. In Sensory Communication (Cambridge, MA: MIT press; ), pp. 217–234.

Publication types

Substances