. 2021 Dec 7;33(12):2380-2397.e9.
doi: 10.1016/j.cmet.2021.11.011.

NEAT1 is essential for metabolic changes that promote breast cancer growth and metastasis

Affiliations

NEAT1 is essential for metabolic changes that promote breast cancer growth and metastasis

Mi Kyung Park et al. Cell Metab. .

Abstract

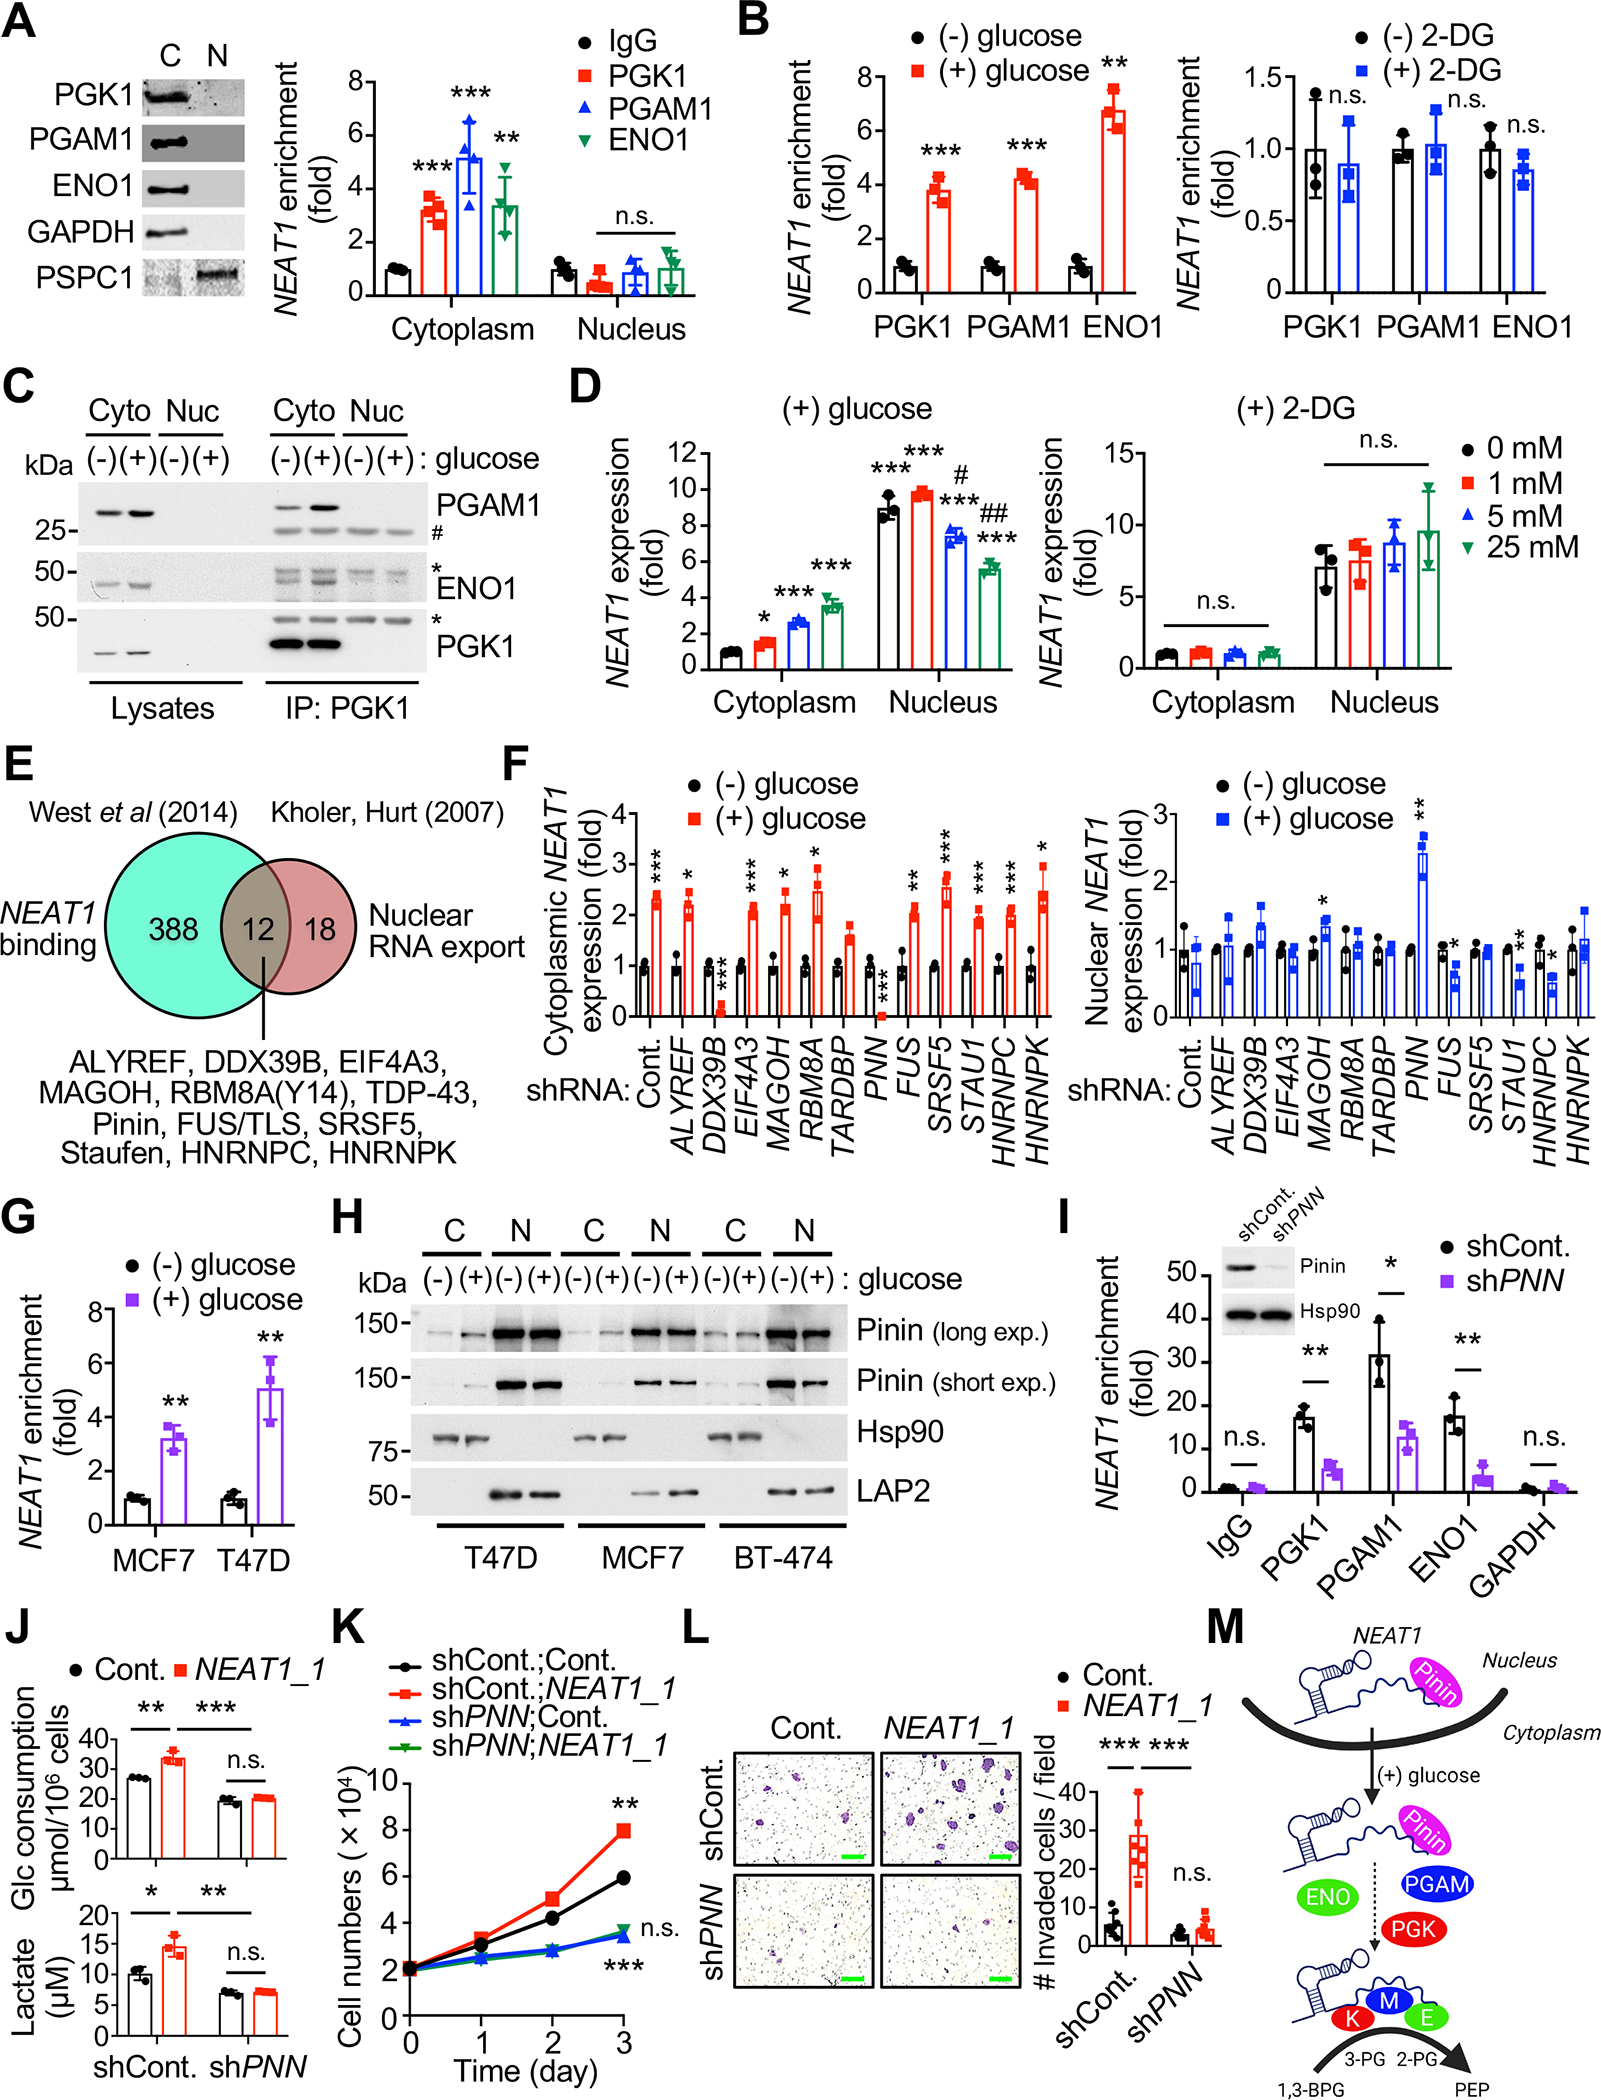
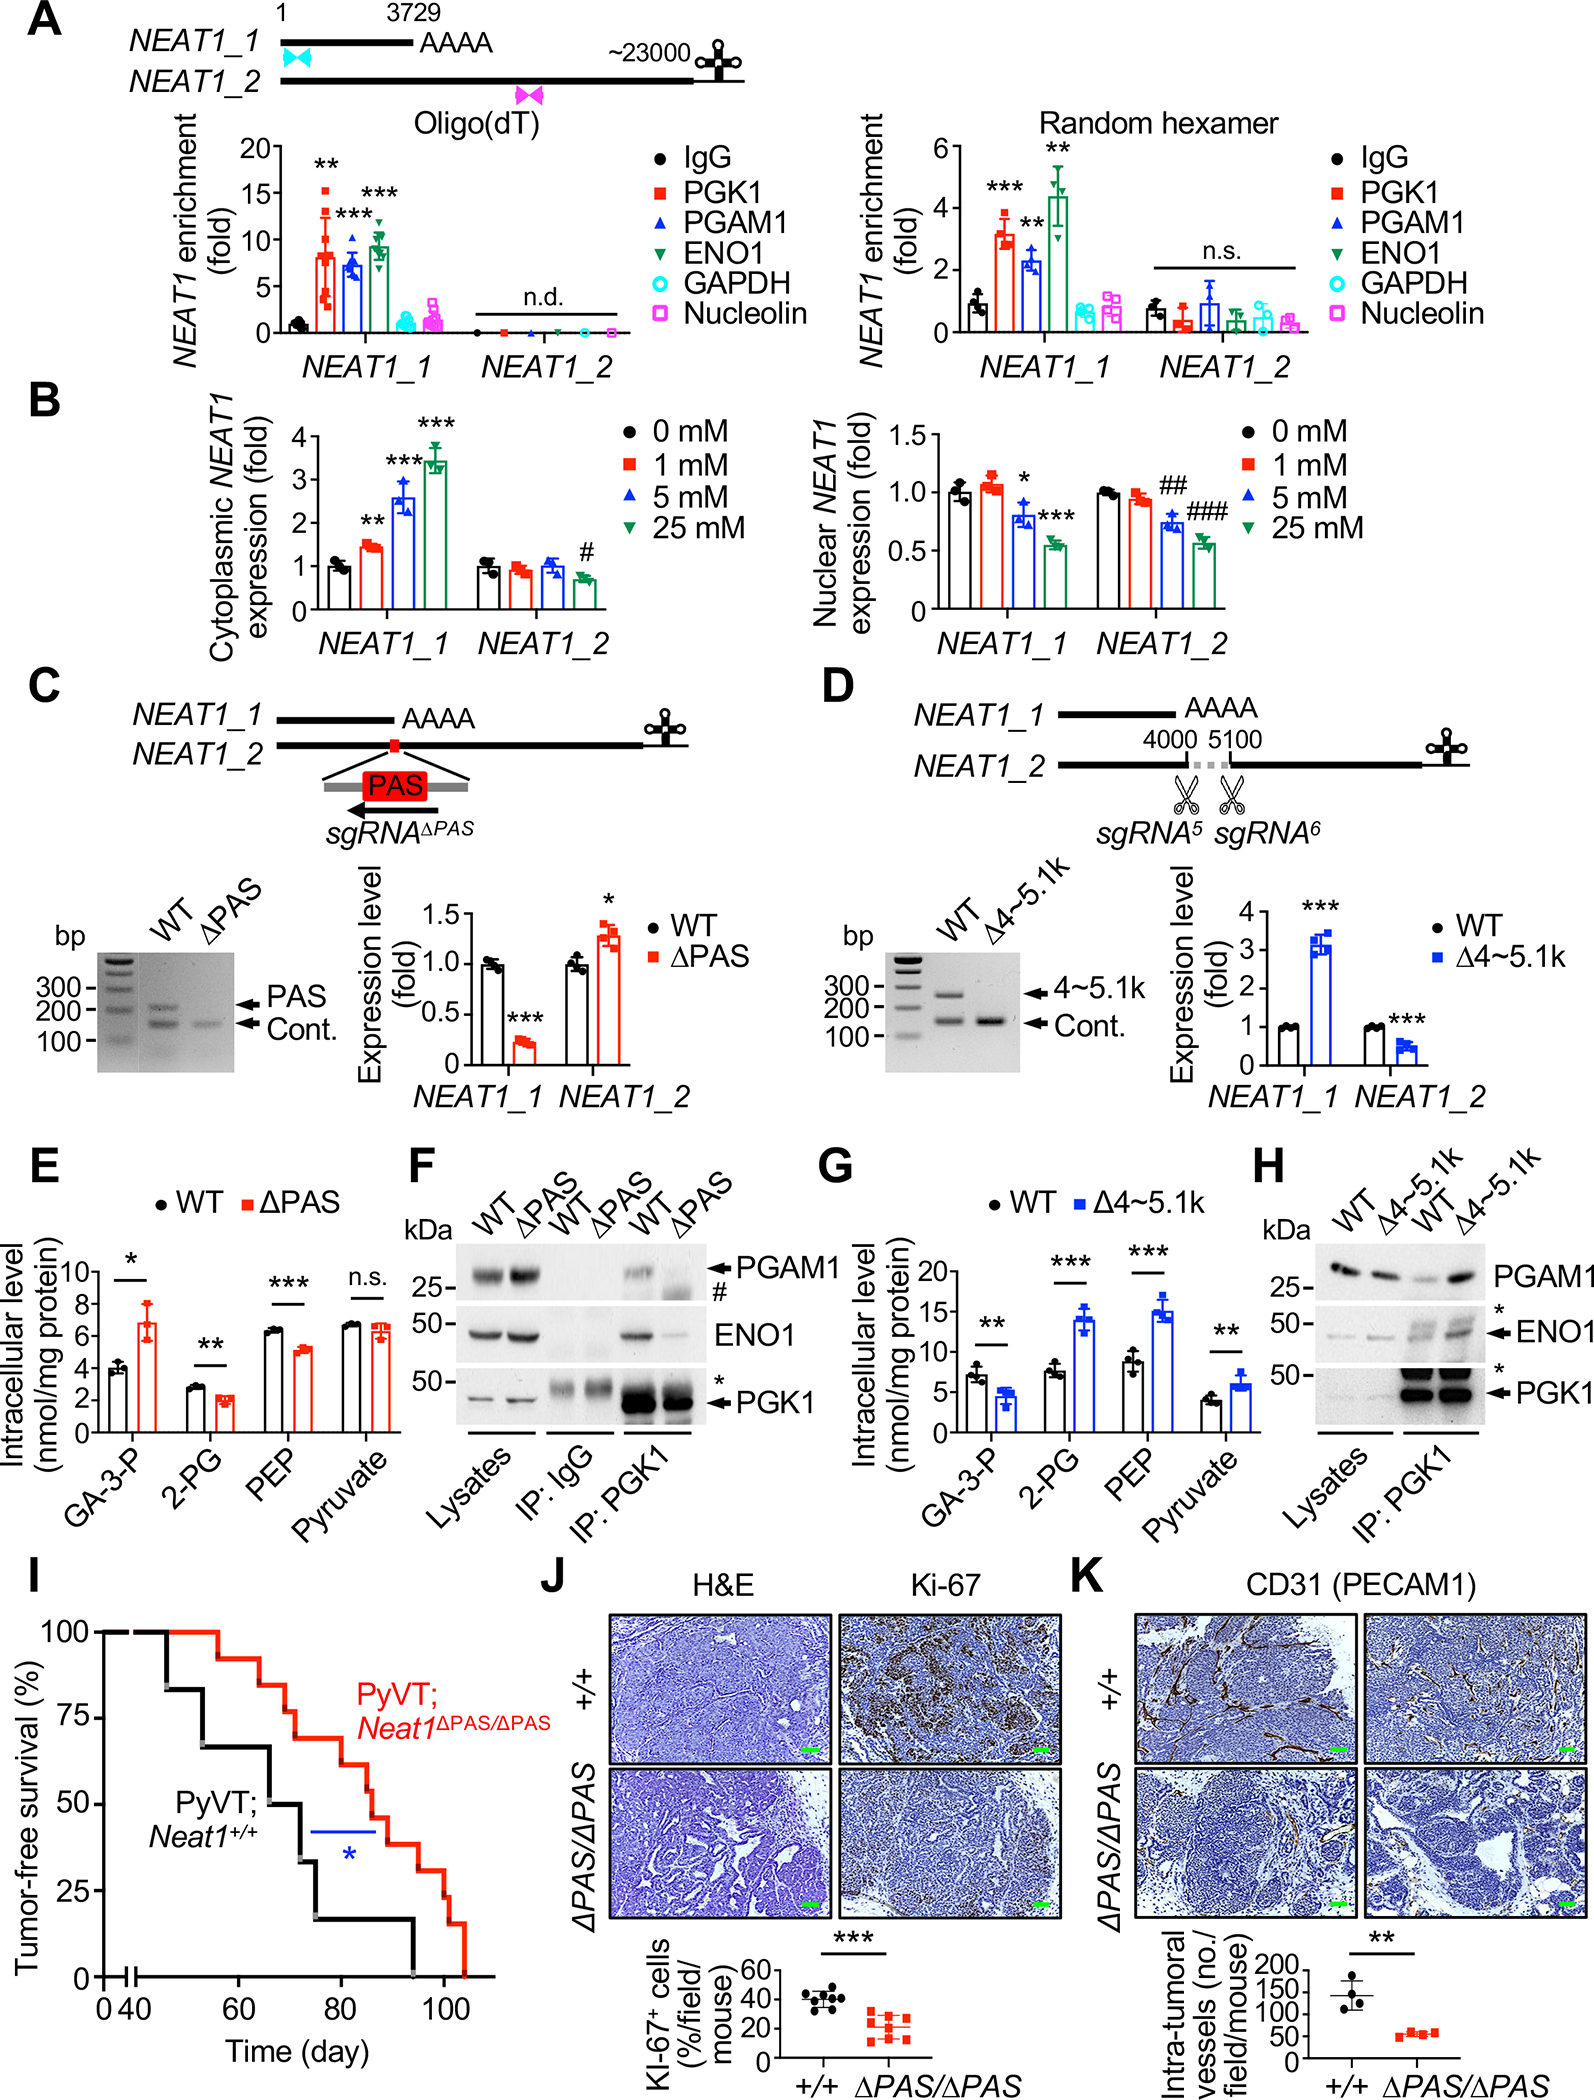
Accelerated glycolysis is the main metabolic change observed in cancer, but the underlying molecular mechanisms and their role in cancer progression remain poorly understood. Here, we show that the deletion of the long noncoding RNA (lncRNA) Neat1 in MMTV-PyVT mice profoundly impairs tumor initiation, growth, and metastasis, specifically switching off the penultimate step of glycolysis. Mechanistically, NEAT1 directly binds and forms a scaffold bridge for the assembly of PGK1/PGAM1/ENO1 complexes and thereby promotes substrate channeling for high and efficient glycolysis. Notably, NEAT1 is upregulated in cancer patients and correlates with high levels of these complexes, and genetic and pharmacological blockade of penultimate glycolysis ablates NEAT1-dependent tumorigenesis. Finally, we demonstrate that Pinin mediates glucose-stimulated nuclear export of NEAT1, through which it exerts isoform-specific and paraspeckle-independent functions. These findings establish a direct role for NEAT1 in regulating tumor metabolism, provide new insights into the Warburg effect, and identify potential targets for therapy.

Keywords: ENO1; NEAT1; PGAM1; PGK1; Pinin; Warburg effect; aerobic glycolysis; breast cancer; long noncoding RNA; tumor metabolism.


Conflict of interest statement

Declaration of interests The authors declare no competing interests.

Figures

Figure 1.
Figure 1.. Neat1 knockout or overexpression represses and promotes, respectively, aggressive breast tumor formation
(A) Tumor-free survival (TFS) analysis of PyVT;Neat1+/+ (n = 42, median TFS 70 days), PyVT;Neat1+/− (n = 18, median TFS 89 days) and PyVT;Neat1−/− (n = 10, median TFS 103 days) mice. (B) Mammary tumor weight isolated from PyVT;Neat1+/+ (n = 20), PyVT;Neat1+/− (n = 9) and PyVT;Neat1−/− (n = 8) mice was quantified (left). Representative images of mammary tumors isolated from mice are shown in right. (C) H&E and anti-Ki-67 stained sections of mammary tumors isolated from PyVT;Neat1+/+, PyVT;Neat1+/− and PyVT;Neat1−/− mice. Scale bars, 75 μm. (D) Sections of mammary tumors isolated from 130 days old PyVT;Neat1+/+ (n = 13) and PyVT;Neat1−/− (n = 4) mice stained with anti-CD31 (left) and quantification of intra-tumoral vessel numbers (right). Scale bars, 75 μm. (E) H&E and anti-PyV T antigen (Ag) stained sections of lungs isolated from 130 days old PyVT;Neat1+/+, PyVT;Neat1+/− and PyVT;Neat1−/− mice (left). The number of metastatic sites in lungs of 130 days old PyVT;Neat1+/+ (n = 18), PyVT;Neat1+/− (n =9) and PyVT;Neat1−/− (n = 10) mice was quantified (right). Arrowheads indicate clusters of metastatic cells in the lung. Scale bars, 75 μm. (F) Mammary tumor volumes of syngeneic C57BL/6 mice orthotopically implanted with Neat1OE PyVT cells were measured at different day. n = 9. (G) Representative images of mammary tumors isolated from (F) (top) and quantification of tumor weight (bottom). n = 8. (H) Sections of mammary tumors isolated from (F) stained with anti-Ki-67 (left) and quantification of the proportion of tumor cells positive for Ki-67 (right). Scale bars, 75 μm. n = 6. Error bars represent +/− SD. p value was determined by Log-rank (Mantel-Cox) test (A), ANOVA with Tukey’s multiple comparisons test (B and E) or Student’s t test (D, F, G and H) (n.s., non-significant; *p<0.05; **p<0.01; ***p<0.001). See also Figure S1.
Figure 2.
Figure 2.. NEAT1 controls the penultimate step of glycolysis in breast tumors
(A) Representative heat map of metabolome profiles in PyVT;Neat1+/+ and PyVT;Neat1−/− mice was analyzed by hierarchical clustering analysis. Heat map colors represent relative metabolite levels determined by CE-MS as indicated in the color key. G-6-P, glucose-6-phosphate; F-6-P, fructose-6-phosphate; 3-PG, 3-phosphoglyceric acid; 2-PG, 2-phosphoglyceric acid; PEP, phosphoenolpyruvic acid; Gro-3-P, glycerol-3-phosphate. n = 3. (B) Average absolute concentrations (pmol) of glycolytic metabolites, as indicated, per 106 cells isolated from PyVT;Neat1+/+ and PyVT;Neat1−/− mammary tumors were measured by metabolite assays. GA-3-P, glyceraldehyde-3-phosphate. n = 3~6. (C) A simplified representation depicting the glycolytic pathway in NEAT1-deficient tumors. High and low levels of metabolites in PyVT;Neat1−/− tumors are shown as red and green color, respectively. HK, hexokinse; GPI, G-6-P isomerase; PFK, phosphofructokinase; ALDO, aldolase; PK, pyruvate kinase. (D) The levels of glycolytic metabolites (nmol), as indicated, per 1 mg of protein of mammary tumors isolated from syngeneic C57BL/6 mice orthotopically implanted with Neat1OE PyVT cells were determined by CE-MS. n = 7. (E, F) Intracellular concentrations (nmol) of glycolytic metabolites, as indicated, per 1 mg of protein of BT-474 cells expressing NEAT1 siRNA targeting both the NEAT1_1 and NEAT1_2 isoforms together (E) and MCF7 cells overexpressing NEAT1_1 (F) were measured by CE-MS based and colorimetric assays. n = 3~4. (G) Total RNAs from paired normal and breast cancer tissue samples from patients were subjected to RT-qPCR for total NEAT1 and NEAT1_2. n = 20. BRCA, breast carcinoma. (H) Intracellular concentrations (nmol) of glycolytic metabolites, as indicated, per 1 mg of protein of (G) were measured by CE-MS based and colorimetric assays. n = 16. (I) Correlation curves showing the positive relationship between NEAT1 and 2-PG, PEP and pyruvate, but not GA-3-P, levels. n = 16. The correlation coefficients were calculated by the Pearson’s Chi-Square test. Error bars represent +/− SD. p value was determined by Student’s t test (n.s., non-significant; *p<0.05; **p<0.01; ***p<0.001). See also Figure S2.
Figure 3.
Figure 3.. NEAT1 interacts with PGK1, PGAM1 and ENO1
(A) Lysates from MCF7 cells were subjected to NEAT1 RNA immunoprecipitation (RIP) with IgG and anti-PGK1, –PGAM1, –ENO1 or –GAPDH. (B) Lysates from MCF7 cells were subjected to CLIP-qPCR for NEAT1_1 segments, as shown in top diagram, with IgG and anti-PGK1, –PGAM1 or –ENO1. A secondary structure model of NEAT1 (Lin et al., 2018) in bottom right. The four structural domains are highlighted with different colors, and the NEAT1_1 sequence motifs that are recognized by PGK1, PGAM1 and ENO1 are drawn as dashed lines. (C, F) Generation of MCF7 cell lines lacking the NEAT1 sequence motifs that are recognized by PGAM1 and ENO1 (Δ1033~2115 bp; Δ1~2.1k) (C) or PGK1 (Δ2116~2805 bp; Δ2.1~2.8k) (F) using CRISPR/Cas9 technology with a series of sgRNAs (left). Lysates from wild-type (WT) and Δ1~2.1k or Δ2.1~2.8k cells were subjected to NEAT1 RIP with IgG and anti-PGK1, –PGAM1 or –ENO1 (right). n = 3~4. (D, G) Glucose consumption (left) and lactate production (right) by WT and Δ1~2.1k (D) or Δ2.1~2.8k (G) cells were determined by enzymatic assays. n = 3. (E, H) Intracellular concentrations (nmol) of glycolytic metabolites, as indicated, per 1 mg of protein of WT and Δ1~2.1k (E) or Δ2.1~2.8k (H) cells were measured by CE-MS based and colorimetric assays. n = 3~4. (I, L, O) Lysates from MCF7 cells expressing PGK1 (I), PGAM1 (L) or ENO1 (O) shRNA together with exogenous WT or K/R-to-A mutants, as indicated, PGK1, PGAM1 or ENO1 from an ORF transcript lacking the 3’-UTR sequences targeted by shRNA were subjected to RIP-qPCR for NEAT1 with IgG and anti-PGK1, –PGAM1 or –ENO1 (left). Structure-based prediction of NEAT1 and PGK1, PGAM1 or ENO1 interaction (right). Basic residues are displayed in blue and acidic residues are shown in red. The PGK1, PGAM1 and ENO1 protein structures were visualized with Swiss-PdbViewer (PDBID:3C39, PDBID:4GPI and PDBID:3B97, respectively). (J, M, P) Glucose consumption (μmol/106 cells) of (top) and lactate production (μM) (bottom) by MCF7 cells expressing PGK1 (J), PGAM1 (M) or ENO1 (P) shRNA together with exogenous WT or K/R-to-A mutants, as indicated, PGK1, PGAM1 or ENO1 were determined by enzymatic assays. n = 3~4. (K, N, Q) Intracellular concentrations (nmol) of glycolytic metabolites, as indicated, per 1 mg of protein of MCF7 cells expressing PGK1 (K), PGAM1 (N) or ENO1 (Q) shRNA together with exogenous WT or K/R-to-A mutants, as indicated, PGK1, PGAM1 or ENO1 were determined by colorimetric assays. n = 3. Error bars represent +/− SD. p value was determined by Student’s t test (n.s., non-significant; *p<0.05; **p<0.01; ***p<0.001). See also Figure S3.
Figure 4.
Figure 4.. NEAT1 bridges PGK1/PGAM1/ENO1 complexes for high glycolysis
(A) Recombinant PGK1, PGAM1 and ENO1 proteins incubated with in vitro-transcribed NEAT1_1 sense or anti-sense transcript (left) were immunoprecipitated (IP) with anti-PGK1 then immunoblotted (right). * and # indicate the heavy chain and light chain, respectively, of IgG. $ indicates non-specific band. (B) Lysates from PyVT;Neat1+/+ and PyVT;Neat1−/− mammary tumors were IP with anti-PGK1 then immunoblotted as indicated. (C) Lysates from mammary tumors of syngeneic C57BL/6 mice orthotopically implanted with Neat1OE PyVT cells were IP with anti-PGK1 then immunoblotted as indicated. (D) Lysates from MCF7 cells expressing NEAT1_1 together with the GFP-tagged NH2- and COOH–terminal domains, as indicated, of PGK1 (left), PGAM1 (middle) or ENO1 (right) were IP with anti-GFP then immunoblotted as indicated. * indicates the heavy chain of IgG. (E, F) Lysates from Δ1~2.1k (E) or Δ2.1~2.8k (F) MCF7 cells were IP with anti-PGK1 then immunoblotted as indicated. * indicates the heavy chain of IgG. (G) A proposed model for the role of NEAT1 to constitute a scaffold bridge in the assembly of the PGK1/PGAM1/ENO1 multienzyme complexes for high glycolysis in breast cancer (created with BioRender.com). (H–J) Lysates from MCF7 cells expressing PGK1 (H), PGAM1 (I) or ENO1 (J) shRNA together with exogenous WT or K/R-to-A mutants, as indicated, PGK1, PGAM1 or ENO1 from an ORF transcript lacking the 3’-UTR sequences targeted by shRNA (left) were IP with IgG (middle) and anti-PGK1, –PGAM1 or –ENO1 (right) then immunoblotted as indicated. * and # indicate the heavy chain and light chain, respectively, of IgG. See also Figure S4.
Figure 5.
Figure 5.. Blockade of penultimate glycolysis reduces NEAT1-dependent tumorigenesis
(A) Growth curves of Neat1OE PyVT cells expressing Gapdh, Pgk1, Pgam1 or Eno1 siRNAs. n = 3. The inset indicates the RNAi mediated knockdown efficiency for the indicated genes. (B) Growth curves of Neat1OE PyVT cells treated with the GAPDH inhibitor koningic acid (KA) (1 μM), the PGK1 inhibitor NG52 (10 μM), the PGAM1 inhibitor PGMI-004A (20 μM) or the ENO1 inhibitor POMHEX (1 μM). n = 3. (C) Tumor-free survival (TFS) analysis of PyVT;Neat1+/+ and PyVT;Neat1−/− mice treated with vehicle (n = 21 for PyVT;Neat1+/+ mice, median TFS 70 days; n = 7 for PyVT;Neat1−/− mice, median TFS 111 days) or POMHEX (n = 9 for PyVT;Neat1+/+ mice, median TFS 96 days; n = 5 for PyVT;Neat1−/− mice, median TFS 112 days). TFS curves of vehicle-treated PyVT;Neat1+/− mice (n = 9, median TFS 91 days) are also shown. (D) The weight of mammary tumor isolated from 130 days old vehicle-treated PyVT;Neat1+/+ (n = 15), POMHEX-treated PyVT;Neat1+/+ (n = 9) and vehicle-treated PyVT;Neat1+/− (n = 7) mice were quantified (left). Representative images of mammary tumors isolated from mice are shown in right. (E) H&E and anti-Ki-67 stained sections of mammary tumors isolated from vehicle-treated PyVT;Neat1+/+, POMHEX-treated PyVT;Neat1+/+ and vehicle-treated PyVT;Neat1+/− mice. Scale bars, 75 μm. (F) H&E and anti-PyVT Ag stained sections of lungs isolated from 130 days old vehicle-treated PyVT;Neat1+/+ (n = 11), POMHEX-treated PyVT;Neat1+/+ (n = 5) and vehicle-treated PyVT;Neat1+/− (n = 7) mice (left). Arrowheads indicate clusters of metastatic cells in the lung. The number of metastatic sites in lungs of mice was also quantified (right). Scale bars, 75 μm. (G, H) Growth curves (G) and cell invasion assays (H) of BT-474 cells expressing NEAT1 siRNA targeting both NEAT1 isoforms treated with increasing concentrations (μg/ml), as indicated, of phosphoenolpyruvate (PEP). n = 4. (I) TFS analysis of PyVT;Neat1+/+ and PyVT;Neat1+/− mice treated with vehicle (n = 20 for PyVT;Neat1+/+ mice, median TFS 87 days; n = 20 for PyVT;Neat1+/− mice, median TFS 99 days) or pyruvate (n = 12 for PyVT;Neat1+/+ mice, median TFS 80 days; n = 13 for PyVT;Neat1+/− mice, median TFS 82 days). Error bars represent +/− SD. p value was determined by ANOVA with Tukey’s multiple comparisons test (A, B, D, F, G and H) or Log-rank (Mantel-Cox) test (C and I) (n.s., non-significant; *p<0.05; **p<0.01; ***p<0.001). See also Figure S5.
Figure 6.
Figure 6.. Glucose-stimulated nuclear export of NEAT1 is Pinin-dependent
(A) Cytoplasmic (C) and nuclear (N) fractions from MCF7 cells (left) were subjected to NEAT1 RNA immunoprecipitation (RIP) with IgG and anti-PGK1, –PGAM1 or –ENO1 (right). n = 4. GAPDH and PSPC1 serve as controls. (B) Cytoplasmic fraction from MCF7 cells cultured in glucose-free media for 16 hours [(−) glucose] and stimulated for 2 hours by re-addition of 5 mM glucose [(+) glucose] (left) or 2-deoxyglucose (2-DG) [(+) 2-DG] (right) were subjected to NEAT1 RIP with IgG and anti-PGK1, –PGAM1 or –ENO1. n = 3. (C) Cytoplasmic and nuclear fractions from MCF7 cells grown in the indicated conditions were IP with anti-PGK1 then immunoblotted as indicated. (D) Cytoplasmic and nuclear fractions from MCF7 cells cultured in glucose-free media and stimulated by re-addition of different amounts, as indicated, of glucose (left) or 2-DG (right) were subjected to RT-qPCR for NEAT1. n = 3. (E) Bioinformatic analysis of public datasets for proteins with known roles in nuclear export of various classes of RNAs and proteomics with NEAT1 CHART-MS. (F) Cytoplasmic (left) and nuclear (right) fractions from MCF7 cells expressing the indicated shRNAs grown in the indicated conditions were subjected to RT-qPCR. n = 3. (G) Cytoplasmic fraction from MCF7 and T47D cells grown in the indicated conditions were subjected to NEAT1 RIP with IgG and anti-Pinin. n = 3. (H) Cytoplasmic (C) and nuclear (N) fractions from T47D, MCF7 and BT-474 cells grown in the indicated conditions were immunoblotted as indicated. Hsp90 and LAP2 serve as controls. (I) Cytoplasmic fraction from T47D cells expressing PNN shRNA grown in the indicated conditions were subjected to NEAT1 RIP with IgG and anti-PGK1, –PGAM1, –ENO1 or –GAPDH. n = 3. The inset indicates the RNAi mediated knockdown efficiency for PNN. (J) Glucose consumption (top) and lactate production (bottom) by T47D cells expressing PNN shRNA together with NEAT1_1 as indicated were determined by enzymatic assays. n = 3. (K, L) Growth curves (K) and cell invasion assays (L) of T47D cells expressing PNN shRNA and NEAT1_1 as indicated. n = 4. (M) A proposed model for the role of Pinin for glucose-stimulated nuclear export of NEAT1 enabling PGK1/PGAM1/ENO1 complex formation (created with BioRender.com). Error bars represent +/− SD. p value was determined by Student’s t test (A, B, D, F, G and I) or ANOVA with Tukey’s multiple comparisons test (J–L) (n.s., non-significant; *,#p<0.05; **,##p<0.01; ***p<0.001). See also Figure S6.
Figure 7.
Figure 7.. NEAT1_1 isoform is essential for glycolysis and progression of breast cancer
(A) Schematic representation of human NEAT1 isoforms (top). Blue and red arrowheads indicate RT-qPCR primers that specifically detect total NEAT1 and NEAT1_2, respectively. Lysates from MCF7 cells were subjected to NEAT1_1 and NEAT1_2 RNA immunoprecipitation (RIP) with IgG and anti-PGK1, –PGAM1 or –ENO1 and RT-qPCR with oligo(dT) priming (bottom left) or random hexamer priming (bottom right), respectively. Anti-GAPDH and –nucleolin serve as controls. n = 3~7. n.d., not determined. (B) Cytoplasmic (left) and nuclear (right) fractions from MCF7 cells grown in the indicated conditions were subjected to RT-qPCR for NEAT1_1 and NEAT1_2. n = 3. (C, D) Generation of MCF7 cell lines lacking the NEAT1 sequence motifs that are essential for NEAT1_1 (Δ3699~3786 bp; ΔPAS) (C) or NEAT1_2 (Δ4054~5116 bp; Δ4~5.1k) (D) using CRISPR/Cas9 technology with a series of sgRNAs (top). The resulting PCR genotyping (bottom left) and expression analysis by RT-qPCR (bottom right) in ΔPAS (C) and Δ4~5.1k (D) cells. n = 4. (E, G) Intracellular concentrations (nmol) of glycolytic metabolites, as indicated, per 1 mg of protein of wild-type (WT) and ΔPAS (E) or Δ4~5.1k (G) cells were measured by CE-MS based and colorimetric assays. n = 3. (F, H) Lysates from WT and ΔPAS (F) or Δ4~5.1k (H) cells were immunoprecipitated (IP) with IgG and anti-PGK1 then immunoblotted as indicated. * and # indicate the heavy and light chain of IgG. (I) Tumor-free survival (TFS) analysis of the PyVT;Neat1+/+ (n = 7, median TFS 67 days) and PyVT;Neat1ΔPAS/ΔPAS (n = 13, median TFS 85 days) mice. (J) H&E and anti-Ki-67 stained sections of mammary tumors isolated from 134~139 days old PyVT;Neat1+/+ and PyVT;Neat1ΔPAS/ΔPAS mice (top) and quantification of the proportion of tumor cells positive for Ki-67 (bottom). Scale bars, 75 μm. n = 4. (K) Sections of mammary tumors isolated from 134~139 days old PyVT;Neat1+/+ and PyVT;Neat1ΔPAS/ΔPAS mice stained with anti-CD31 (top) and quantification of intra-tumoral vessel numbers (bottom). Scale bars, 75 μm. n = 4. Error bars represent +/− SD. p value was determined by ANOVA with Tukey’s multiple comparisons test (A and B), Student’s t test (C–E, G, J and K) or Log-rank (Mantel-Cox) test (I) (n.s., non-significant; *,#p<0.05; **,##p<0.01; ***,###p<0.001). See also Figure S7.

References

    1. Adriaens C, Rambow F, Bervoets G, Silla T, Mito M, Chiba T, Asahara H, Hirose T, Nakagawa S, Jensen TH, et al. (2019). The long noncoding RNA NEAT1_1 is seemingly dispensable for normal tissue homeostasis and cancer cell growth. RNA 25, 1681–1695. - PMC - PubMed
    1. Adriaens C, Standaert L, Barra J, Latil M, Verfaillie A, Kalev P, Boeckx B, Wijnhoven PW, Radaelli E, Vermi W, et al. (2016). p53 induces formation of NEAT1 lncRNA-containing paraspeckles that modulate replication stress response and chemosensitivity. Nat Med 22, 861–868. - PubMed
    1. Alpatov R, Munguba GC, Caton P, Joo JH, Shi Y, Shi Y, Hunt ME, and Sugrue SP (2004). Nuclear speckle-associated protein Pnn/DRS binds to the transcriptional corepressor CtBP and relieves CtBP-mediated repression of the E-cadherin gene. Mol Cell Biol 24, 10223–10235. - PMC - PubMed
    1. Cancer Genome Atlas, N. (2012). Comprehensive molecular portraits of human breast tumours. Nature 490, 61–70. - PMC - PubMed
    1. Castellana M, Wilson MZ, Xu Y, Joshi P, Cristea IM, Rabinowitz JD, Gitai Z, and Wingreen NS (2014). Enzyme clustering accelerates processing of intermediates through metabolic channeling. Nat Biotechnol 32, 1011–1018. - PMC - PubMed

Publication types