. 2021 Dec 7;37(10):110095.
doi: 10.1016/j.celrep.2021.110095.

Stage-specific regulation of DNA methylation by TET enzymes during human cardiac differentiation

Affiliations

Stage-specific regulation of DNA methylation by TET enzymes during human cardiac differentiation

Yahui Lan et al. Cell Rep. .

Abstract

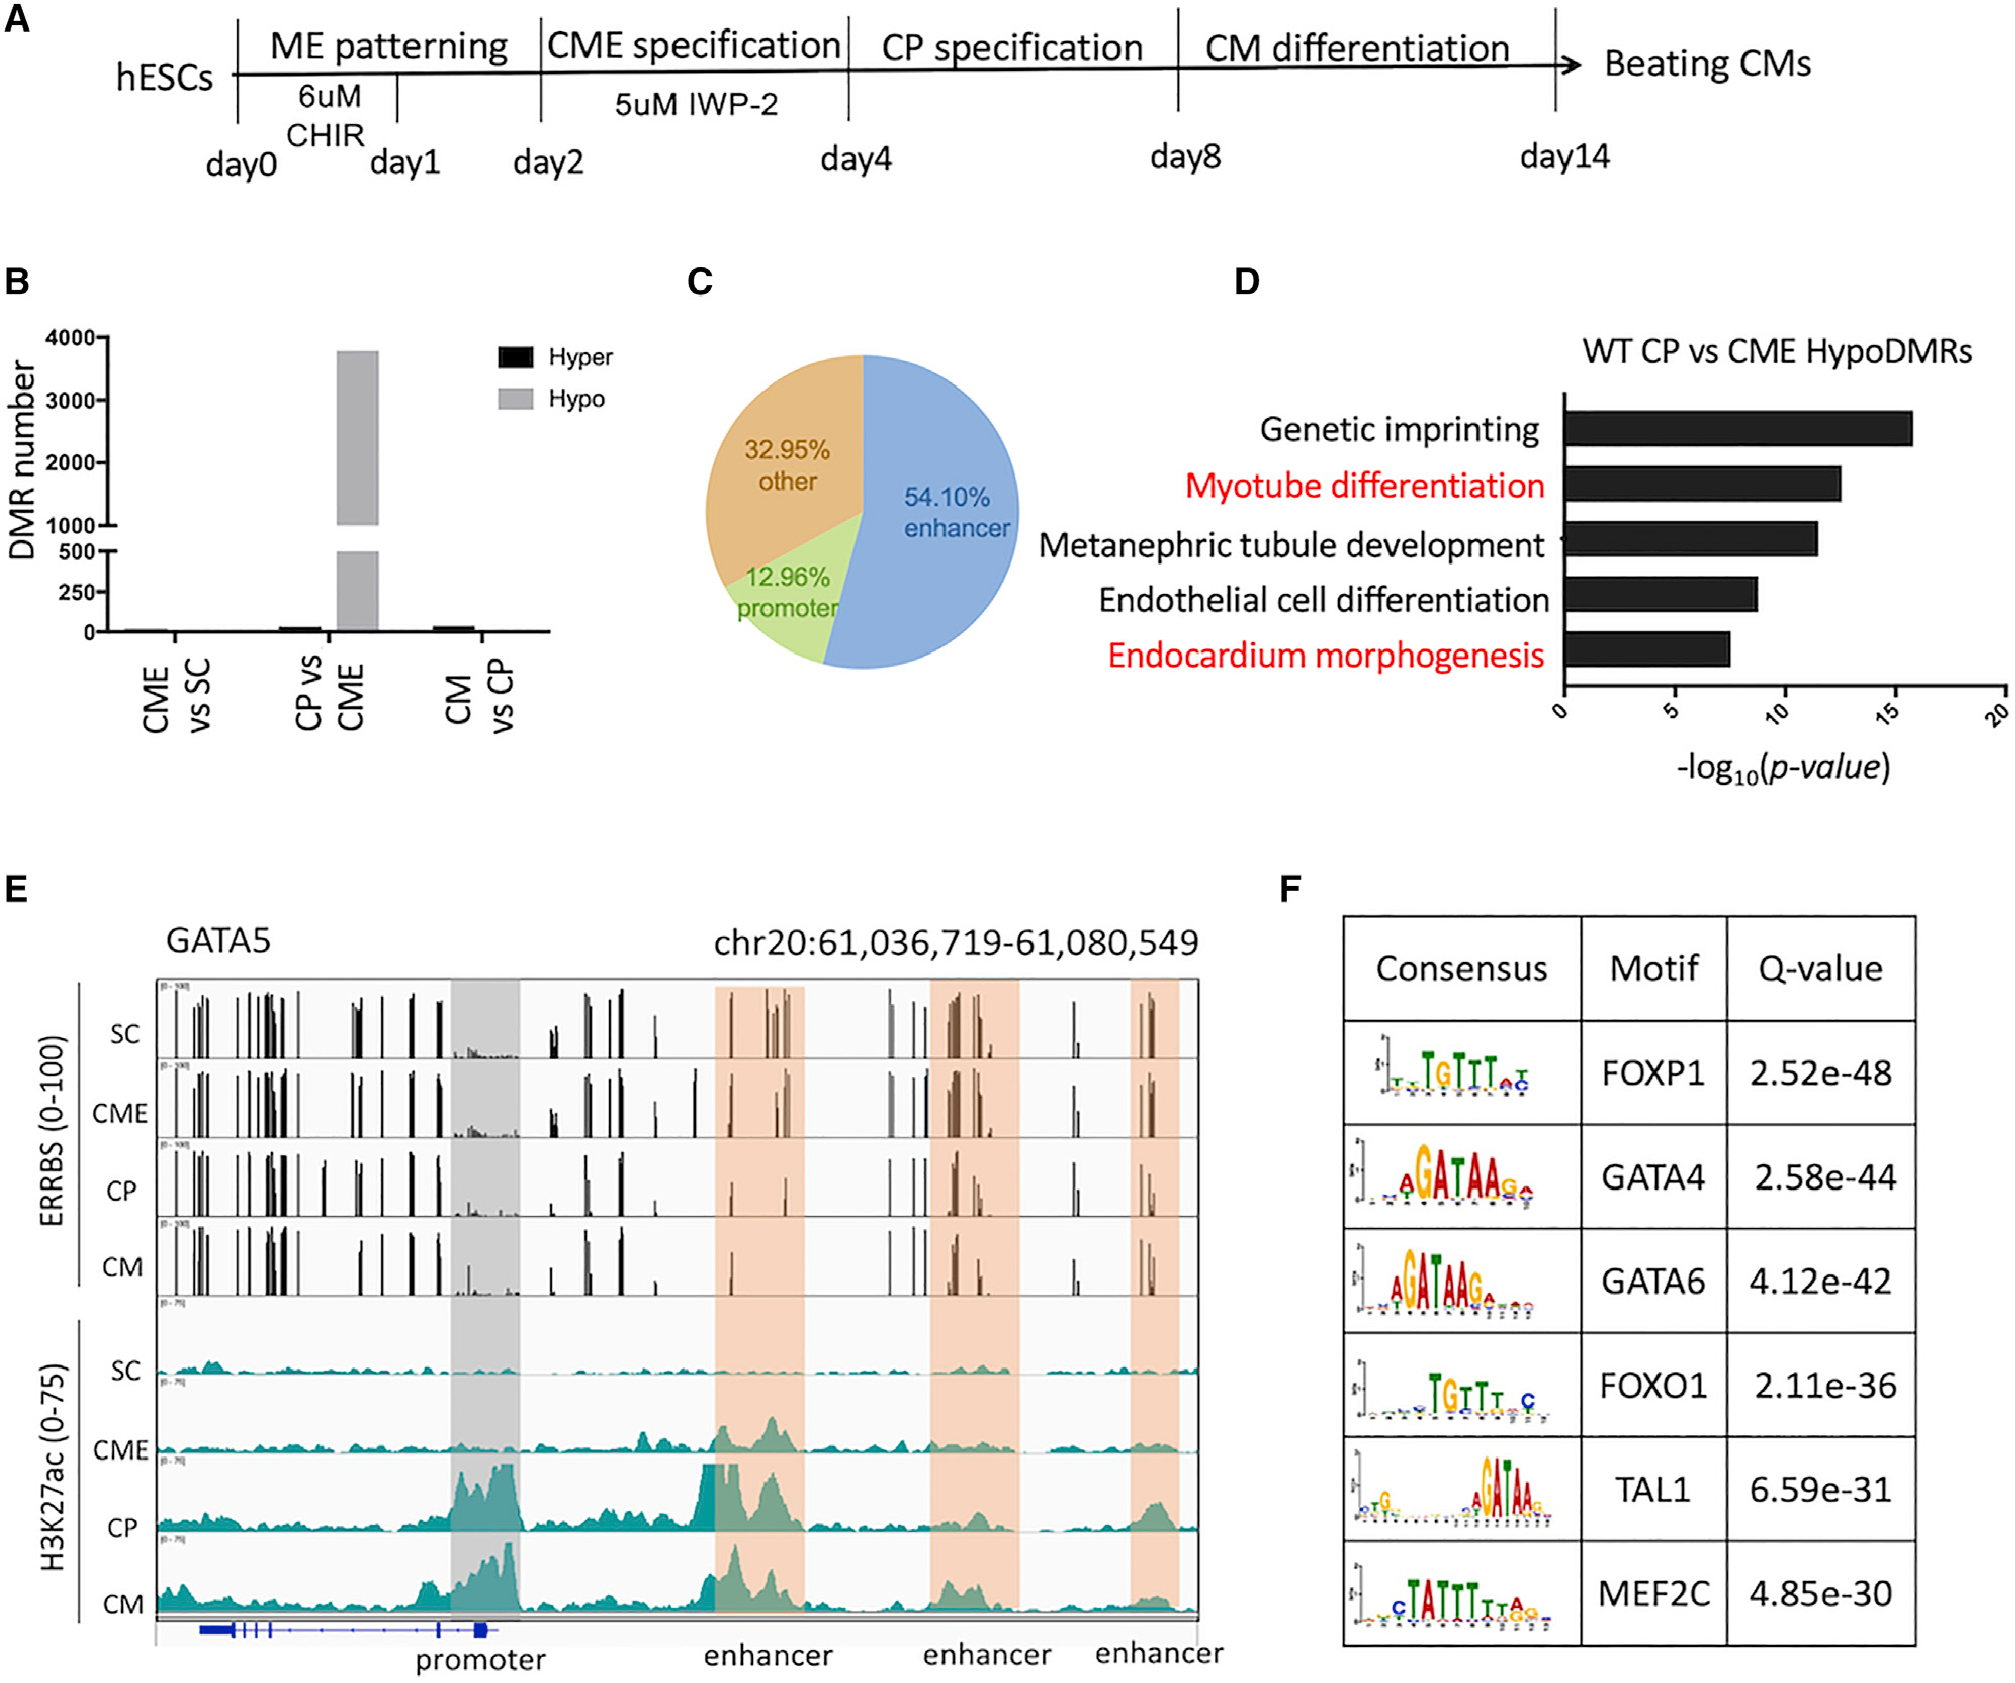
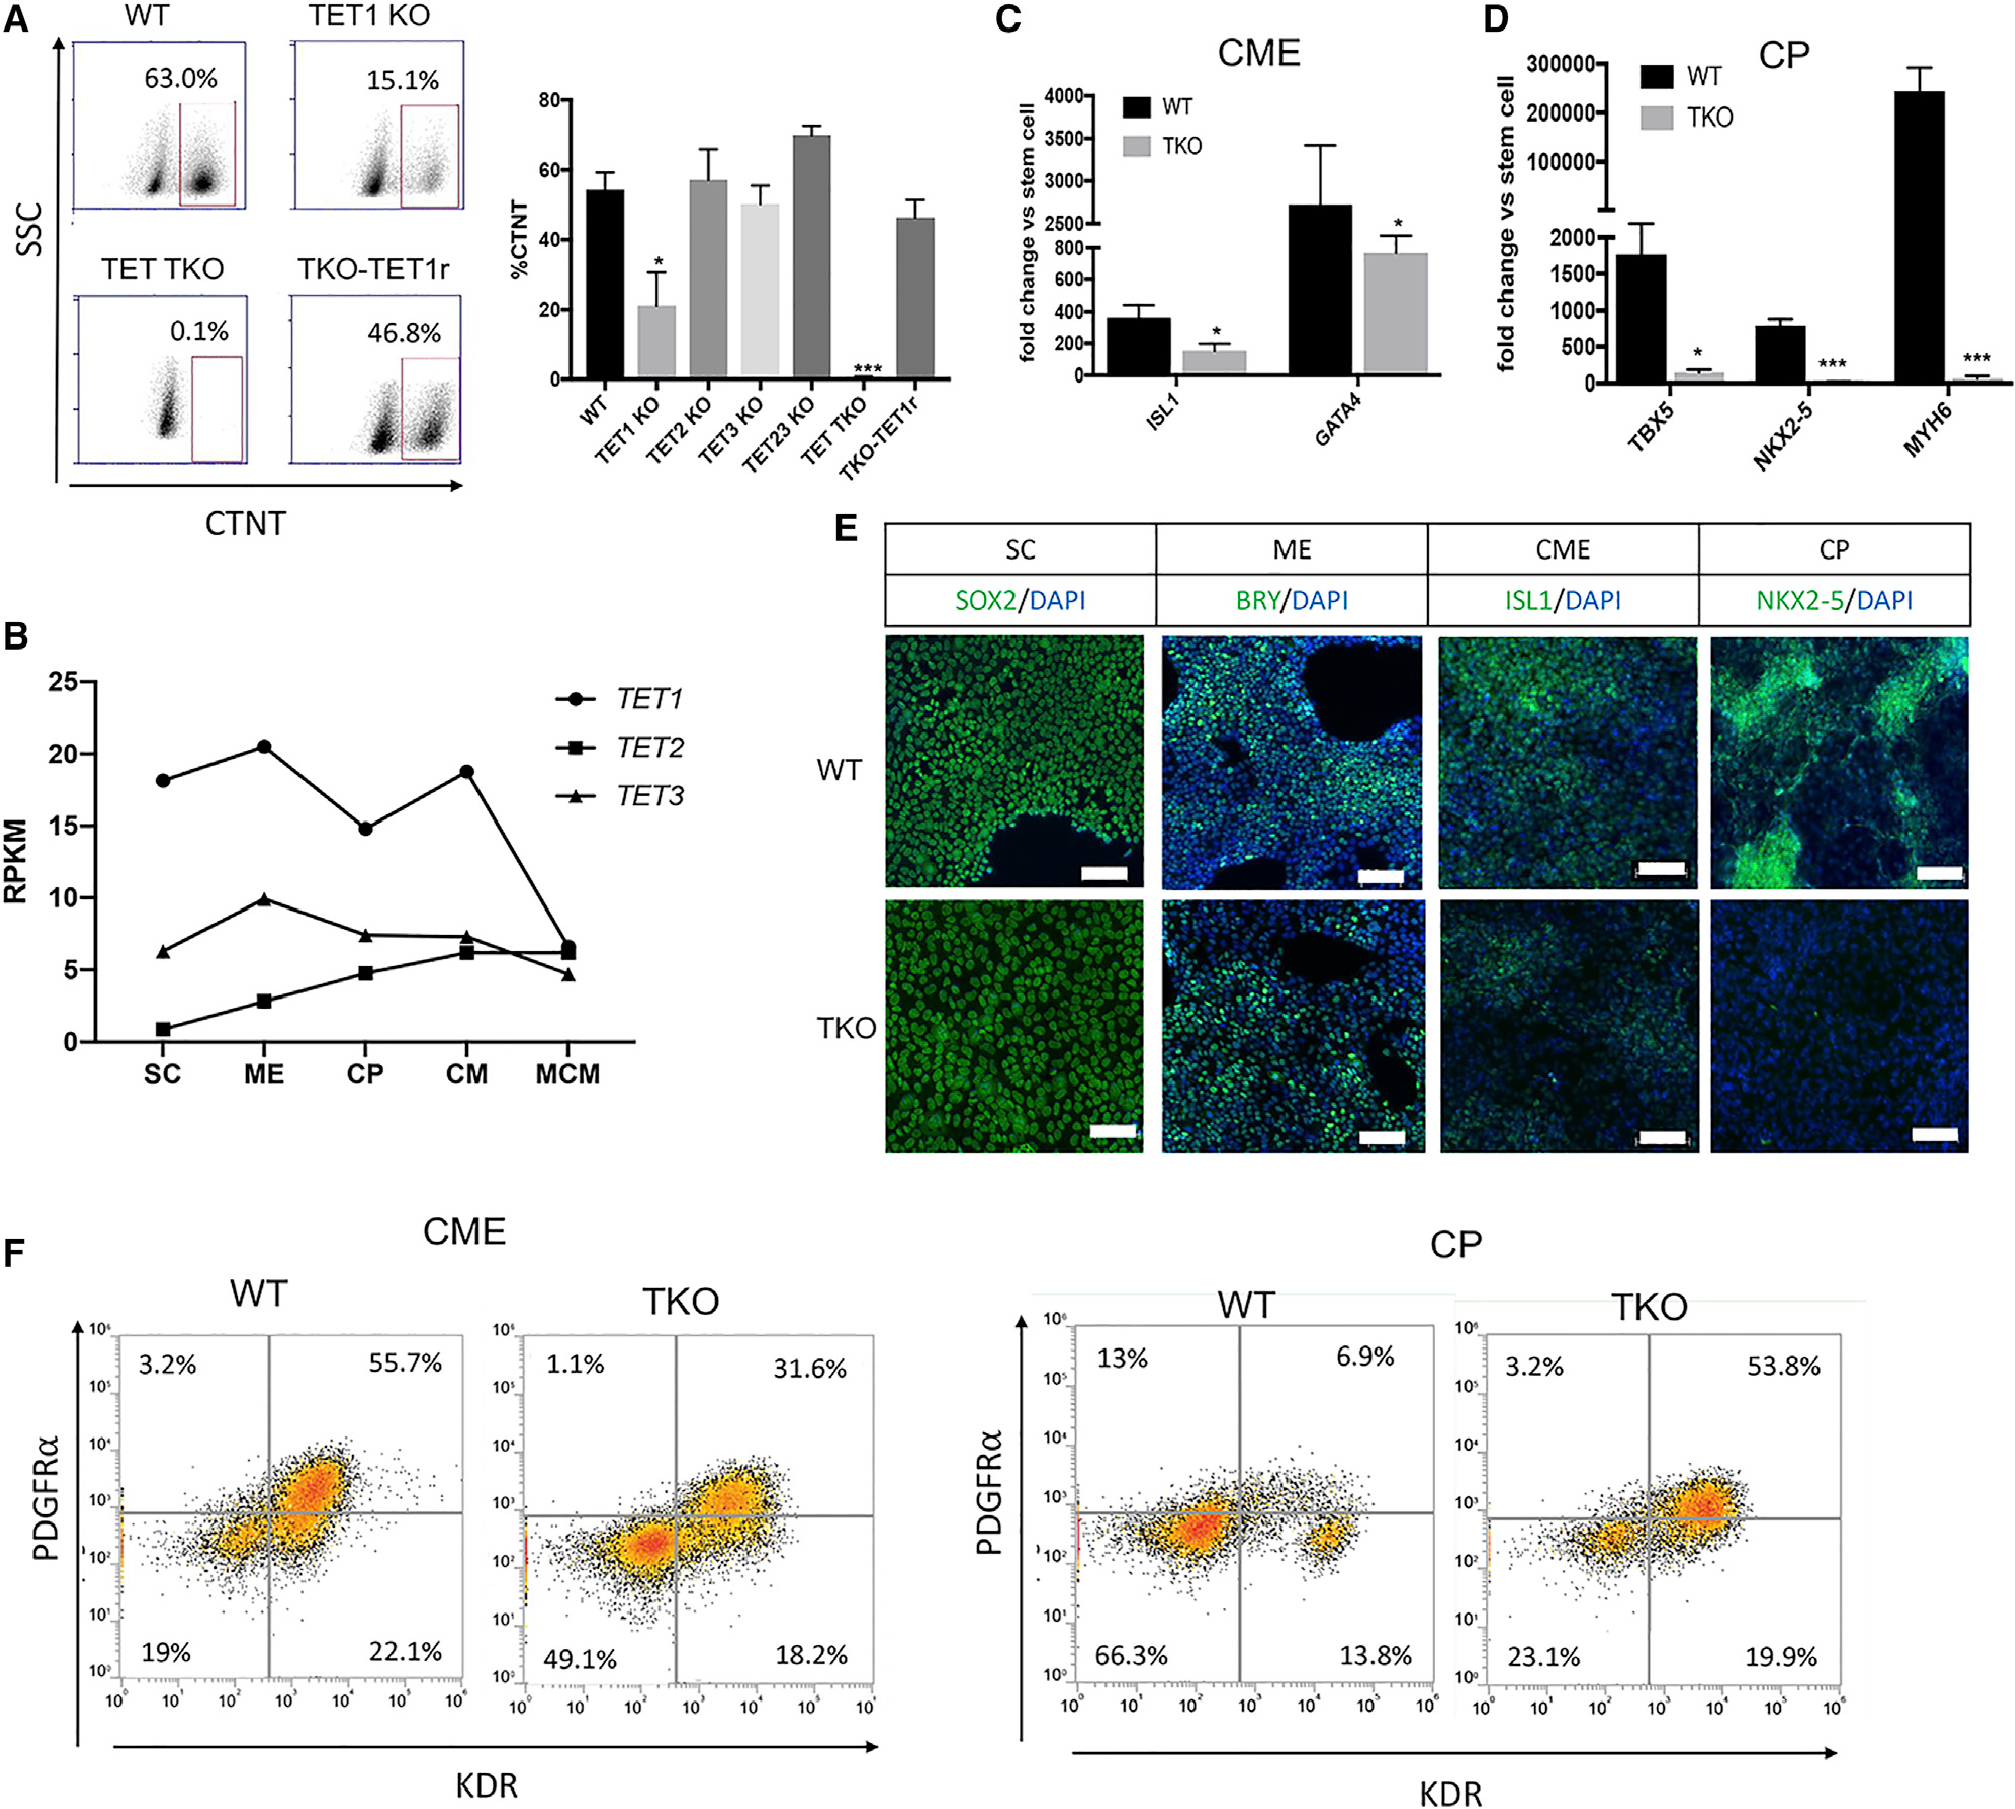
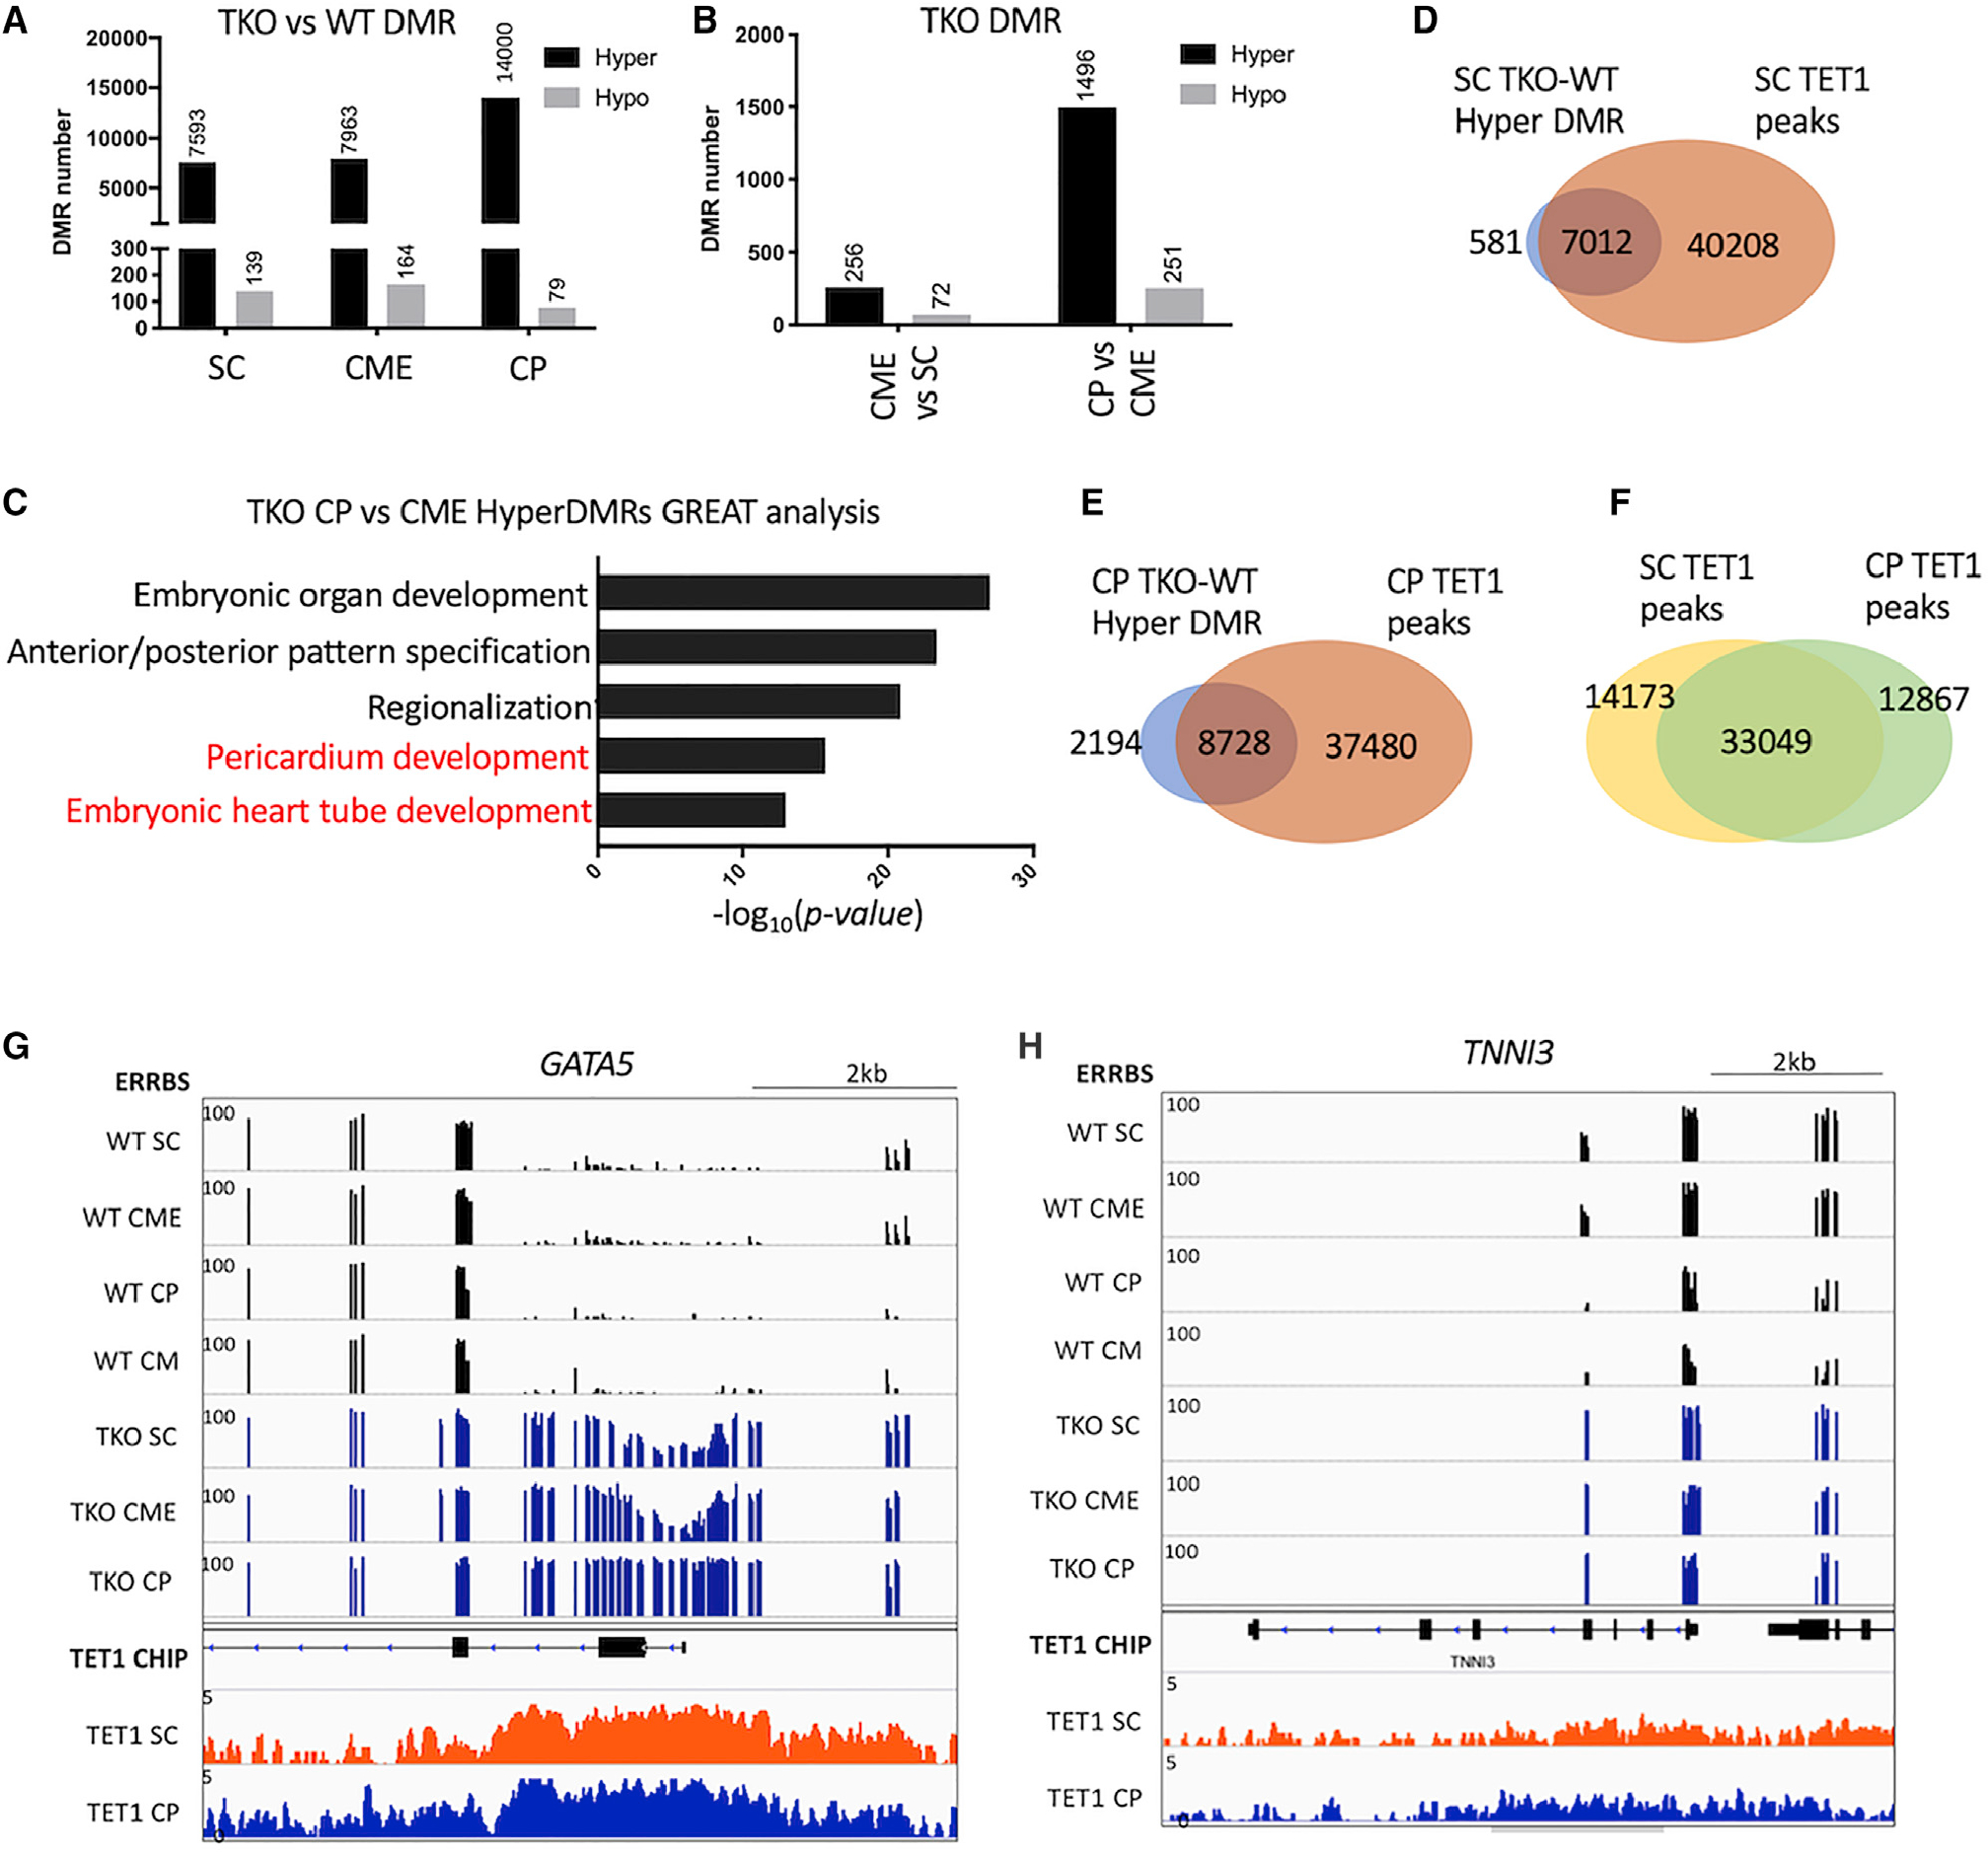
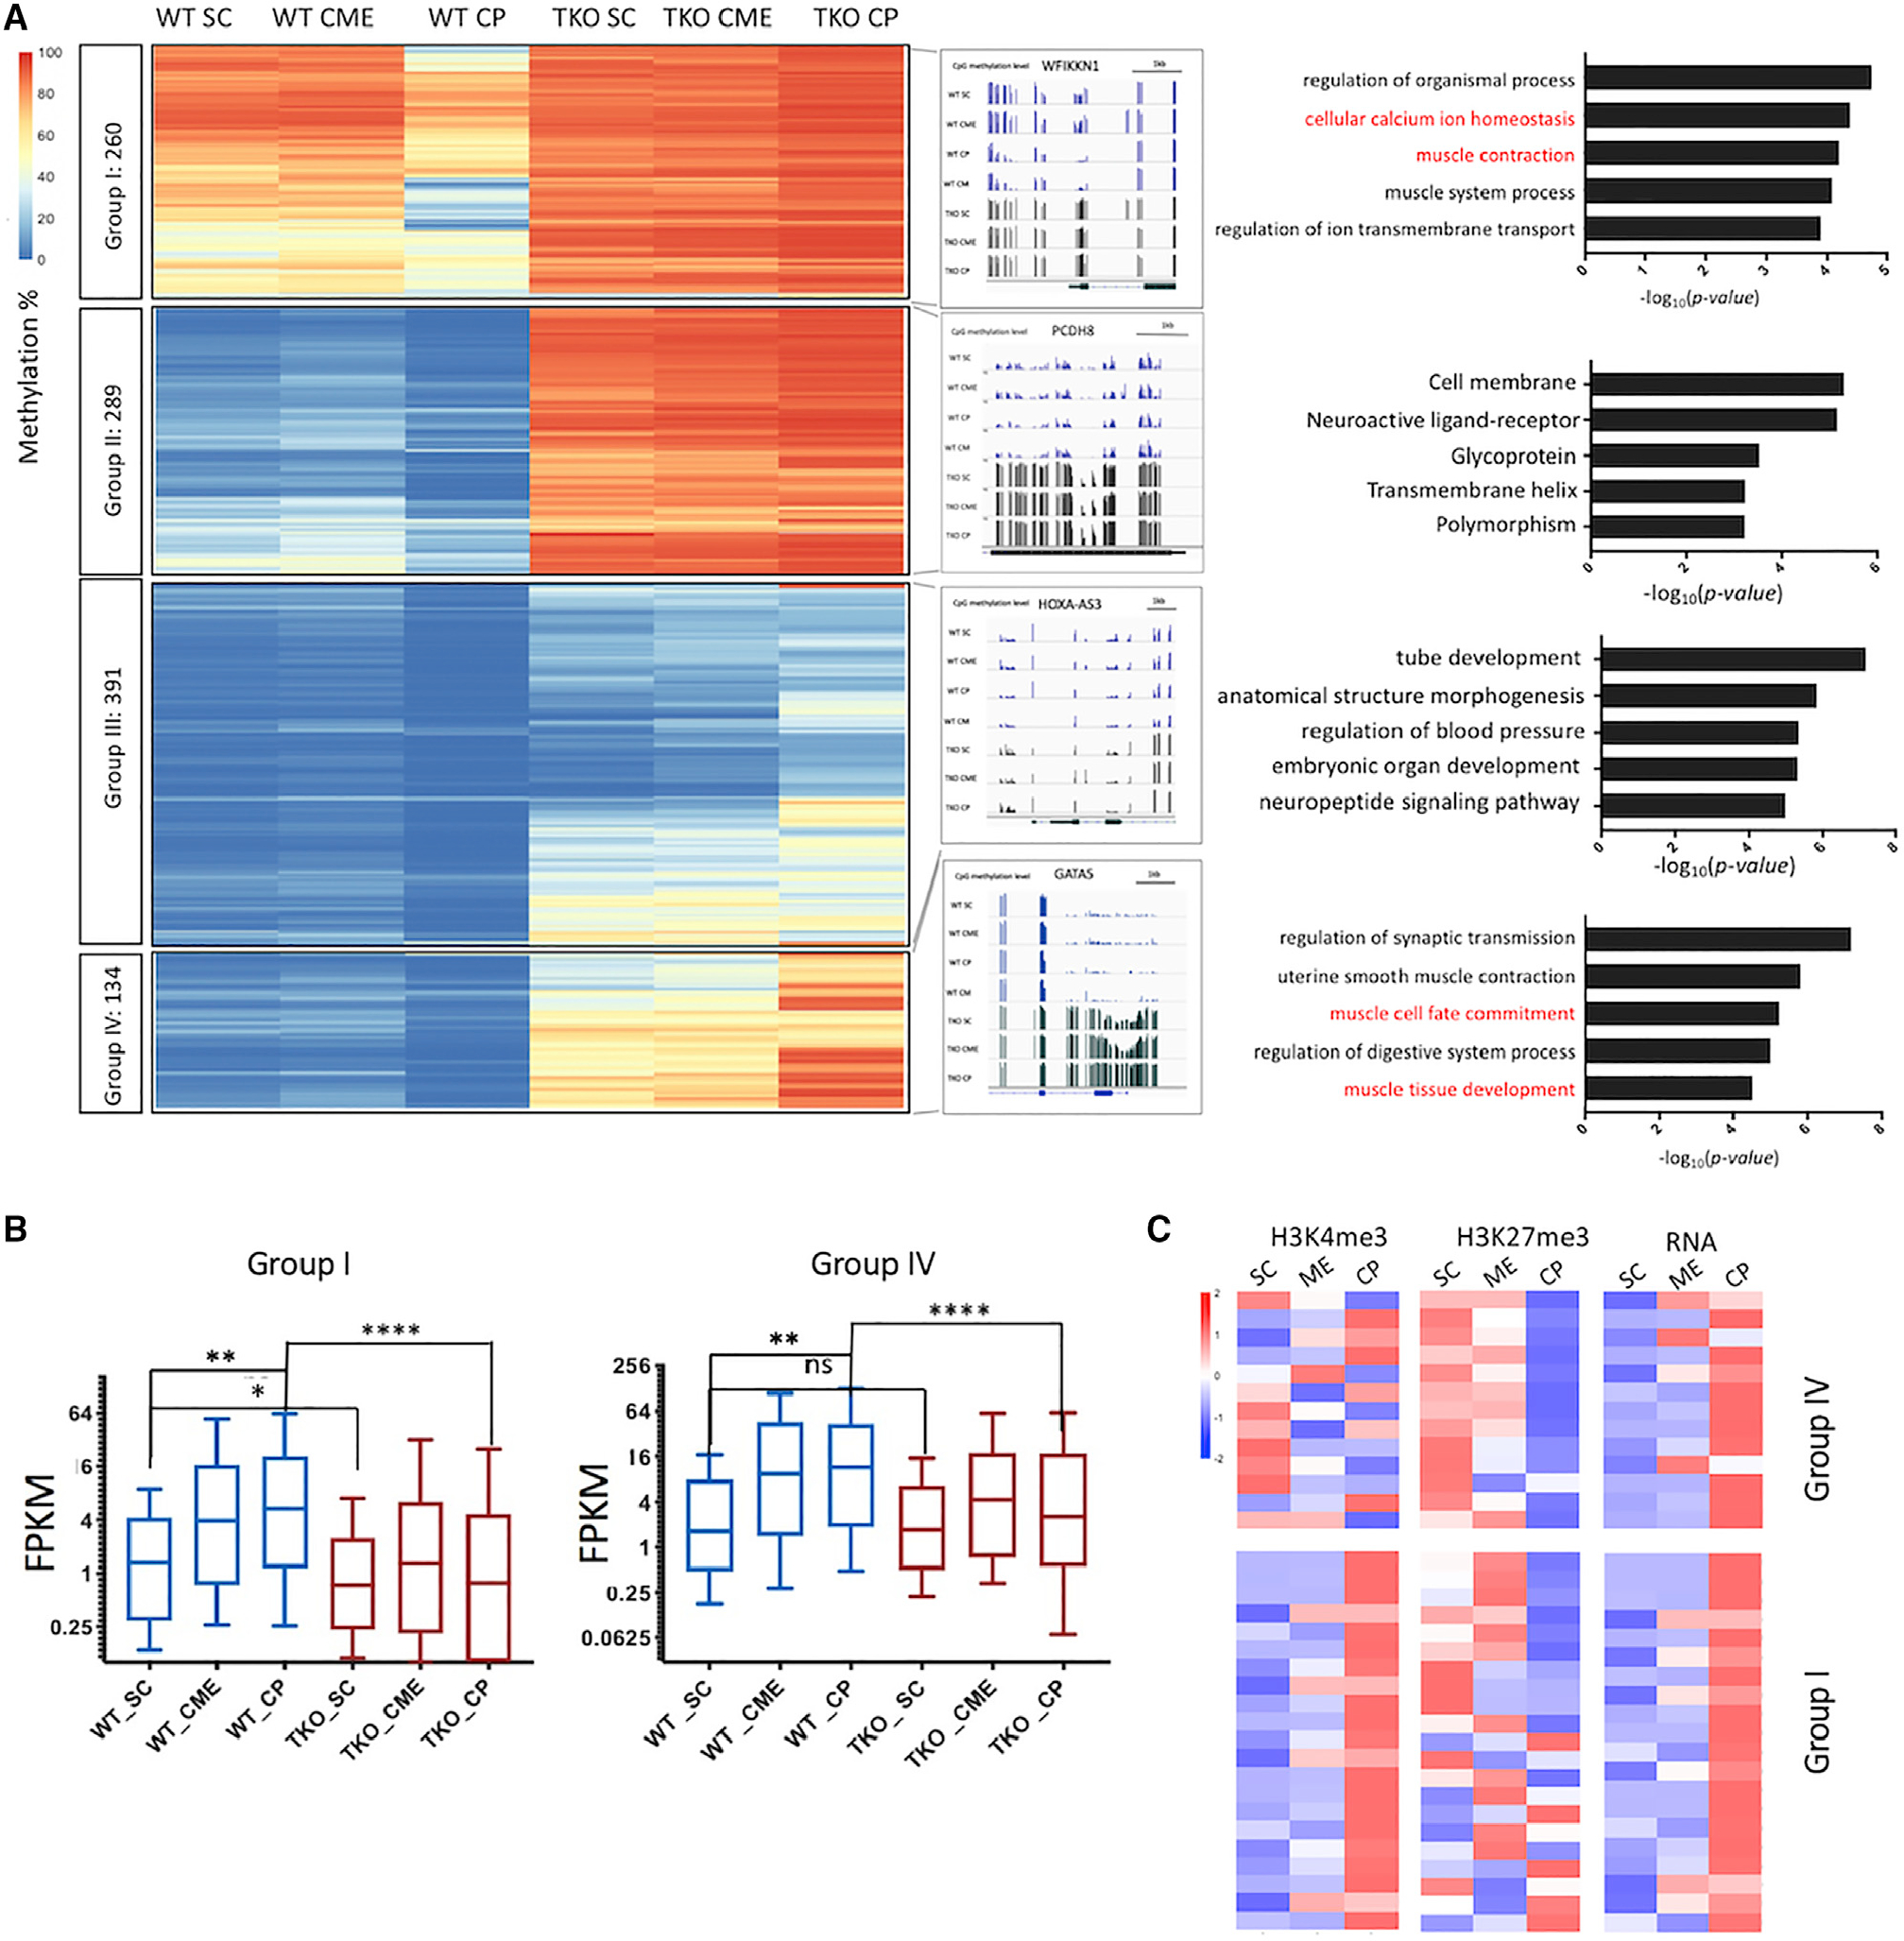
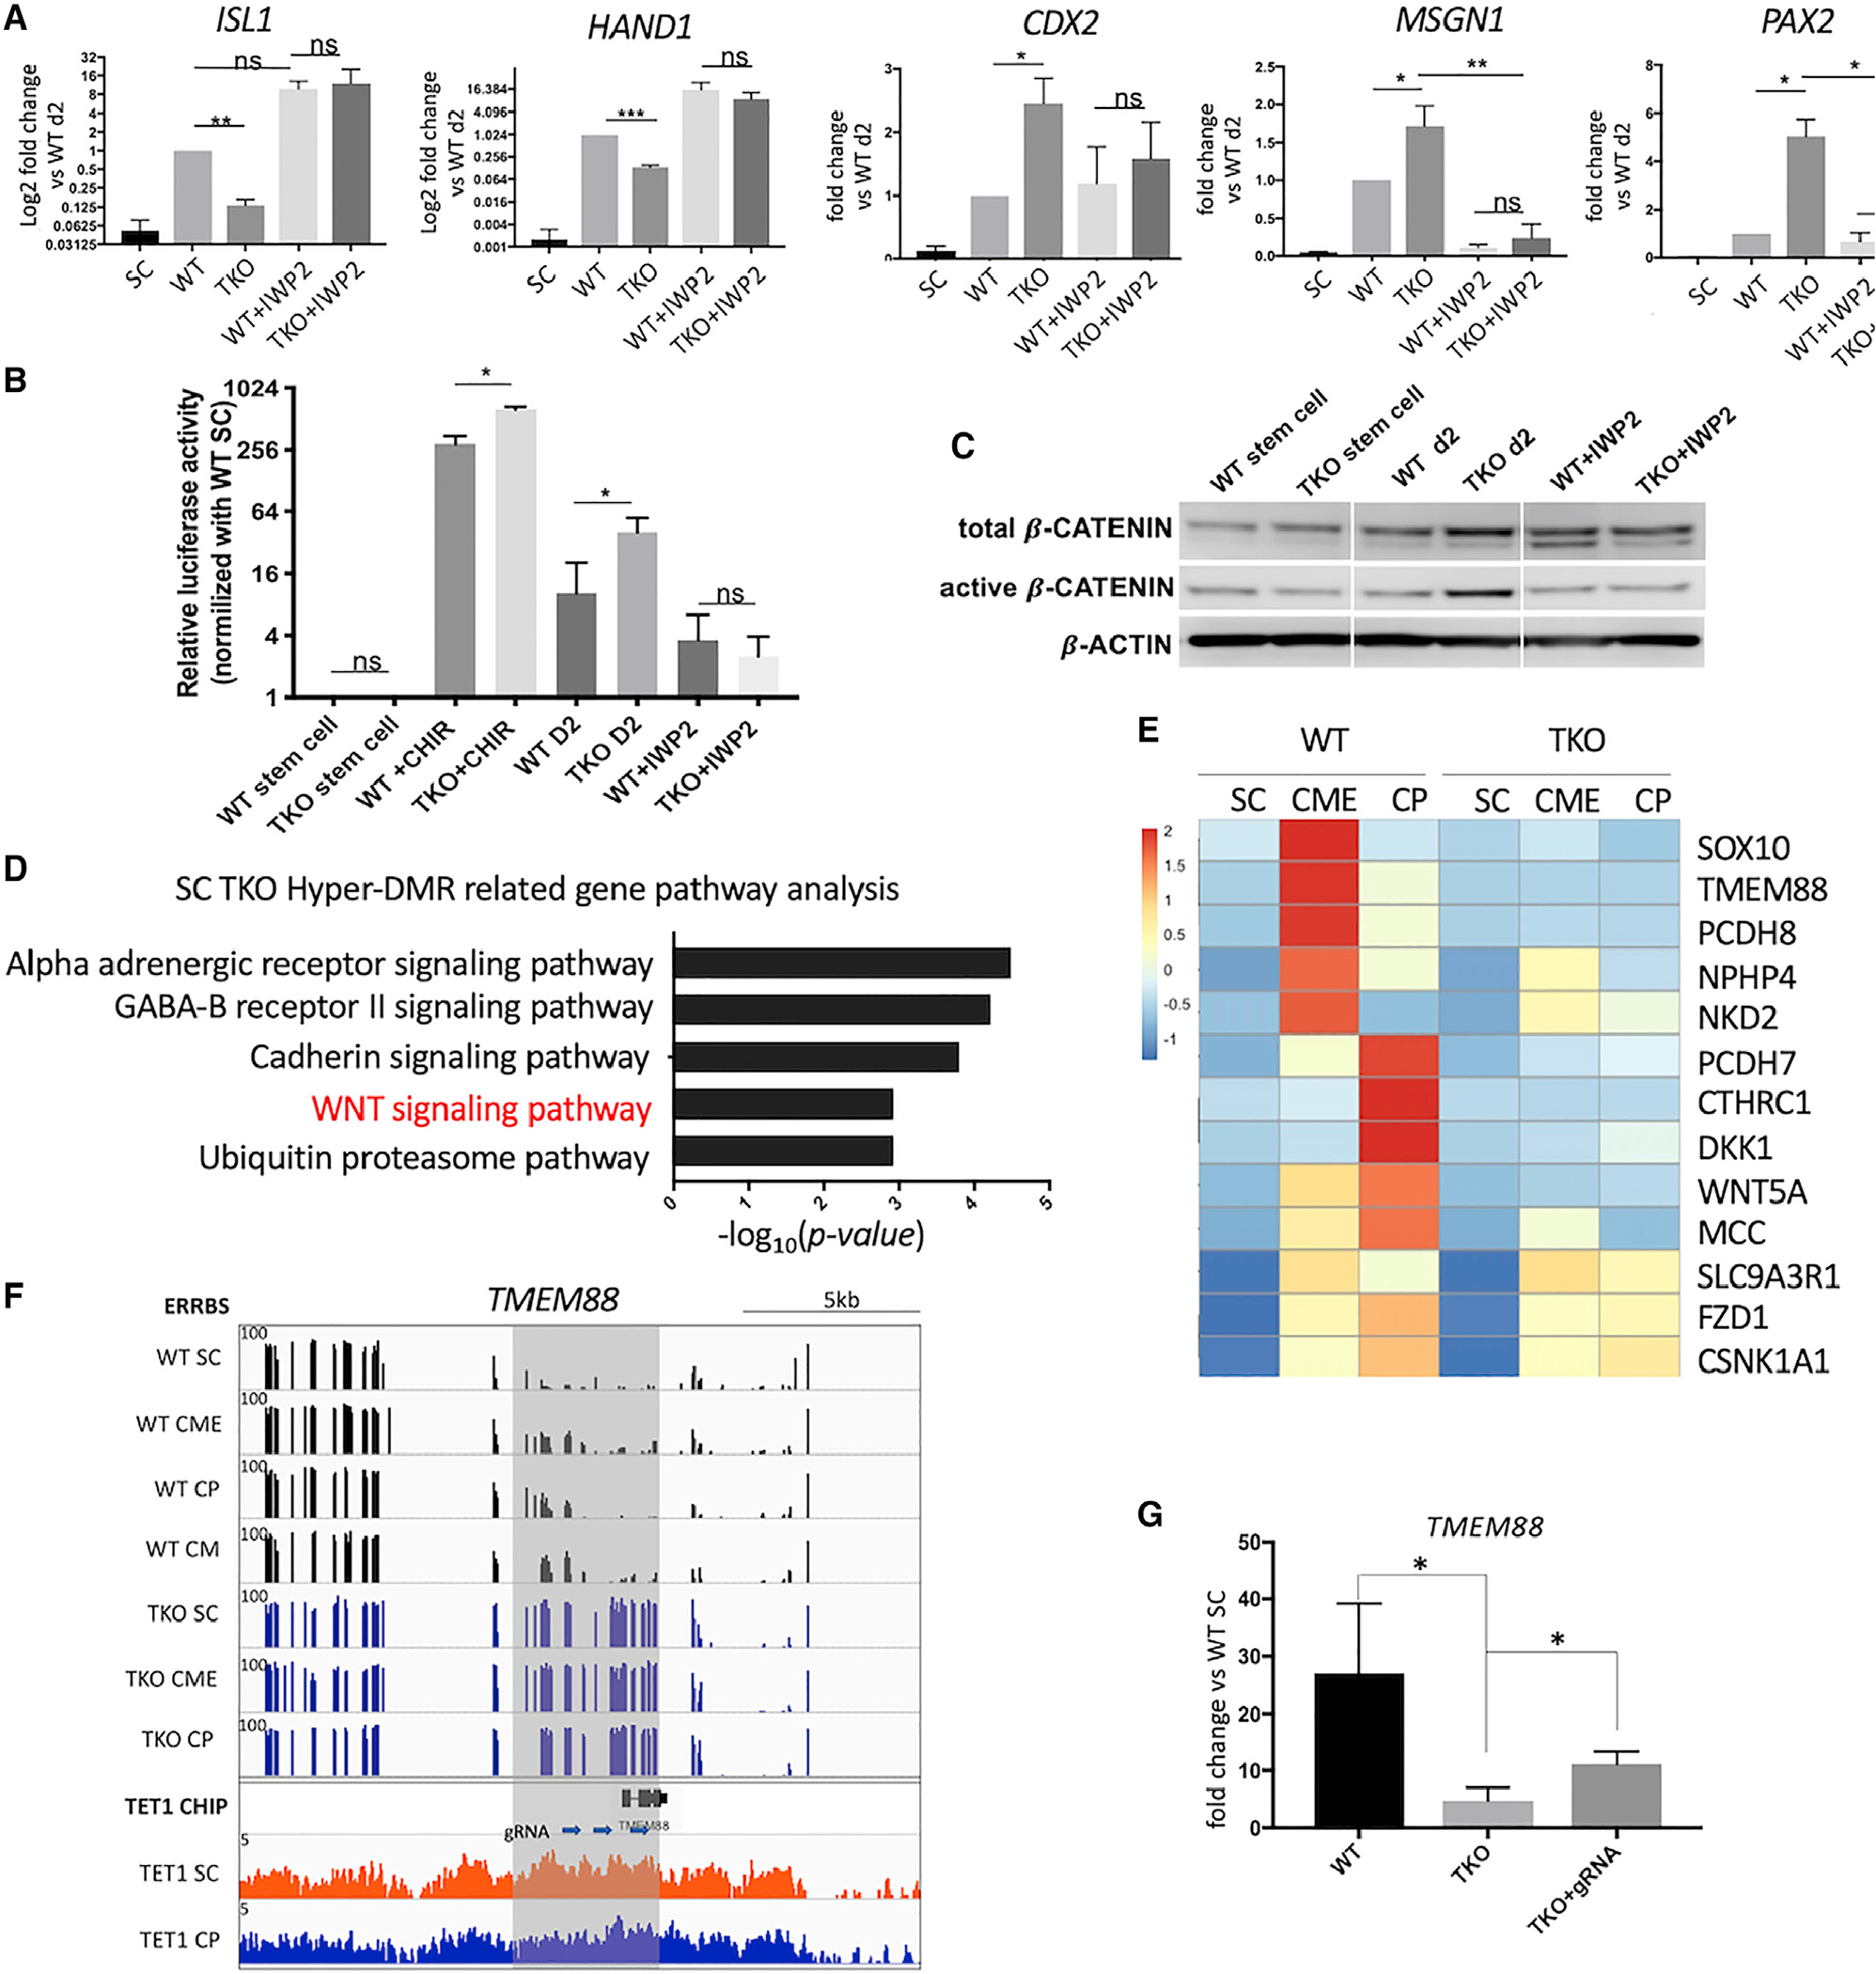
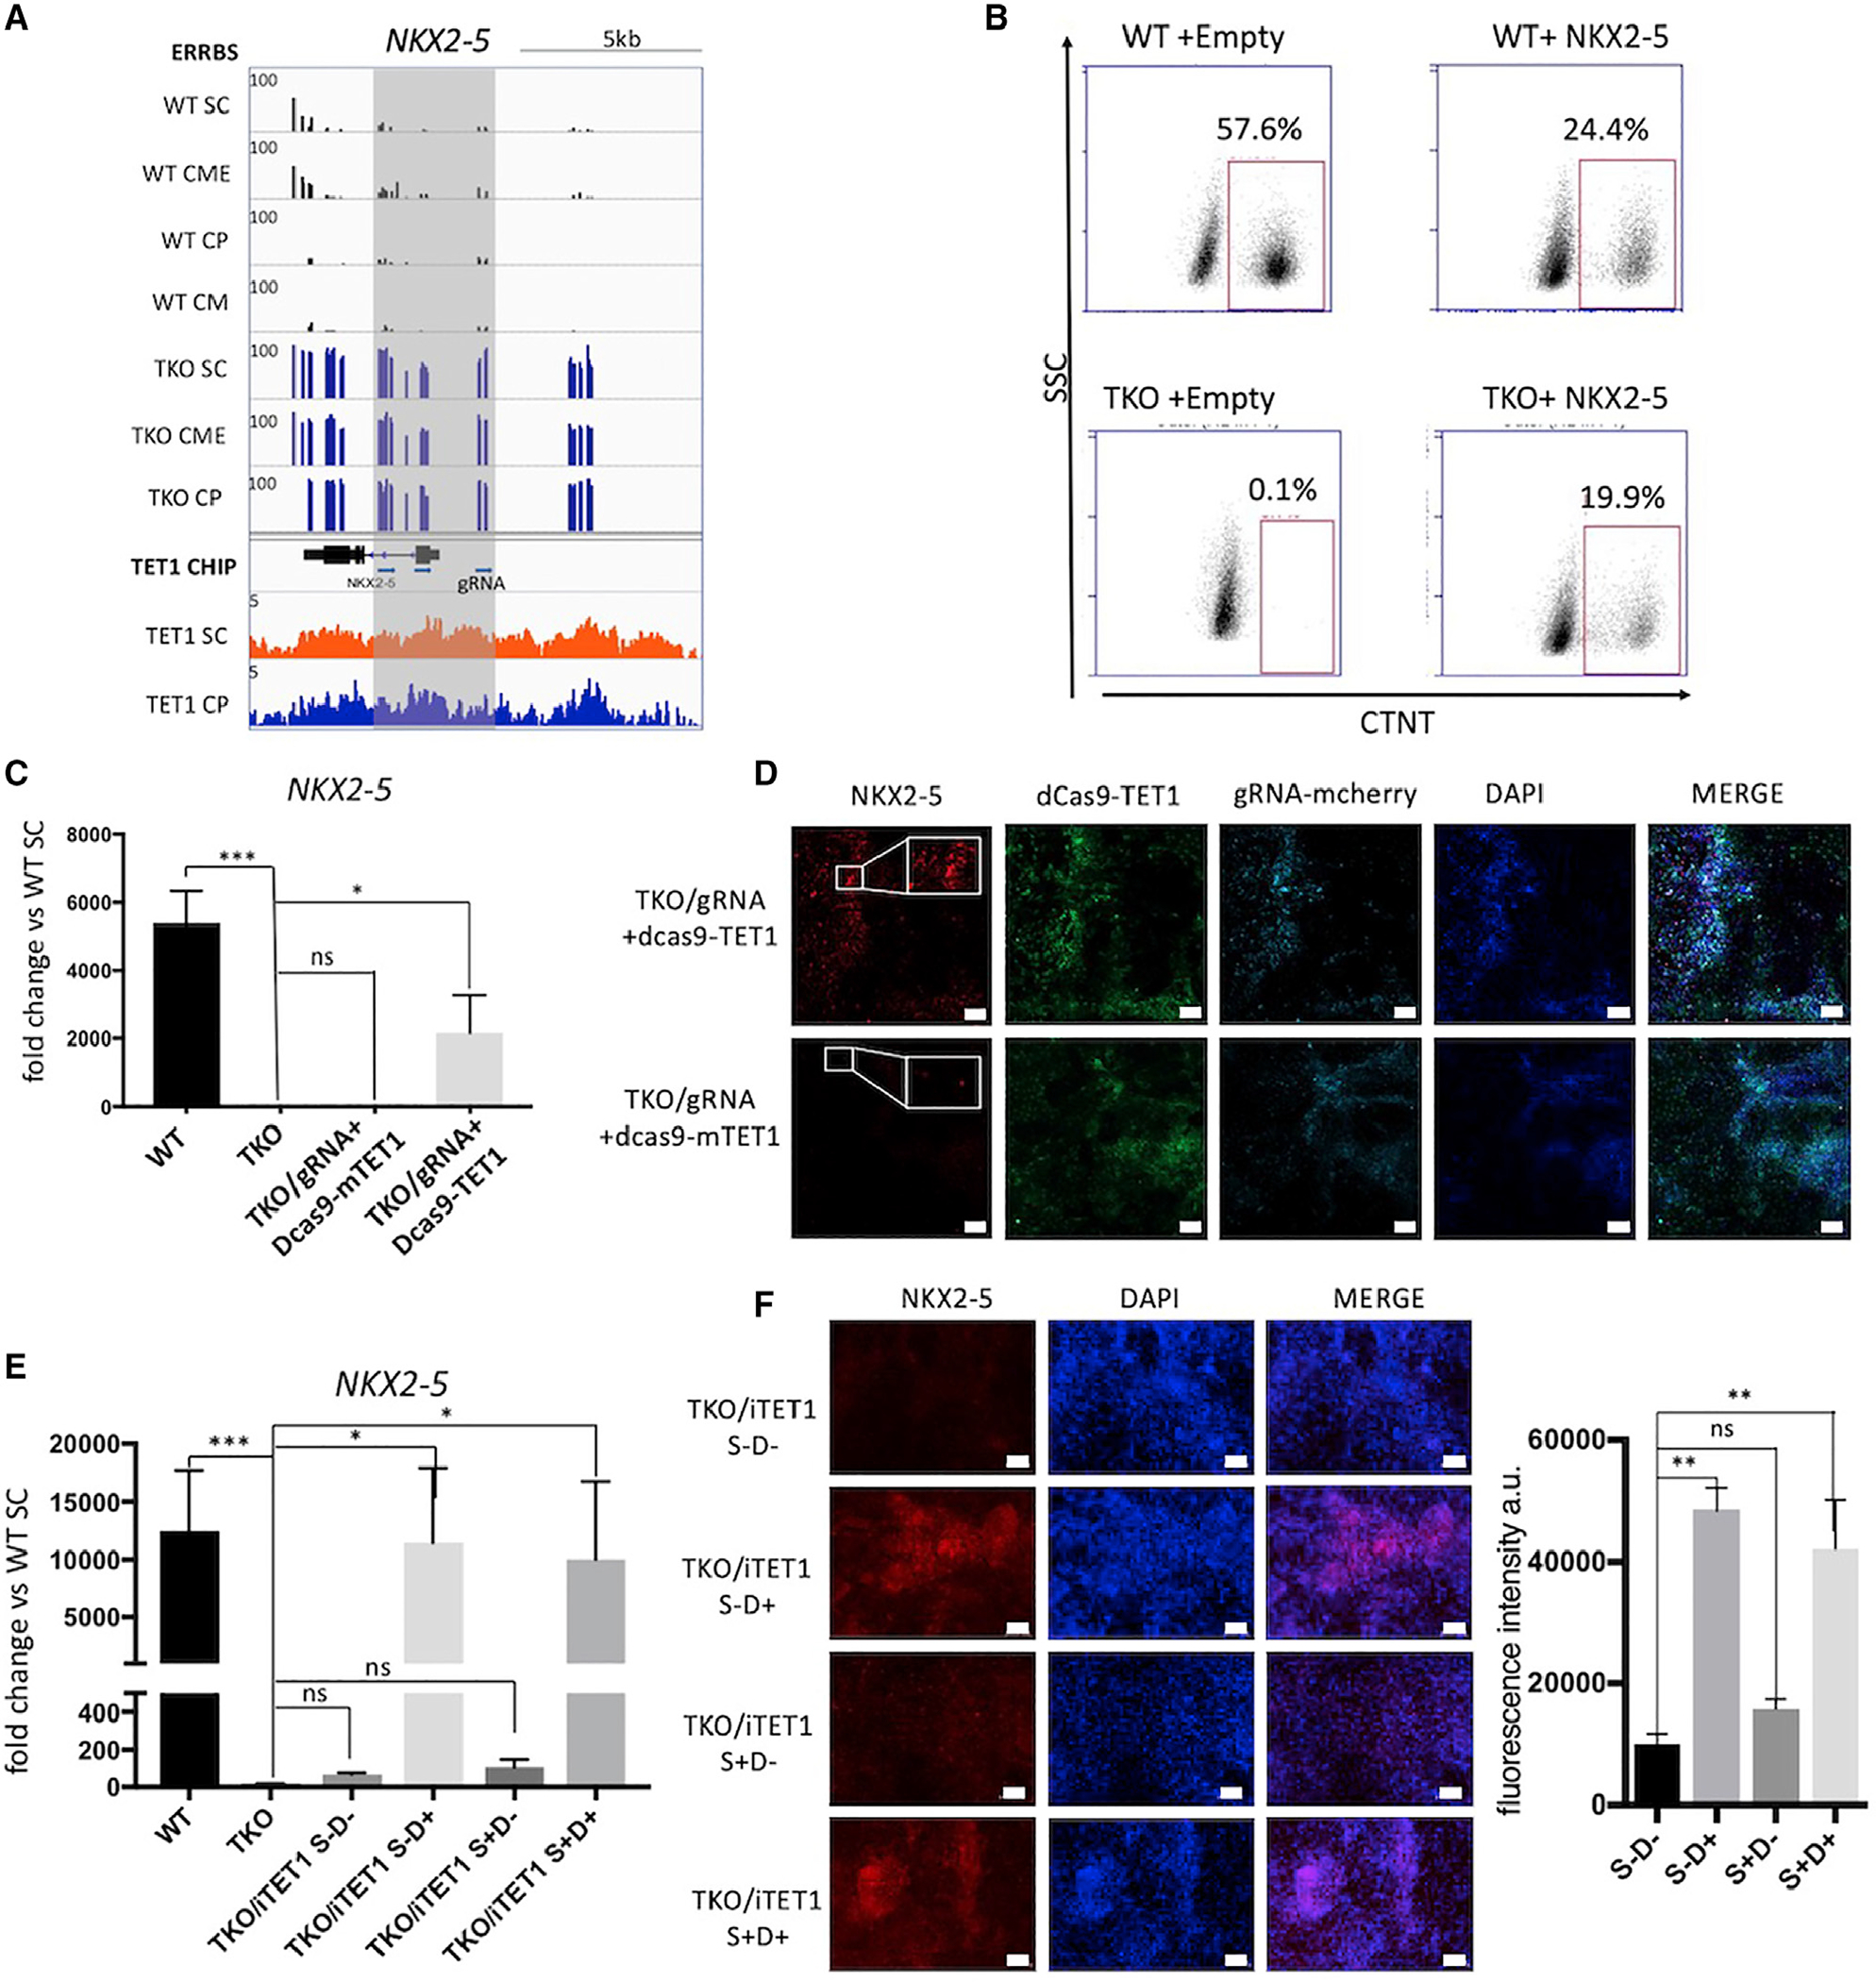
Changes in DNA methylation are associated with normal cardiogenesis, whereas altered methylation patterns can occur in congenital heart disease. Ten-eleven translocation (TET) enzymes oxidize 5-methylcytosine (5mC) and promote locus-specific DNA demethylation. Here, we characterize stage-specific methylation dynamics and the function of TETs during human cardiomyocyte differentiation. Human embryonic stem cells (hESCs) in which all three TET genes are inactivated fail to generate cardiomyocytes (CMs), with altered mesoderm patterning and defective cardiac progenitor specification. Genome-wide methylation analysis shows TET knockout causes promoter hypermethylation of genes encoding WNT inhibitors, leading to hyperactivated WNT signaling and defects in cardiac mesoderm patterning. TET activity is also needed to maintain hypomethylated status and expression of NKX2-5 for subsequent cardiac progenitor specification. Finally, loss of TETs causes a set of cardiac structural genes to fail to be demethylated at the cardiac progenitor stage. Our data demonstrate key roles for TET proteins in controlling methylation dynamics at sequential steps during human cardiac development.

Keywords: NKX2-5; TMEM88; WNT; cardiogenesis; epigenomics; hESCs.


Conflict of interest statement

Declaration of interests The authors declare no competing interests.

Figures

Figure 1.
Figure 1.. DNA methylation dynamics during cardiomyocyte differentiation
(A) Scheme of cardiomyocyte differentiation protocol indicating the timing and use of different small molecules. CHIR, GSK3 inhibitor to activate WNT pathway; IWP2, WNT pathway inhibitor; ME, mesoderm; CME, cardiac mesoderm; CP, cardiac progenitor; CM, cardiomyocyte. (B) Numbers of DMRs that show increased (hyper-DMR) or reduced (hypo-DMR) DNA methylation through each CM differentiation stage transition. (C) Enrichment of various regulatory regions associated with WT CP-CME hypo-DMRs. Total DMR number = 3,786. (D) GREAT analysis of WT CP-CME hypo-DMRs shows they are enriched for cardiac development genes. (E) Representative genome browser view illustrating the DNA methylation and H3K27ac dynamics at genomic regions surrounding GATA5 during CM differentiation. Gray box indicates promoter region with DNA demethylation. Orange boxes indicate enhancer regions with DNA demethylation. Promoter and enhancer annotation is based on genomic position and active histone mark H3K27ac. H3K27ac dataset is from GEO: GSE116862. (F) Consensus motif analysis in WT CP-CME hypo-DMRs indicates the enrichment of motifs for transcription factors important for cardiac specification. See also Figure S1.
Figure 2.
Figure 2.. TET TKO hESCs exhibit cardiomyocyte differentiation defects
(A) Flow cytometry for quantitative analysis of CTNT+ cells at day 14 (no lactate treatment). Shown are representative plots, whereas the bar graphs represent at least three independent differentiation experiments. TET TKO, TET1/2/3 triple knockout; TKO-TET1r, repair of one TET1 mutant allele to the WT sequence in TKO hESCs by CRISPR-Cas9-directed homology-mediated repair. (B) Expression levels of TET1, TET2, and TET3 based on RNA-seq during CM differentiation. SC, stem cell; MCM, mature cardiomyocyte (day 30). Dataset from GEO: GSE116862. (C) qPCR analysis of cardiac mesoderm markers ISL1 and GATA4 in WT and TET TKO derived cells at day 3. (D) qPCR analysis of cardiac progenitor markers TBX5, NKX2–5, and MYH6 in WT and TET-TKO-derived cells at day 6. (E) Time course immunofluorescence analysis of stage-specific markers during WT and TET TKO cardiac differentiation. White scale bars are 100 μM. (F) Representative flow cytometry of PDGFRα+ and KDR+ cells with day 3 (CME stage) or day 6 (CP stage) WT and TKO cells. Significance is indicated as *p < 0.05, ***p < 0.001, ns indicates not significant. Data are presented as means ± SEM derived from at least three independent biological replicates. See also Figure S2.
Figure 3.
Figure 3.. Dynamic regulation of methylation through TET enzymes during CM differentiation
(A) Numbers of differentially methylated regions (DMRs) that show increased (hyper-DMR) or reduced (hypo-DMR) DNA methylation for TKO cells as compared with WT cells at each differentiation stage. (B) Numbers of DMRs that show increased (hyper-DMR) or reduced (hypo-DMR) DNA methylation when WT and TKO cells progress through to the CP specification stage. (C) GREAT analysis of TKO CP-CME hyper-DMRs shows they are enriched for cardiac development genes. (D and E) Venn diagrams indicate most TKO-WT hyper-DMRs identified at SC or CP stages overlap with TET1 binding peaks found in WT cells. (F) Venn diagram indicates the number of overlapping or distinct TET1 binding peaks identified at the SC and CP stages in WT cells. (G and H) Representative genome browser views illustrating the DNA methylation dynamics and TET1 binding at genomic regions surrounding GATA5 and TNNI3 during CM differentiation. See also Figure S3.
Figure 4.
Figure 4.. Distinct promoter methylation signatures for different categories of genes
(A) Left panel: heatmaps showing the average levels of DNA methylation for promoters (1 kb upstream and downstream of the transcription start site) that have methylation differences between WT and TKO cells or show dynamic methylation changes during differentiation. Middle panel: examples of each group showing methylation level by eRRBS. Right panel: GO analysis showing biological process enriched in each group. (B) Boxplots showing the transcript expression levels of genes in group I and group IV during CP specification based on RNA-seq profiles. (C) Heatmaps showing the average levels of H3K4me3, H3K27me3, and RNA for promoters of cardiac regulatory genes in group IV and cardiac contraction genes in group I. See also Figure S4 and Table S1.
Figure 5.
Figure 5.. TETs influence mesoderm patterning by regulating the expression and DNA modification status of genes encoding WNT inhibitors
(A) qPCR analysis of LM markers ISL1 and HAND1, PM markers CDX2 and MSGN1, and IM marker PAX2 at day 2 of differentiation, with or without IWP2 treatment from day 1 to day 2. (B) TopFlash luciferase reporter activity, normalized to Renilla luciferase levels in stem cells, for day 1 cells after CHIR treatment and day 2 cells with or without IWP2 treatment. (C) Representative western blots analyzing total or active β-catenin under the indicated conditions. (D) Pathway analysis for promoter hyper-DMR associated genes in TKO cells at the SC stage. E) Relative gene expression levels of WNT inhibitory genes that in TKO cells show promoter hyper-DMR during WT or TKO differentiation based on RNA-seq profiles. (F) Representative genome browser view illustrating the DNA methylation dynamics and TET1 binding at genomic regions surrounding the TMEM88 promoter during CM differentiation. Blue arrows: gRNAs used to recruit dCas9-TET1 to the TMEM88 promoter and induce locus specific demethylation. (G) qPCR analysis of relative TMEM88 expression levels at day 2 of CM differentiation for WT or TKO ESCs compared with those TKO cells expressing dCas9-TET1 fusion protein and TMEM88-targeting gRNAs. Significance is indicated as *p < 0.05, **p < 0.01, ns indicates not significant. Data are presented as means ± SEM derived from at least three independent biological replicates. See also Figures S5 and S6.
Figure 6.
Figure 6.. TETs directly regulate NKX2–5 through modifying methylation status of the NKX2–5 promoter
(A) Representative genome browser view illustrating the DNA methylation dynamics and TET1 binding at genomic regions surrounding the NKX2-5 promoter during CM differentiation. Blue arrows: gRNAs used to recruit dCas9-TET1 to the NKX2–5 promoter and induce locus specific demethylation. (B) Flow cytometry of CTNT+ cells at day 14 with doxycycline treatment from day 4 to day 6 in WT and TKO cells infected with a vector for doxycycline-induced NKX2–5 expression or empty vector. (C) qPCR analysis of NKX2–5 expression on day 8 of CM differentiation for TKO ESCs expressing NKX2–5-targeting gRNAs with dCas9-mutTET1 or dCas9-TET1 fusion protein. (D) Immunofluorescence of NKX2–5, EGFP (representing dCas9-TET1 or dCas9-mutTET1 expression), mCherry (representing gRNAs expression), and DAPI on day 8 of CM differentiation for TKO ESCs infected with gRNAs and dCas9-TET1 (NKX2–5 fluorescence intensity = 17,189 ± 2697 a.u.) or mutTET1 fusion protein (NKX2–5 fluorescence intensity = 1,585 ± 668 a.u.). Insert box shows magnified view. White scale bars are 100 μM. (E) qPCR analysis of NKX2–5 expression on day 8 of CM differentiation for TKO ESCs expressing doxycycline-induced TET1 protein in different time windows. S, stem cell stage; D, differentiation stage. (F) Right panel: immunofluorescence of NKX2–5 on day 8 of CM differentiation for TKO ESCs expressing doxycycline-induced TET1 protein in different time windows. Left panel: mean fluorescence intensity of NKX2–5 expression on day 8 of CM differentiation for TKO ESCs expressing doxycycline-induced TET1 protein in different time window. White scale bars are 100 μM. Significance is indicated as *p < 0.05, **p < 0.01, ***p < 0.001, ns indicates not significant. Data are presented as means ± SEM derived from at least three independent biological replicates. See also Figure S7.

Similar articles

Cited by

References

    1. Akalin A, Garrett-Bakelman FE, Kormaksson M, Busuttil J, Zhang L, Khrebtukova I, Milne TA, Huang Y, Biswas D, Hess JL, et al. (2012). Base-pair resolution DNA methylation sequencing reveals profoundly divergent epigenetic landscapes in acute myeloid leukemia. PLoS Genet. 8, e1002781. - PMC - PubMed
    1. Almeida RD, Loose M, Sottile V, Matsa E, Denning C, Young L, Johnson AD, Gering M, and Ruzov A (2012). 5-hydroxymethyl-cytosine enrichment of non-committed cells is not a universal feature of vertebrate development. Epigenetics 7, 383–389. - PubMed
    1. Anelli V, Villefranc JA, Chhangawala S, Martinez-McFaline R, Riva E, Nguyen A, Verma A, Bareja R, Chen Z, Scognamiglio T, et al. (2017). Oncogenic BRAF disrupts thyroid morphogenesis and function via twist expression. eLife 6, e20728. - PMC - PubMed
    1. Burridge PW, Sharma A, and Wu JC (2015). Genetic and epigenetic regulation of human cardiac reprogramming and differentiation in regenerative medicine. Annu. Rev. Genet. 49, 461–484. - PMC - PubMed
    1. Dai HQ, Wang BA, Yang L, Chen JJ, Zhu GC, Sun ML, Ge H, Wang R, Chapman DL, Tang F, et al. (2016). TET-mediated DNA demethylation controls gastrulation by regulating Lefty-Nodal signalling. Nature 538, 528–532. - PubMed

Publication types

MeSH terms