. 2021 Dec 7;37(10):110099.
doi: 10.1016/j.celrep.2021.110099.

Parity-induced changes to mammary epithelial cells control NKT cell expansion and mammary oncogenesis

Affiliations

Parity-induced changes to mammary epithelial cells control NKT cell expansion and mammary oncogenesis

Amritha Varshini Hanasoge Somasundara et al. Cell Rep. .

Abstract

Pregnancy reprograms mammary epithelial cells (MECs) to control their responses to pregnancy hormone re-exposure and carcinoma progression. However, the influence of pregnancy on the mammary microenvironment is less clear. Here, we used single-cell RNA sequencing to profile the composition of epithelial and non-epithelial cells in mammary tissue from nulliparous and parous female mice. Our analysis indicates an expansion of γδ natural killer T-like immune cells (NKTs) following pregnancy and upregulation of immune signaling molecules in post-pregnancy MECs. We show that expansion of NKTs following pregnancy is due to elevated expression of the antigen-presenting molecule CD1d on MECs. Loss of CD1d expression on post-pregnancy MECs, or overall lack of activated NKTs, results in mammary oncogenesis. Collectively, our findings illustrate how pregnancy-induced changes modulate the communication between MECs and the immune microenvironment and establish a causal link between pregnancy, the immune microenvironment, and mammary oncogenesis.

Keywords: Brca1 KO; CD1d; NKT cells; mammary development; pregnancy.


Conflict of interest statement

Declaration of interests The authors declare no competing interests.

Figures

Figure 1.
Figure 1.. Identification of transcriptional programs and immune cellular heterogeneity in mammary tissue from parous female mice
(A) UMAP of mammary epithelial cells from pre- and post-pregnancy mammary glands. (B) mRNA levels of senescence-associated, immune communication genes Cxcl1, Ccl2, Il6, Cxcl5, Mhc-ii, and Cd1d in pre- and post-pregnancy MECs. (C) UMAP of T cells (CD3e+ cells) from pre- and post-pregnancy mammary glands. (D) Feature plots showing the expression of T cell markers Cd4, Cd8, Klrk1, and Gzma. (E) Dendrogram clustering and dot plot showing the molecular signature and lineage identity of pre- and post-pregnancy mammary resident CD3+ immune cells. See also Figures S1-S4.
Figure 2.
Figure 2.. Pregnancy induces the expansion of a specific population of NKTs
(A) Flow cytometry analysis of resident CD45+ NK1.1+CD3+ NKTs from pre- and post-pregnancy mammary tissue. n = 5 nulliparous and 5 parous female mice. *p = 0.0004. (B) Flow cytometry analysis of the classic NKT cell markers T-bet, CD335, and IFN-γ in NKTs (CD45+NK1.1+CD3+) from pre- and post-pregnancy mammary tissue. For Tbet analysis, n = 4 nulliparous and 4 parous female mice. *p = 0.016. For CD335 analysis, n = 7 nulliparous and 7 parous female mice. *p = 0.03. (C) Flow cytometry analysis of β and γδ TCRs of pre- and post-pregnancy mammary NKTs. n = 5 nulliparous and 5 parous female mice. *p = 0.005. (D) Gene set enrichment analysis of differentially expressed genes in FACS-isolated NKTs from pre- and post-pregnancy mammary tissue. (E) Venn diagram demonstrating the number of shared and exclusive ATAC-seq peaks of FACS-isolated NKTs from pre- (blue circle) and post-pregnancy (orange circle) mammary tissue. (F) Genome browser tracks showing distribution of MACS-called, ATAC-seq peaks at the Pdk4, Maged1, and Lypla1 genomic loci from pre- and post-pregnancy NKTs. For all analyses, error bars indicate standard error of mean across samples of the same experimental group. Statistically significant differences were considered with Student’s t test p < 0.05. See also Figures S5 and S6 and Table S3.
Figure 3.
Figure 3.. NKT expansion depends on CD1d expression on post-pregnancy MECs
(A and B) Flow cytometry analysis and quantification of CD1d+ MECs harvested from pre-pregnancy (black bars, n = 8) and post-pregnancy (pink bars, n = 10) mammary tissue. *p = 0.0036 for luminal MECs and **p = 0.0006 for myoepithelial MECs. (C) Genome browser tracks showing MACS-called, H3K27ac ChIP-seq peaks at the Cd1d genomic locus in FACS-isolated, pre- and post-pregnancy luminal MECs. (D) H&E-stained histological images and duct quantification from mammary glands harvested from nulliparous (top left, n = 6) and parous (bottom left, n = 7) CD1dWT female mice and nulliparous (top right, n = 6) and parous (bottom right, n = 7) CD1dKO female mice. p = 0.86 for pre-pregnancy glands and p = 0.78 for post-pregnancy glands. Scale: 7 mm. Zoom-in panels, scale 500 μm. (E) Flow cytometry analysis of mammary resident NKTs from pre- and post-pregnancy CD1dKO mammary tissue. n = 4 nulliparous and n = 4 parous female mice. *p = 0.3. (F) Flow cytometry analysis of α and γδ TCRs of mammary resident NKTs from pre- (n = 3) and post-pregnancy (n = 3) CD1dKO mammary tissue. *p = 0.5. For all analyses, error bars indicate standard error of mean across samples of the same experimental group. Statistically significant differences were considered with Student’s t test p < 0.05. See also Figure S7.
Figure 4.
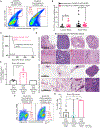
Figure 4.. Lack of mammary oncogenesis is marked by NKT expansion and CD1d+ MECs
(A) Flow cytometry analysis of mammary resident NKTs (CD45+NK1.1+CD3+) from DOX-treated, nulliparous (left panel, n = 5) and parous (right panel, n = 5) CAGMYC female mice. *p = 0.002. (B) Flow cytometry quantification of CD1d+ luminal and myoepithelial MECs from DOX-treated, nulliparous (left panel, n = 16) and parous (right panel, n = 11) CAGMYC female mice. *p = 0.02. (C) Mammary tumor-free survival plot of nulliparous (black line, n = 5) and parous (pink line, n = 5) Brca1KO female mice. (D) H&E-stained histological images from mammary tissue and tumors from nulliparous (top panels) and parous (bottom panels) Brca1KO female mice. Scale: 5 mm. Zoom-in panels, scale: 500 μm. (E) Flow cytometry quantification of CD1d+CD24high luminal MECs from Brca1KO pre-pregnancy mammary tumors (black bar, n = 3), Brca1KO post-pregnancy healthy mammary tissue (pink bar, n = 4), and Brca1KO post-pregnancy mammary tumor (blue bar, n = 1). *p = 0.02. (F) Flow cytometry analysis of NKTs in normal mammary tissue from nulliparous, tumor-bearing, Brca1KO female mice (left panel, n = 4) and normal mammary tissue from healthy parous Brca1KO female mice (right panel, n = 4). *p = 0.003. (G) Quantification of γδNKTs in normal mammary tissue from nulliparous, tumor-bearing, Brca1KO female mice (black bar panel, n = 4), in mammary tumor tissue from nulliparous Brca1KO female mice (blue bar, n = 3), and in normal mammary tissue from healthy parous Brca1KO female mice (black bar panel, n = 2). *p = 0.023 and **p = 0.008. For all analyses, error bars indicate standard error of mean across samples of the same experimental group. Statistically significant differences were considered with Student’s t test p < 0.05. See also Figures S8-S12.
Figure 5.
Figure 5.. Functionally active NKTs are required to block malignant progression of post-pregnancy MECs
(A) H&E-stained images of mammary tissue harvested from DOX-treated (DD5), nulliparous CAGMYC-CD1dWT (far-left panels), nulliparous CAGMYC-CD1dKO (left panels), parous CAGMYC-CD1dWT (right panels), and parous CAGMYC-CD1dKO (far right panels) female mice. Green arrows indicate signs of malignant lesions/mammary hyperplasia. Green asterisks indicate normal-like ductal structures. Scale: 1 mm. (B) H&E-stained images of DOX-treated, CD1dWT mammary tissue transplanted with pre-pregnancy CAGMYC-CD1dWT MECs (blue font, top far left panel), pre-pregnancy CAGMYC-CD1dKO MECs (black font, top panel), post-pregnancy CAGMYC-CD1dWT (blue font, bottom far left panel), or post-pregnancy CAGMYC-CD1dKO MECs (black font, bottom panel). Green arrows indicate signs of malignant lesions/mammary hyperplasia. Green asterisks indicate normal-like ductal structures. Scale: 500 μm. See also Figure S13.

Comment in

References

    1. Almishri W, Santodomingo-Garzon T, Le T, Stack D, Mody CH, and Swain MG (2016). TNFαNF6n omingo-Garzon competing interests to disclose.TNFR2. J. Innate Immun 8, 617–629. - PMC - PubMed
    1. Anders S, and Huber W (2010). Differential expression analysis for sequence count data. Genome Biol. 11, R106. - PMC - PubMed
    1. Andrews S (2015). FASTQC A Quality Control tool for High Throughput Sequence Data (Babraham Institute).
    1. Angerer P, Haghverdi L, Büttner M, Theis FJ, Marr C, and Buettner F (2016). destiny: diffusion maps for large-scale single-cell data in R. Bioinformatics 32, 1241–1243. - PubMed
    1. Annunziato S, de Ruiter JR, Henneman L, Brambillasca CS, Lutz C, Vaillant F, Ferrante F, Drenth AP, van der Burg E, Siteur B, et al. (2019). Comparative oncogenomics identifies combinations of driver genes and drug targets in BRCA1-mutated breast cancer. Nat. Commun 10, 397. - PMC - PubMed

Publication types

MeSH terms

Substances