

Identifying and evaluating clinical subtypes of Alzheimer's disease in care electronic health records using unsupervised machine learning
- PMID: 34879829
- PMCID: PMC8653614
- DOI: 10.1186/s12911-021-01693-6
Identifying and evaluating clinical subtypes of Alzheimer's disease in care electronic health records using unsupervised machine learning
Abstract
Background: Alzheimer's disease (AD) is a highly heterogeneous disease with diverse trajectories and outcomes observed in clinical populations. Understanding this heterogeneity can enable better treatment, prognosis and disease management. Studies to date have mainly used imaging or cognition data and have been limited in terms of data breadth and sample size. Here we examine the clinical heterogeneity of Alzheimer's disease patients using electronic health records (EHR) to identify and characterise disease subgroups using multiple clustering methods, identifying clusters which are clinically actionable.
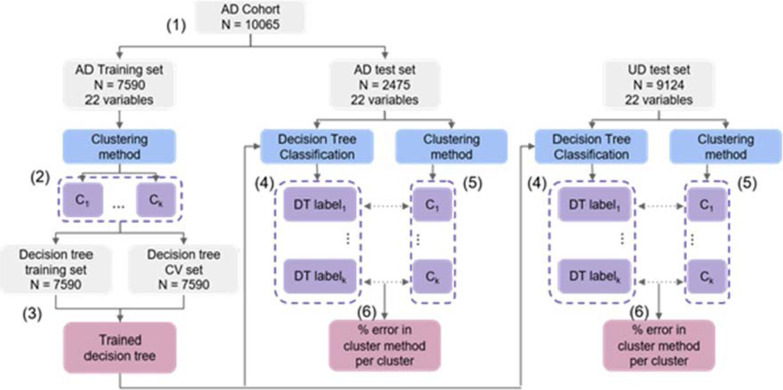
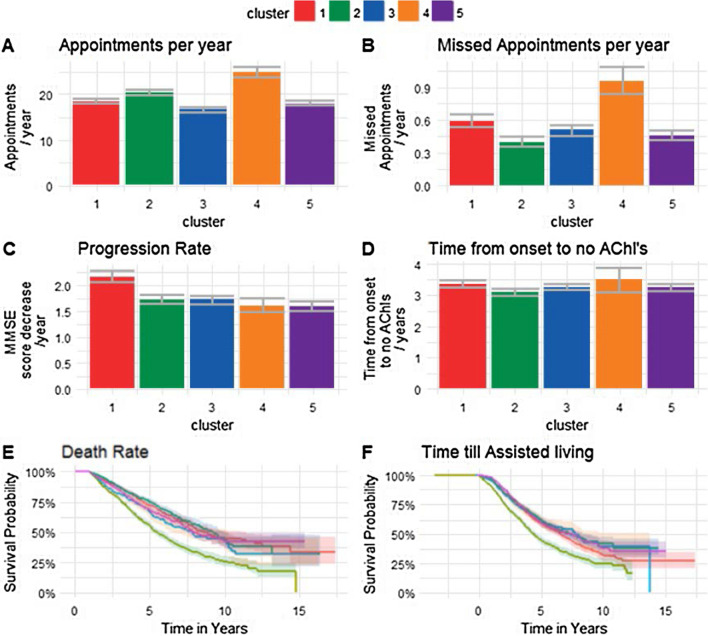
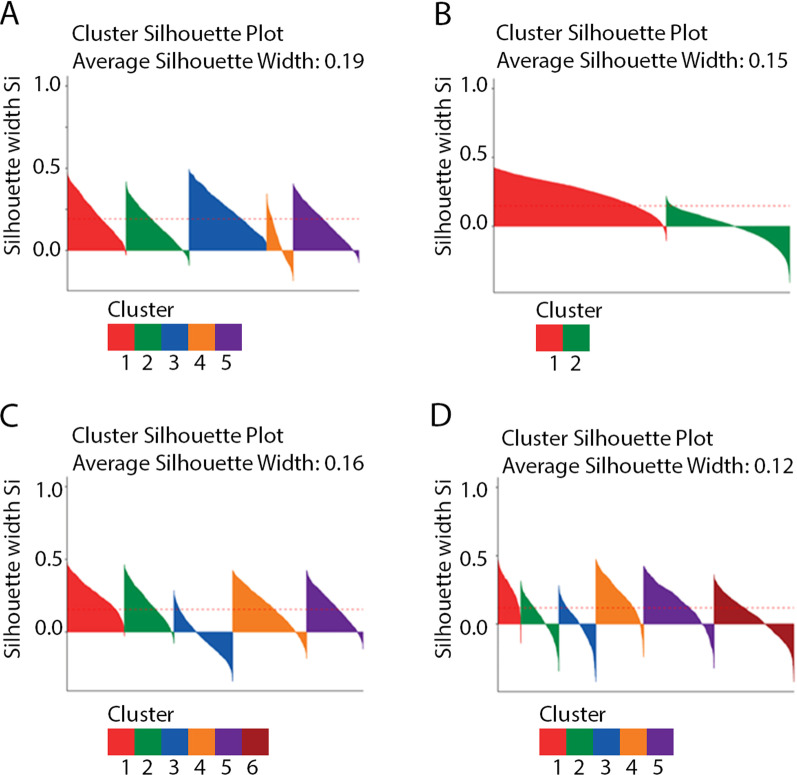
Methods: We identified AD patients in primary care EHR from the Clinical Practice Research Datalink (CPRD) using a previously validated rule-based phenotyping algorithm. We extracted and included a range of comorbidities, symptoms and demographic features as patient features. We evaluated four different clustering methods (k-means, kernel k-means, affinity propagation and latent class analysis) to cluster Alzheimer's disease patients. We compared clusters on clinically relevant outcomes and evaluated each method using measures of cluster structure, stability, efficiency of outcome prediction and replicability in external data sets.
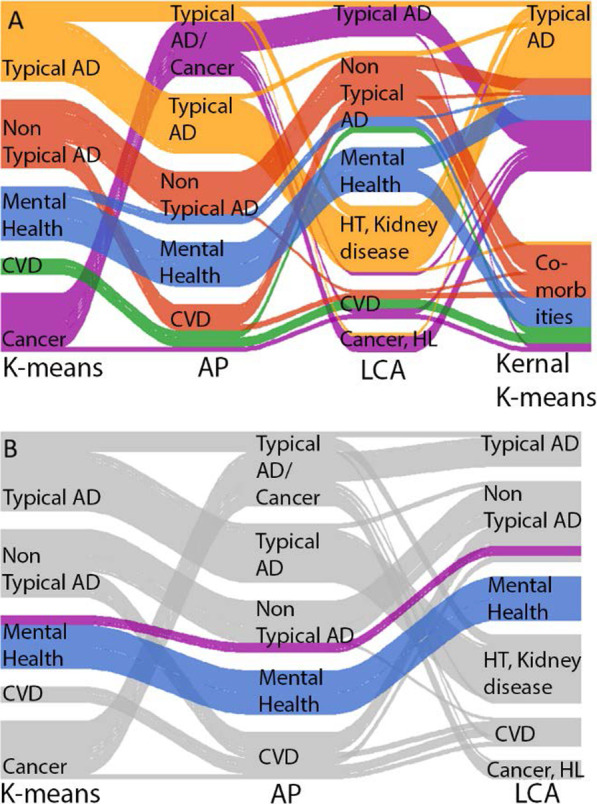
Results: We identified 7,913 AD patients, with a mean age of 82 and 66.2% female. We included 21 features in our analysis. We observed 5, 2, 5 and 6 clusters in k-means, kernel k-means, affinity propagation and latent class analysis respectively. K-means was found to produce the most consistent results based on four evaluative measures. We discovered a consistent cluster found in three of the four methods composed of predominantly female, younger disease onset (43% between ages 42-73) diagnosed with depression and anxiety, with a quicker rate of progression compared to the average across other clusters.
Conclusion: Each clustering approach produced substantially different clusters and K-Means performed the best out of the four methods based on the four evaluative criteria. However, the consistent appearance of one particular cluster across three of the four methods potentially suggests the presence of a distinct disease subtype that merits further exploration. Our study underlines the variability of the results obtained from different clustering approaches and the importance of systematically evaluating different approaches for identifying disease subtypes in complex EHR.
Keywords: Alzheimer's disease; Clustering; EHR; K-means; Subtyping.
© 2021. The Author(s).
Conflict of interest statement
The authors declare no competing interests.
Figures
References
-
- Ferrari C, Lombardi G, Polito C, Lucidi G, Bagnoli S, Piaceri I, et al. Alzheimer’s disease progression: factors influencing cognitive decline. J Alzheimers Dis. 2017;61(2):785–791. - PubMed
-
- Modrego PJ, Lobo A. Determinants of progression and mortality in Alzheimers disease: a systematic review. Neuropsychiatry. 2018 doi: 10.4172/Neuropsychiatry.1000479. - DOI
-
- Hastie T, Tibshirani R, Friedman J. The elements of statistical learning: data mining, inference, and prediction. Berlin: Springer; 2013. p. 536.
Publication types
MeSH terms
Grants and funding
LinkOut - more resources
Full Text Sources
Medical
