Review
. 2022 Apr:84:101052.
doi: 10.1016/j.mam.2021.101052. Epub 2021 Dec 5.

Altitude acclimatization, hemoglobin-oxygen affinity, and circulatory oxygen transport in hypoxia

Affiliations
Review

Altitude acclimatization, hemoglobin-oxygen affinity, and circulatory oxygen transport in hypoxia

Jay F Storz et al. Mol Aspects Med. 2022 Apr.

Abstract

In mammals and other air-breathing vertebrates that live at high altitude, adjustments in convective O2 transport via changes in blood hemoglobin (Hb) content and/or Hb-O2 affinity can potentially mitigate the effects of arterial hypoxemia. However, there are conflicting views about the optimal values of such traits in hypoxia, partly due to the intriguing observation that hypoxia-induced acclimatization responses in humans and other predominantly lowland mammals are frequently not aligned in the same direction as evolved phenotypic changes in high-altitude natives. Here we review relevant theoretical and empirical results and we highlight experimental studies of rodents and humans that provide insights into the combination of hematological changes that help attenuate the decline in aerobic performance in hypoxia. For a given severity of hypoxia, experimental results suggest that optimal values for hematological traits are conditional on the states of other interrelated phenotypes that govern different steps in the O2-transport pathway.

Keywords: Aerobic performance; High-altitude adaptation; Hypoxia; Oxygen transport pathway; VO(2max).


Conflict of interest statement

Conflicts of interest: none

Figures

Figure 1.
Figure 1.
Schematic illustration of blood O2 transport. (A) O2-equilibrium curve under the physicochemical conditions prevailing in arterial blood (a, solid curve, open symbol) and venous blood (v, dashed curve, closed symbol). The curve is a plot of blood O2 content (y-axis) versus PO2 (x-axis), with paired values for arterial and venous blood connected by a solid line. CaO2 - CvO2 denotes the arterial–venous difference in blood O2 content, PaO2 - PvO2 denotes the corresponding difference in PO2, βbO2 denotes the blood O2 capacitance coefficient (see text for details), Q denotes cardiac output, and VO2 denotes the rate of O2 consumption. On the right-hand side of the graph, the area of the rectangle is proportional to total O2 consumption, which can be enhanced by increasing Q and/or by increasing βbO2. Increases in βbO2 produce a corresponding increase in CaO2 - CvO2 through shifts in the shape or position of the O2-equilibrium curve.
Figure 2.
Figure 2.
O2-equilibrium curves showing the effect of changes in Hb-O2 affinity on tissue O2 delivery under conditions of normoxia (A) and hypoxia (B). In panel B, the PO2 for venous blood (PvO2) is marked by a vertical grey line that extends to the x-axis. P50, the PO2 at which Hb is 50% saturated. Each change in Hb-O2 affinity produces a shift in PvO2, but the PO2 of arterial blood (PaO2) is assumed to remain constant. Note that in normoxia (A) the right-shifted curve maximizes βbO2 and preserves a higher PvO2 (an overall index of tissue oxygenation). In hypoxia, by contrast, the left-shifted curve maximizes βbO2 and preserves a higher PvO2 relative to the right-shifted curve.
Figure 3.
Figure 3.
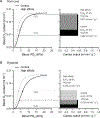
Johansen plots showing how traits that govern circulatory O2 delivery and tissue O2 extraction contribute to VO2max in Sprague-Dawley rats. Data are shown for rats tested in normoxia (A) and hypoxia (B). Left-hand panels show O2-equilbrium curves based on data for the control group (solid black line) and the treatment group with pharmacologically increased Hb-O2 affinity (solid grey line). In both A and B, the area of the box in the right-hand panel denotes VO2max elicited by aerobic exercise (value inside the box in ml min−1 g−1). Graphs were plotted using data from experimental groups 2 and 3 in Henderson et al. (2000).
Figure 4.
Figure 4.
Johansen plot showing how traits that govern circulatory O2 delivery and tissue O2 extraction contribute to hypoxic VO2max in highland deer mice (Permomyscus maniculatus) and lowland white-footed mice (P. leucopus). The left-hand panel shows O2-equilbrium curves based on data for highland deer mice (grey) and lowland white-footed mice (black). In the right-hand panel, the area of the box denotes thermogenic VO2max elicited by cold exposure (value inside the box in ml min−1 g−1). Replicated from Wearing and Scott (2021) and based on experimental data from Tate et al. (2020) and Ivy et al. (2020).
Figure 5.
Figure 5.
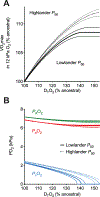
Effects of increasing tissue O2 diffusing capacity (DTO2) on hypoxic VO2max and blood PO2’s inferred from mathematical modeling of the O2-transport pathway in deer mice. (A) Relative changes in hypoxic VO2max and (B) changes in alveolar (PAO2), arterial (PaO2), and venous (PvO2) in response to relative increases in DTO2. Effects were modeled using blood P50’s of deer mice with representative high- and low-altitude Hb genotypes (mean values and standard errors of the mean are denoted with bold and fine lines, respectively). Reproduced from Wearing et al. (2021).
Figure 6.
Figure 6.
Relationship between the change in VO2max between exercise trials in normoxia vs. hypoxia and the corresponding change in oxyHb saturation. Data are for human subjects with normal or high-affinity Hbs. Reproduced with permission from Dominelli et al. (2020).

Similar articles

Cited by

References

    1. Aste-Salazar H, Hurtado A. 1944. The affinity of hemoglobin for oxygen at sea level and at high altitudes. American Journal of Physiology 142, 733–743.
    1. Bencowitz HZ, Wagner PD, West JB. 1982. Effect of change in P50 on exercise tolerance at high-altitude - a theoretical study. Journal of Applied Physiology 53, 1487–1495. - PubMed
    1. Bouverot P 1985. Adaptation to Altitude-Hypoxia in Vertebrates. Berlin: Springer-Verlag.
    1. Calbet JAL, Boushel R, Radegran G, Sondergaard H, Wagner PD, Saltin B. 2003. Why is VO2max after altitude acclimatization still reduced despite normalization of arterial O2 content? American Journal of Physiology-Regulatory Integrative and Comparative Physiology 284, R304–R316. - PubMed
    1. Calbet JAL, Lundby C, Koskolou M, Boushel R. 2006. Importance of hemoglobin concentration to exercise: Acute manipulations. Respiratory Physiology & Neurobiology 151, 132–140. - PubMed

Publication types

LinkOut - more resources