

Comprehensive Genomic Profiling of Neuroendocrine Carcinomas of the Gastrointestinal System
- PMID: 34880079
- PMCID: PMC9394397
- DOI: 10.1158/2159-8290.CD-21-0669
Comprehensive Genomic Profiling of Neuroendocrine Carcinomas of the Gastrointestinal System
Abstract
The neuroendocrine carcinoma of the gastrointestinal system (GIS-NEC) is a rare but highly malignant neoplasm. We analyzed 115 cases using whole-genome/exome sequencing, transcriptome sequencing, DNA methylation assays, and/or ATAC-seq and found GIS-NECs to be genetically distinct from neuroendocrine tumors (GIS-NET) in the same location. Clear genomic differences were also evident between pancreatic NECs (Panc-NEC) and nonpancreatic GIS-NECs (Nonpanc-NEC). Panc-NECs could be classified into two subgroups (i.e., "ductal-type" and "acinar-type") based on genomic features. Alterations in TP53 and RB1 proved common in GIS-NECs, and most Nonpanc-NECs with intact RB1 demonstrated mutually exclusive amplification of CCNE1 or MYC. Alterations of the Notch gene family were characteristic of Nonpanc-NECs. Transcription factors for neuroendocrine differentiation, especially the SOX2 gene, appeared overexpressed in most GIS-NECs due to hypermethylation of the promoter region. This first comprehensive study of genomic alterations in GIS-NECs uncovered several key biological processes underlying genesis of this very lethal form of cancer.
Significance: GIS-NECs are genetically distinct from GIS-NETs. GIS-NECs arising in different organs show similar histopathologic features and share some genomic features, but considerable differences exist between Panc-NECs and Nonpanc-NECs. In addition, Panc-NECs could be classified into two subgroups (i.e., "ductal-type" and "acinar-type") based on genomic and epigenomic features. This article is highlighted in the In This Issue feature, p. 587.
©2021 The Authors; Published by the American Association for Cancer Research.
Figures
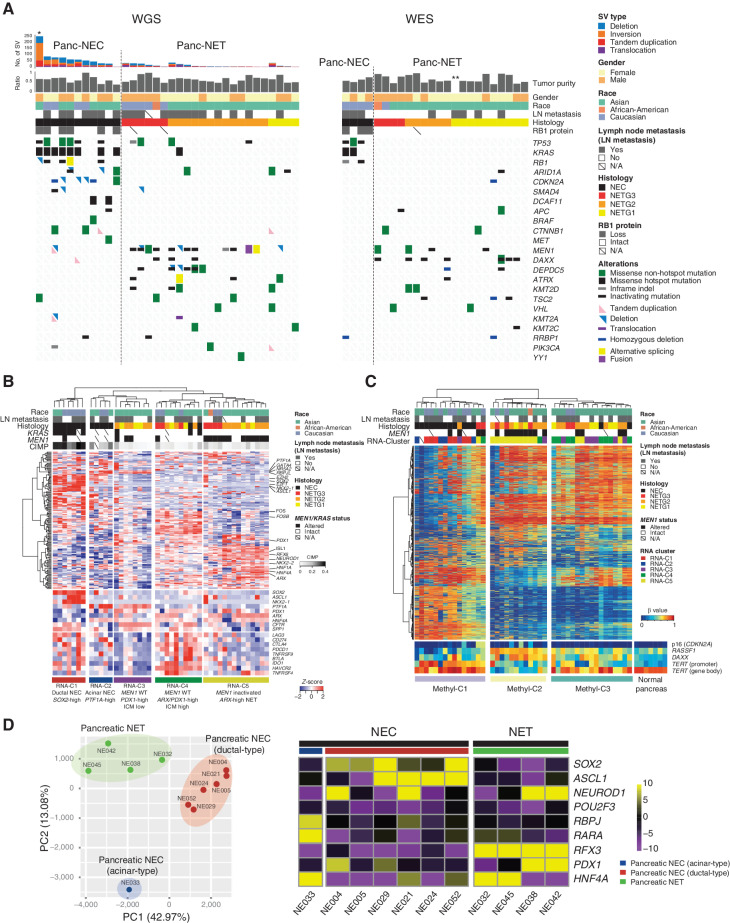
![Figure 1. Genomic alterations of GIS-NECs. A, Landscape of genomic alterations in GIS-NEC cases. The left oncoplot indicates WGS data, and representative gene expression data are obtained from frozen samples. The cases are arranged from left to right according to descending order of the number of SVs in each primary organ. Asterisks, organoid samples. The right oncoplot shows WES data in patients differing from patients available on the WGS data. B, Hematoxylin and eosin (H&E) staining and synaptophysin immunolabeling of TP53 and RB1 double knockout (TR-KO) organoids before and after blocking Notch signaling with a γ-secretase inhibitor (DAPT). The synaptophysin-positive cells were increased by the Notch inhibitor. Scale bar, 100 μm. C, Unsupervised hierarchical cluster analysis with 2,000 high variant probes for DNA methylation in GIS-NECs. D, Integration of RNA-seq and DNA methylation array data comparing GIS-NECs with normal tissues. RNA-seq data were filtered using significant differentially expressed gene (DEG; abs [log2FC] ≥ 1) with significant FDR values (<0.05). DNA methylation assay data were filtered using differentially methylated regions (DMR; abs [Δβ value] ≥ 0.1) with significant adjusted P values (<0.05). In the area of the figure showing high levels of gene expression and hypermethylation, 199 DMRs are situated, of which 39 (19.6%) are transcription factors (TF; red dots) including SOX2 and ASCL1. In contrast, in the area of the figure showing high levels of gene expression and hypomethylation, 424 DMRs are situated, of which 28 (6.6%) are TFs. CHGA, chromogranin A. E, Schematic of NET–AKR fusion genes detected in two gastric NECs. The neuroepithelioma transforming gene1 (NET1) is a specific guanine nucleotide exchange factor for RhoA. Both aldo-keto reductase family 1 members C3 (AKR1C3) and C4 (AKR1C4) are reductase enzymes that play critical roles in the biotransformation of endogenous substrates such as steroids. The chimeric genes demonstrate in-frame fusion of the NET1 amino terminus (exons 1–3) and the AKR1C3 carboxyl terminus (exons 2–9) or the AKR1C4 carboxyl terminus (exons 6–9). NLS, nuclear localization signal; DH, Dbl homology; PH, pleckstrin homology; PDZ, post-synaptic density 95; aa, amino acids. F, Gastric NEC with the Merkel cell polyomavirus (MCPyV; case NE002). The read depth along the polyomavirus genome is shown in blue, and read pairs bridging the polyomavirus genome and the integration site on chromosome 8 are indicated by red lines. Polyomavirus genes are indicated by large T antigen, small T Antigen, VP1, VP2, and VP3.](https://cdn.ncbi.nlm.nih.gov/pmc/blobs/c657/9394397/8e0be143173e/692fig1.jpg)
Comment in
- Cancer Discov. 12:587.
- Cancer Discov. 12:587.
References
-
- WHO Classification of Tumors Editorial Board. WHO classification of tumors: digestive system tumours. Lyon, France: International Agency of Research on Cancer; 2019.
-
- Milione M, Maisonneuve P, Pellegrinelli A, Grillo F, Albarello L, Spaggiari Pet al. . Ki67 proliferative index of the neuroendocrine component drives MANEC prognosis. Endocr Relat Cancer 2018;25:583–93. - PubMed
-
- Scarpa A, Chang DK, Nones K, Corbo V, Patch AM, Bailey Pet al. . Whole-genome landscape of pancreatic neuroendocrine tumours. Nature 2017;543:65–71. - PubMed
Publication types
MeSH terms
Grants and funding
LinkOut - more resources
Full Text Sources
Research Materials
Miscellaneous
