. 2021 Dec 8;12(12):1139.
doi: 10.1038/s41419-021-04432-x.

Nucleolar stress controls mutant Huntington toxicity and monitors Huntington's disease progression

Affiliations

Nucleolar stress controls mutant Huntington toxicity and monitors Huntington's disease progression

Aynur Sönmez et al. Cell Death Dis. .

Abstract

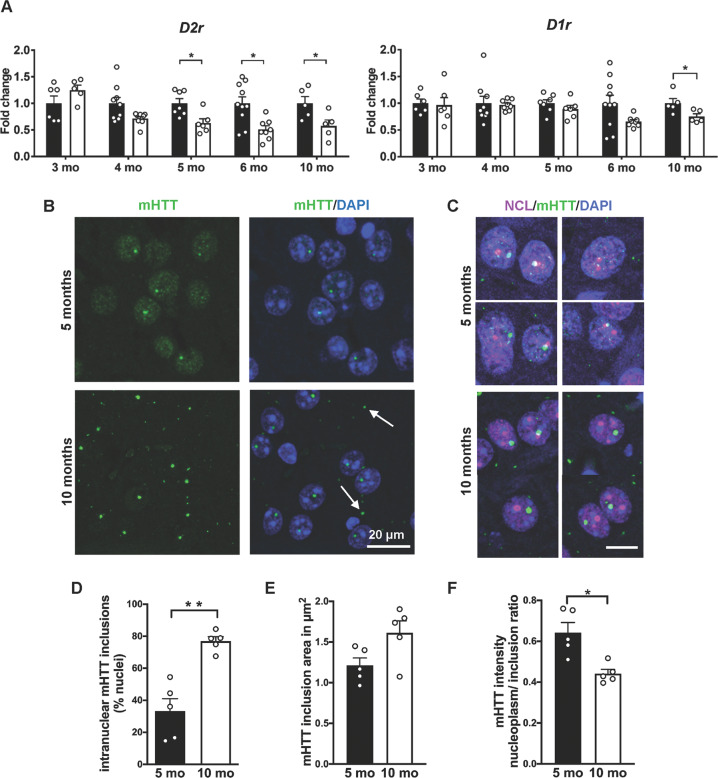
Transcriptional and cellular-stress surveillance deficits are hallmarks of Huntington's disease (HD), a fatal autosomal-dominant neurodegenerative disorder caused by a pathological expansion of CAG repeats in the Huntingtin (HTT) gene. The nucleolus, a dynamic nuclear biomolecular condensate and the site of ribosomal RNA (rRNA) transcription, is implicated in the cellular stress response and in protein quality control. While the exact pathomechanisms of HD are still unclear, the impact of nucleolar dysfunction on HD pathophysiology in vivo remains elusive. Here we identified aberrant maturation of rRNA and decreased translational rate in association with human mutant Huntingtin (mHTT) expression. The protein nucleophosmin 1 (NPM1), important for nucleolar integrity and rRNA maturation, loses its prominent nucleolar localization. Genetic disruption of nucleolar integrity in vulnerable striatal neurons of the R6/2 HD mouse model decreases the distribution of mHTT in a disperse state in the nucleus, exacerbating motor deficits. We confirmed NPM1 delocalization in the gradually progressing zQ175 knock-in HD mouse model: in the striatum at a presymptomatic stage and in the skeletal muscle at an early symptomatic stage. In Huntington's patient skeletal muscle biopsies, we found a selective redistribution of NPM1, similar to that in the zQ175 model. Taken together, our study demonstrates that nucleolar integrity regulates the formation of mHTT inclusions in vivo, and identifies NPM1 as a novel, readily detectable peripheral histopathological marker of HD progression.


Conflict of interest statement

The authors declare no competing interests.

Figures

Fig. 1
Fig. 1. Cells expressing Huntingtin mutations display altered distribution of nucleolar NPM1 and alterations of pre-rRNA processing.
A Representative confocal images of NPM1 and NCL immunofluorescence staining in Q7/7 and Q111/111 cells. B Quantification of the percentage of nuclei with nucleolar ring-like NCL and NPM1 signals. The percentage of nuclei with nucleolar NPM1 is significantly reduced in the Q111/111 cells by Mann–Whitney U test (p = 0.014) (n: number of nuclei = 421 in Q7/7 and 634 in Q111/111; N: fields of view in two independent experiments = 6 for Q7/7 and Q111/111). Values represent mean values and error bars are SEM. *p < 0.05. Detailed statistical information is included in the Supplementary Statistical Information file. C Mouse pre-rRNA processing pathway. Three out of four mature rRNAs (the 18 S, 5.8 S, and 28 S) are encoded in a single polycistronic transcript synthesized by RNA polymerase I, the 47 S. Mature rRNAs are embedded in 5′ and 3′ external transcribe spacers (5′- and 3′-ETS) and internal transcribed spacers 1 and 2 (ITS1 and 2) and are produced by extensive processing of the 47 S. Processing sites (A′, A0, 1 etc.) are indicated in blue. There are two alternative processing pathways in mouse (pathways 1 and 2, boxed) according to initial processing in 5′-ETS or ITS1, respectively. D Total RNA was extracted, separated on denaturing high-resolution agarose gel, stained with ethidium bromide to reveal large mature rRNAs, or processed for Northern blotting. Species labeled “1–4” (in red) are extended forms of the 34 S pre-rRNAs that were not previously described. Species “2, 3, and 4” are detected in the control cells (Q7/7). Species “1” is only detected in the mutant cells (Q111/Q111). Species “1” is formed at the cost of species “2” (the upper band of the doublet). The boxed area highlights the appearance of species “1” in Q111/Q111 cells, which is concomitant with the disappearance of species “2”. E The samples described in panel (D) were run in a longer migration to separate more efficiently the doublet corresponding to bands “2 and 3”. F Ethidium bromide staining revealing that the steady state levels of 18 S and 28 S rRNA are not grossly affected.
Fig. 2
Fig. 2. Delocalization of NPM1 and NCL and altered nuclear distribution of mHTT inclusions upon irreversible induction of nucleolar stress in striatal neurons.
A Representative confocal images of striatal sections from control, TIF-IAD1Cre, R6/2 and R6/2; TIF-IAD1Cre double mutant (dm) mice at 9 weeks co-immunostained with antibodies against the nucleolar marker NPM1 and NCL, and p62 and mHTT (EM48), respectively. Insets are high magnification of the nuclei highlighted by the white arrow. Scale bar: 20 µm, 10 µm (insets). B mHTT nuclear distribution measured as the ratio between mHTT mean intensity in the nucleoplasm and in the nuclear inclusions in R6/2 (N = 4) and dm (N = 4) mice. mHTT intensity in the nucleoplasm of dm is significantly lower in comparison with R6/2 mice (Mann–Whitney U test, p = 0.03). C Higher nucleolar integrity assessed by NCL intensity in the nucleus correlates with a higher nucleoplasm/inclusion mHTT intensity ratio in R6/2 (n: number of nuclei = 335, N: number of mice = 4) and dm mice (n: number of nuclei = 296, N: number of mice = 4); (p < 0.0001 for R6/2 and dm; Pearson coefficient r for R6/2 is 0.67 and for the dm 0.68).
Fig. 3
Fig. 3. mHTT nuclear distribution changes at different stages in the striatum of zQ175 knock-in model.
A Relative expression of D2r and D1r mRNA in the striatum by qRT-PCR at 3, 4, 5, 6 and 10 months (mo) in control (N = 6, 8, 7, 10, 5) and zQ175 mutant (N = 6, 8, 6, 8, 5) mice is expressed as fold change to the respective controls. Significantly decreased relative expression of D2r at 5 (p = 0.014), 6 (p = 0.012), and 10 months (p = 0.032) and of D1r at 10 months (p = 0.032) by Mann–Whitney U test. B, C Representative confocal images of striatal sections from zQ175 mice at 5 and 10 months stained with antibodies against mHTT (EM48) and counterstained with DAPI to visualize the nuclei, and with antibodies against mHTT (EM48) and NCL. Scale bar: 20 µm (B), 10 µm (C). D Quantification of the nuclei with mHTT inclusion bodies in the zQ175 mice at 5 and 10 months shows a significant increase at 10 months by Mann–Whitney U test (p = 0.008). E Nonsignificant statistical differences in the mean area of the mHTT inclusion signal by Mann–Whitney U test (p = 0.09) between zQ175 mice at 5 and 10 months. F Nuclear distribution of mHTT is measured as the ratio between mHTT mean intensity in the nucleoplasm and in the nuclear inclusions at 5 and 10 months. mHTT intensity in the nucleoplasm at 10 months is significantly lower by Mann–Whitney U test (p = 0.016). N: number of mice = 5; values represent mean values and error bars are SEM. *p < 0.05, **p < 0.01.
Fig. 4
Fig. 4. Redistribution of NPM1 in the striatum of pre-symptomatic zQ175 mice.
A, B Representative confocal images of striatal sections stained for NPM1 (green) and NCL (red) in control and zQ175 mice at 5 and 10 months. Scale bar: 20 µm. C Quantification of the percentage of nuclei with nucleolar localization of NCL or NPM1 expressed as percentage of nuclei showing them as a circular nucleolar signal at 5 and 10 months in control and zQ175 mice (N: number of mice, control: 7,7,5,3 and zQ175: 8,5,5,5). Significant decrease in the number of nuclei showing nucleolar NPM1 in the zQ175 mice at 5 months in comparison with their respective controls by Mann–Whitney U test (p = 0.02). Values represent mean ± SEM. *p < 0.05. D Super-resolution (STED) microscopic images showing loss of NPM1 (red) ring-like organization and its association with disperse mHTT (green) signals at 5 months, but not at 10 months. E Line scans through the boxed regions containing the nucleolus and mHTT inclusion describe the distribution of NPM1 and mHTT signals in the zQ175 mice at both ages. A close proximity of mHTT and NPM1 signals at 5 months can be observed. Scale bar: 2 μm, zoom: 100 nm.
Fig. 5
Fig. 5. NPM1 nucleolar localization is altered in the skeletal muscle (quadriceps) of zQ175 mice at a symptomatic stage.
A Representative confocal images of quadriceps cryosections stained for NPM1 (green) or NCL (red) in control and zQ175 mice at 5 and 10 months. Nuclei are labeled with DAPI (blue). The arrows point out to NPM1 or NCL signal. Scale bar: 20 μm. B Quantification of the percentage of nuclei with nucleolar localization of NPM1 or NCL at 5 and 10 months (mo) in control (N, number of mice, NPM: 4, 4; NCL: 3, 4) and zQ175 (N: number of mice, NPM: 5, 5; NCL: 3, 6) mice shows no significant differences. C Quantification of the mean area of the NPM1 or NCL signal (in μm2) per DAPI positive nuclei at 5 and 10 months (mo) in control (N for NPM1: 5, 4; for NCL: 3, 4) and zQ175 (N for NPM1: 4, 6; for NCL: 3, 5) mice shows a significant reduction in nucleolar NPM1 signal at 10 months by Mann–Whitney U test (p = 0.038). Error bars represent SEM. *p < 0.05.
Fig. 6
Fig. 6. NPM1 signal is reduced in muscle (quadriceps) biopsies of early-Huntington’s disease patients.
A Representative confocal images of human skeletal muscle (quadriceps) cryosections immunostained for NPM1 (green) or NCL (red) in HD patients at different stages and in age-matched controls. Nuclei are labeled with DAPI (blue). The arrows point to NPM1 or NCL signals. Scale bar: 20μm. B Quantification of the percentage of nuclei showing nucleolar NPM1 signal in HD patients in comparison with age-matched controls (N = 5 for each group), and indicating significant decreased NPM1 in early-HD by Kruskal–Wallis test and Dunn’s multiple comparison (p = 0.003 early-HD vs. controls). No significant differences in the percentage of nuclei with nucleolar NCL. C Mean area of the NPM1 signal (in μm2) per DAPI positive nuclei in control, pre- and early-HD individuals (N = 5 for each group). Statistically significant decrease of NPM1 signal area in early-HD compared with controls by Kruskal–Wallis test and Dunn’s multiple comparison (p = 0.01). No significant differences in the mean area of the NCL signal (in µm2) between the different groups. Error bars represent SEM. *p < 0.05, **p < 0.01; detailed statistical information is included in the Supplementary Statistical Information file.

References

    1. Parlato R, Bierhoff H. Role of nucleolar dysfunction in neurodegenerative disorders: a game of genes? AIMS Mol Sci. 2015;2:211–24.
    1. Herrmann D, Parlato R. C9orf72-associated neurodegeneration in ALS-FTD: breaking new ground in ribosomal RNA and nucleolar dysfunction. Cell Tissue Res. 2018;373:351–60.. - PubMed
    1. Lee J, Hwang YJ, Ryu H, Kowall NW, Ryu H. Nucleolar dysfunction in Huntington’s disease. Biochim Biophys Acta. 2014;1842:785–90. - PMC - PubMed
    1. Amer-Sarsour F, Ashkenazi A. The Nucleolus as a Proteostasis Regulator. Trends Cell Biol. 2019;29:849–51.. - PubMed
    1. Aladesuyi Arogundade O, Nguyen S, Leung R, Wainio D, Rodriguez M, Ravits J. Nucleolar stress in C9orf72 and sporadic ALS spinal motor neurons precedes TDP-43 mislocalization. Acta Neuropathol Commun. 2021;9:26. - PMC - PubMed

Publication types