. 2021 Dec 8;12(1):7115.
doi: 10.1038/s41467-021-27426-x.

Acetoacetate protects macrophages from lactic acidosis-induced mitochondrial dysfunction by metabolic reprograming

Affiliations

Acetoacetate protects macrophages from lactic acidosis-induced mitochondrial dysfunction by metabolic reprograming

Clément Adam et al. Nat Commun. .

Abstract

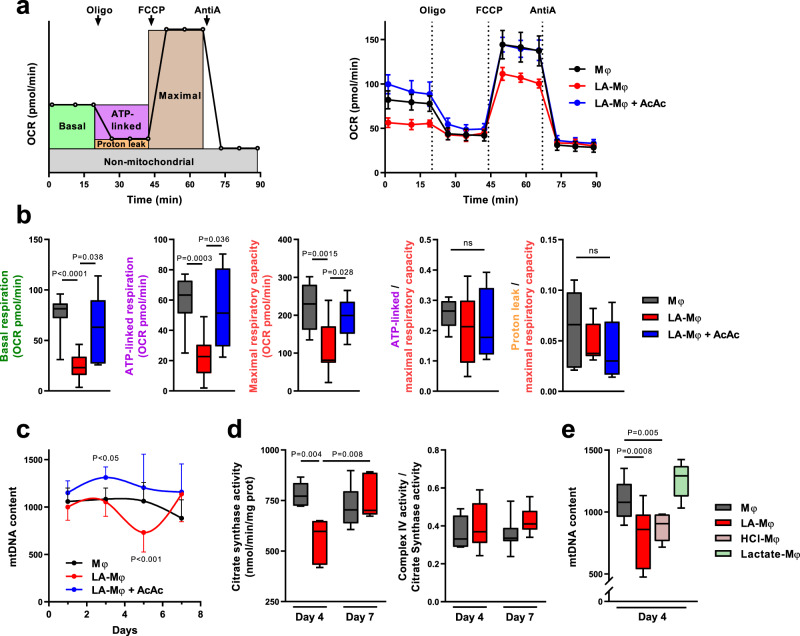
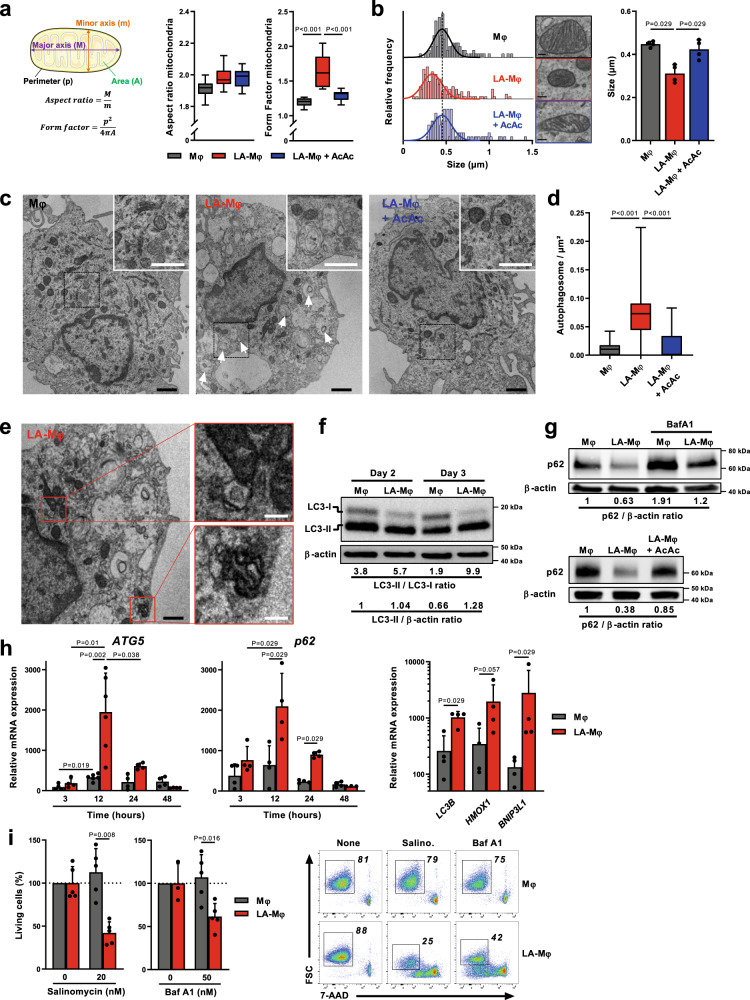
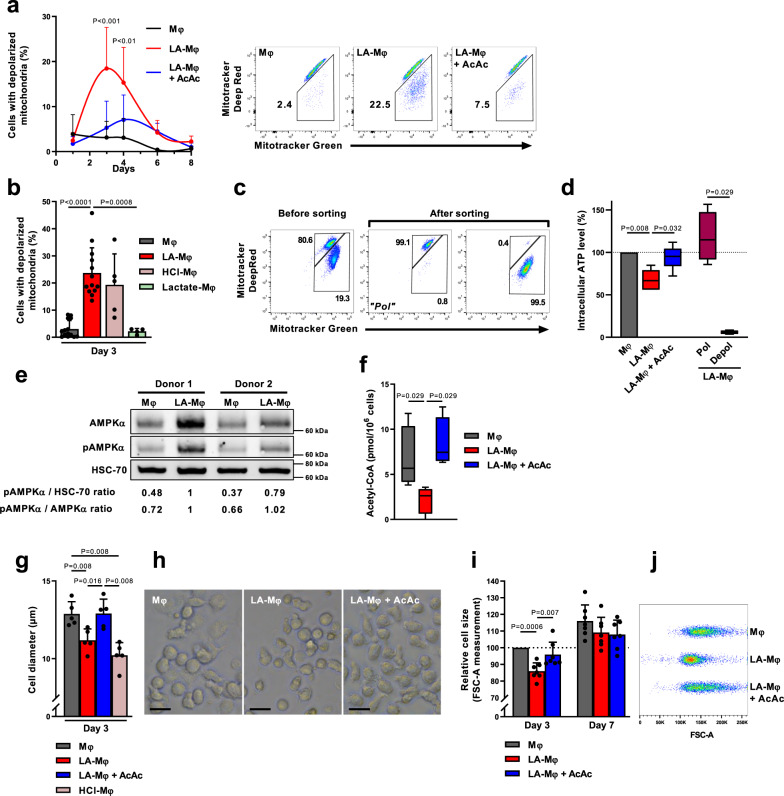
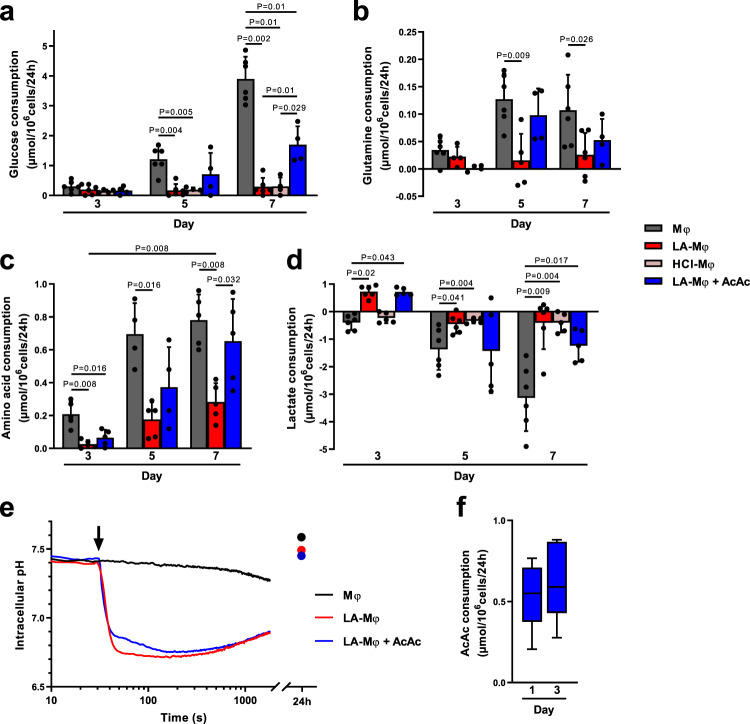
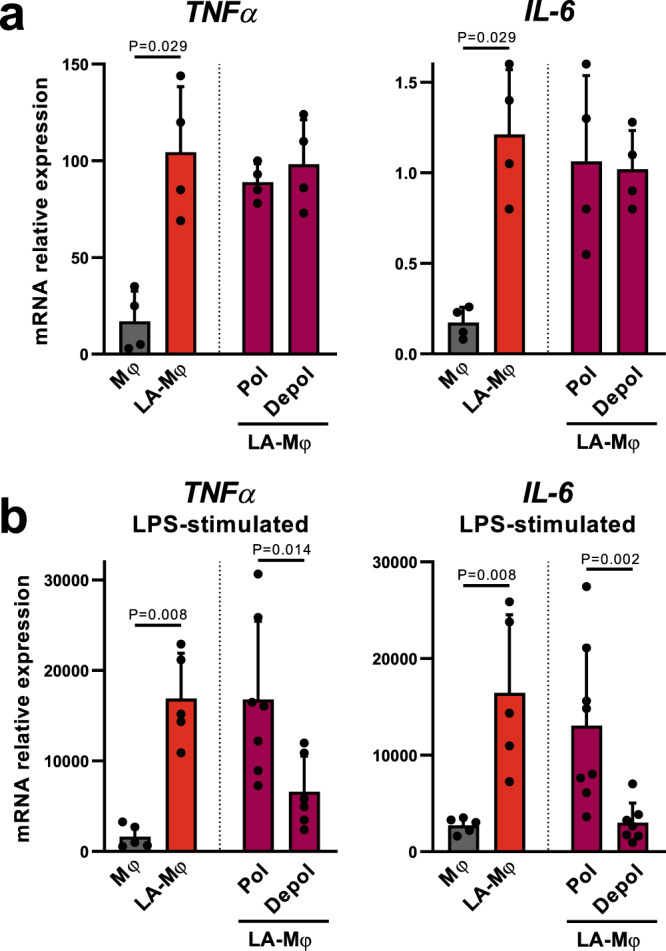
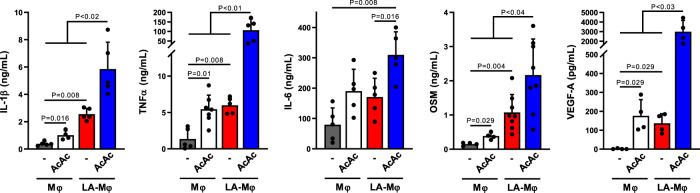
Lactic acidosis, the extracellular accumulation of lactate and protons, is a consequence of increased glycolysis triggered by insufficient oxygen supply to tissues. Macrophages are able to differentiate from monocytes under such acidotic conditions, and remain active in order to resolve the underlying injury. Here we show that, in lactic acidosis, human monocytes differentiating into macrophages are characterized by depolarized mitochondria, transient reduction of mitochondrial mass due to mitophagy, and a significant decrease in nutrient absorption. These metabolic changes, resembling pseudostarvation, result from the low extracellular pH rather than from the lactosis component, and render these cells dependent on autophagy for survival. Meanwhile, acetoacetate, a natural metabolite produced by the liver, is utilized by monocytes/macrophages as an alternative fuel to mitigate lactic acidosis-induced pseudostarvation, as evidenced by retained mitochondrial integrity and function, retained nutrient uptake, and survival without the need of autophagy. Our results thus show that acetoacetate may increase tissue tolerance to sustained lactic acidosis.


Conflict of interest statement

The authors declare no competing interests.

Figures

Fig. 1
Fig. 1. Sustained acidosis affects macrophage mitochondrial mass.
ae Monocytes were polarized into macrophages in the absence (Mφ) or presence of lactic acid (LA-Mφ), lactic acid and acetoacetate (LA-Mφ + AcAc), sodium lactate (Lactate-Mφ), or under acidosis (HCl-Mφ). a, b Monitoring of oxygen consumption rate (OCR) in day 4 macrophages following a sequential addition of oligomycin (oligo), carbonyl cyanide p-(trifluoromethoxy) phenylhydrazone (FCCP), and antimycin A (AntiA). Basal OCR, ATP-linked respiration, maximal respiratory capacity, and proton-leak respiration were determined as described in the Methods section. a Schematic (left panel) and representative (right panel) OCR profiles (mean ± SD; n = 8). b Metabolic parameters obtained from OCR profiling. ATP-linked respiration/maximal respiratory capacity (ATP-linked/maximal) and proton leak/maximal respiratory capacity (proton leak/maximal) ratios were calculated (n = 11 for Mφ and LA-Mφ; n = 5 for LA-Mφ + AcAc). c Quantification of mitochondrial DNA (mtDNA) copy number by qPCR from day 1 to day 7 (mean ± SD; n = 10). Two-way ANOVA followed by a Tukey post hoc test was performed for statistical analysis. d Citrate synthase activity and complex IV/citrate synthase ratio at day 4 and 7 (n = 6). e mtDNA was quantified on day 4 (n = 12 for Mφ and LA-Mφ; n = 6 for HCl-Mφ and Lactate-Mφ). ae The boxplots display a median line, interquartile range (IQR) boxes, min to max whiskers; two-tailed Mann–Whitney U test was performed for statistical analysis unless specified otherwise; ns not significant. Source data are provided in a Source Data file.
Fig. 2
Fig. 2. Human macrophages display upregulation of autophagic flux during lactic acidosis.
ai Monocytes were polarized without lactic acid (Mφ), with lactic acid (LA-Mφ) or with lactic acid and acetoacetate (LA-Mφ + AcAc). a Schematic representation of the morphological meaning of aspect ratio and form factor indexes (left) and analyses of these indexes by confocal microscopy in macrophages at day 5 (right) (n = 10 cells examined over 2 independent replicates). b Size of mitochondria measured on TEM micrographs at day 3. Left panel, representative frequency histograms (size bar, 0.1 µm); right panel, a compilation of the results (mean ± SD; n = 100–150 mitochondria examined over 4 independent replicates). c Representative TEM micrographs of the indicated Mφ subsets on day 3 (representative images shown from three independent biological experiments); arrows, autophagosomes; black size bar, 1 µm; white size bar (insert), 0.3 µm. d Quantification of autophagic vesicles per cell on day 3 (n = 30 cells examined over 3 biological replicates). e Representative TEM micrographs of mitophagy vacuoles in day 3 LA-Mφ (representative images shown from three independent biological experiments); black size bar, 1 µm; white size bar (insert), 0.3 µm. f, g Western blotting analysis of LC3-I, LC3-II (f), p62 (g), and β-actin (fg) in day 3 Mφ, in the presence or absence of bafilomycin A1 (BafA1) or AcAc. The LC3-II/LC3-I, LC3-II/β-actin, and p62/β-actin band intensity ratios are indicated (representative images shown from three independent experiments). h Levels of ATG5, p62, LC3B, HMOX1, and BNIP3L1 mRNA were assessed by RT-qPCR at the indicated time points (left and middle panels) and at 12 h (right panel) and were normalized to the expression of the RPS18 housekeeping gene (n = 4). i Day 2 Mφ was exposed to salinomycin or BafA1 for 24 h, and cell viability was evaluated by flow cytometry with 7-AAD staining (n = 5, left panel). Results are expressed as percent viability compared to the Mφ condition, which has been assigned a value of 100%. Representative dot plots showing 7-AAD staining versus FSC (right panel). ai The boxplots display a median line, interquartile range (IQR) boxes, min to max whiskers; a two-tailed Mann–Whitney U test was performed for statistical analysis. Source data are provided in a Source Data file.
Fig. 3
Fig. 3. Macrophages in conditions of lactic acidosis display mitochondrial depolarization and characteristics typical of starving cells.
a–k Monocytes were polarized into macrophages in the absence (Mφ) or presence of lactic acid (LA-Mφ), lactic acid and acetoacetate (LA-Mφ + AcAc), sodium lactate (Lactate-Mφ), or under acidosis (HCl-Mφ). a, b Cells with depolarized mitochondrial membrane potential (ΔΨm) were analyzed by flow cytometry using MitoTracker Green and MitoTracker Deep Red probes at the indicated time point (a) (mean ± SD; n = 4, two-way ANOVA followed by a Tukey post hoc test was performed for statistical analysis) or at day 3 (b) (mean ± SD; n = 14 for Mφ; n = 13 for LA-Mφ; n = 5 for HCl-Mφ; n = 4 for Lactate-Mφ). Representative dot plots on day 3 (a, right panel). c Macrophages with or without depolarized mitochondrial membrane potential (“Depol” and “Pol” populations, respectively) were isolated from day 3 LA-Mφ by flow cytometry with MitoTracker Green and MitoTracker Deep Red probes. Purity was >99%. d Intracellular ATP levels were measured in a semiquantitative assay. The results were normalized against the Mφ condition for each donor (n = 5). e Levels of total AMPKα, AMPKα phosphorylated on Thr172 (pAMPKα) and HSC-70 were analyzed by Western blotting at 6 h (representative images from four independent experiments); the values correspond to pAMPKα/HSC-70 and pAMPKα/AMPKα band intensity ratios. f Intracellular acetyl-CoA levels determined on day 3 (n = 4). gj Cell size was measured on day 3 (gj) and day 7 (i), by determining the mean ± SD of the diameter of Mφ in each population (g, n = 5) or relative cell size by flow cytometry with the FSC-A parameter (i, n = 7). h Photomicrographs of the Mφ population on day 3 (representative images from five independent experiments); size bar, 10 µm. j Representative dot plots from one donor of FSC-A measurement. aj The boxplots display a median line, interquartile range (IQR) boxes, min to max whiskers; a two-tailed Mann–Whitney U test was performed for statistical analysis unless specified otherwise. Source data are provided in a Source Data file.
Fig. 4
Fig. 4. Lactic acidosis is associated with pseudostarvation.
ae Monocytes were polarized into macrophages in the absence (Mφ) or presence of lactic acid (LA-Mφ), lactic acid and acetoacetate (LA-Mφ + AcAc), or under acidosis (HCl-Mφ). Glucose (a), glutamine (b), free l-amino acids (c), and lactate (d) were quantified at days 3, 5, and 7 in cell culture supernatants of Mφ, LA-Mφ, LA-Mφ + AcAc, and HCl-Mφ. Results are expressed in µmol/106 cells/24 h, with positive values for consumption and negative values for production (mean ± SD; Mφ and LA-Mφ: n = 6; HCl-Mφ: n = 4 (a) or n = 5 (d); LA-Mφ + AcAc: n = 4 (a, b) or n = 5 (c, d)). e Intracellular pH was measured by flow cytometry with the SNARF probe. Monocytes were loaded with the SNARF probe and analyzed for 30 s before the addition (arrow) of 10 mM lactic acid (LA-Mφ), with or without 5 mM acetoacetate (LA-Mφ + AcAc). The acquisition was then prolonged for an additional 30 min. Probe loading and acquisition were repeated at 24 h. Representative results from one of three independent experiments are shown. f Acetoacetate (AcAc) was quantified on days 1 and 3 in LA-Mφ + AcAc culture supernatants (n = 5). Results are expressed in µmol/106cells/24 h. af The boxplots display a median line, interquartile range (IQR) boxes, min to max whiskers; a two-tailed Mann–Whitney U test was performed for statistical analysis. Source data are provided in a Source Data file.
Fig. 5
Fig. 5. Relative expression of cytokine mRNAs by LA-Mφ with depolarized mitochondria.
a, b Monocytes were polarized into macrophages by incubation in the absence (Mφ) or presence of lactic acid (LA-Mφ) for 3 days. LA-Mφ with and without depolarized mitochondrial membranes (“Depol” and “Pol” populations, respectively) were sorted by flow cytometry with MitoTracker probes. Cells were unstimulated (a) or stimulated with LPS for 3 h (b) and the levels of TNFα and IL-6 mRNA were assessed by RT-qPCR. The results were expressed as mRNA levels relative to those for the housekeeping gene RPS18 (mean ± SD, a n = 4; b n = 5 for Mφ and LA-Mφ; n = 7 for “Depol” and “Pol” populations). A two-tailed Mann–Whitney U test was performed for statistical analysis. Source data are provided in a Source Data file.
Fig. 6
Fig. 6. Impact of AcAc on cytokine secretion by LA-Mφ.
Monocytes were differentiated into macrophages in the absence (Mφ) or presence of lactic acid (LA-Mφ), with or without acetoacetate (AcAc). On day 5, cells were stimulated for 16 h with LPS and IL-1β, TNFα, IL-6, oncostatin M (OSM), and VEGF-A were quantified by ELISA in the supernatants (mean ± SD, n = 4–8). A two-tailed Mann–Whitney U test was performed for statistical analysis. Source data are provided in a Source Data file.

References

    1. Dubos RJ. The micro-environment of inflammation or Metchnikoff revisited. Lancet. 1955;269:1–5. - PubMed
    1. Simmen HP, Blaser J. Analysis of pH and pO2 in abscesses, peritoneal fluid, and drainage fluid in the presence or absence of bacterial infection during and after abdominal surgery. Am. J. Surg. 1993;166:24–27. - PubMed
    1. Gallagher FA, et al. Magnetic resonance imaging of pH in vivo using hyperpolarized 13C-labelled bicarbonate. Nature. 2008;453:940–943. - PubMed
    1. Corbet C, Feron O. Tumour acidosis: from the passenger to the driver’s seat. Nat. Rev. Cancer. 2017;17:577–593. - PubMed
    1. Vander Heiden MG, Cantley LC, Thompson CB. Understanding the Warburg effect: the metabolic requirements of cell proliferation. Science. 2009;324:1029–1033. - PMC - PubMed

Publication types