. 2021 Dec 8;11(1):23612.
doi: 10.1038/s41598-021-02825-8.

Response triggering by an acoustic stimulus increases with stimulus intensity and is best predicted by startle reflex activation

Affiliations

Response triggering by an acoustic stimulus increases with stimulus intensity and is best predicted by startle reflex activation

Dana Maslovat et al. Sci Rep. .

Abstract

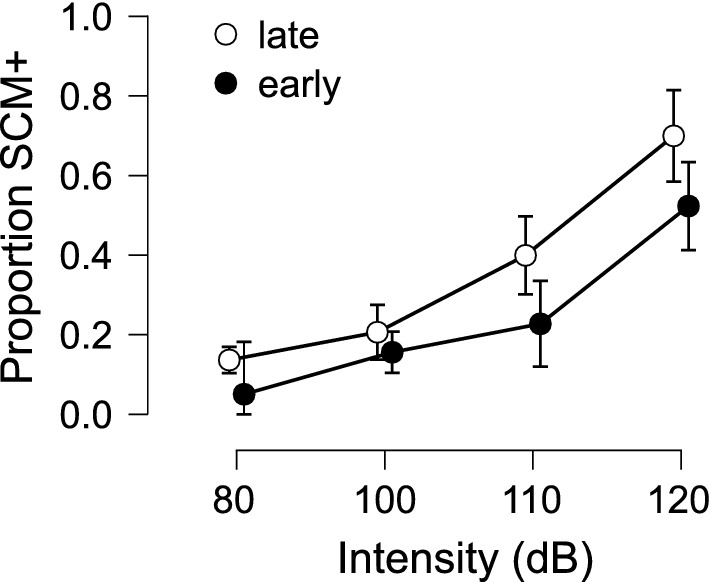
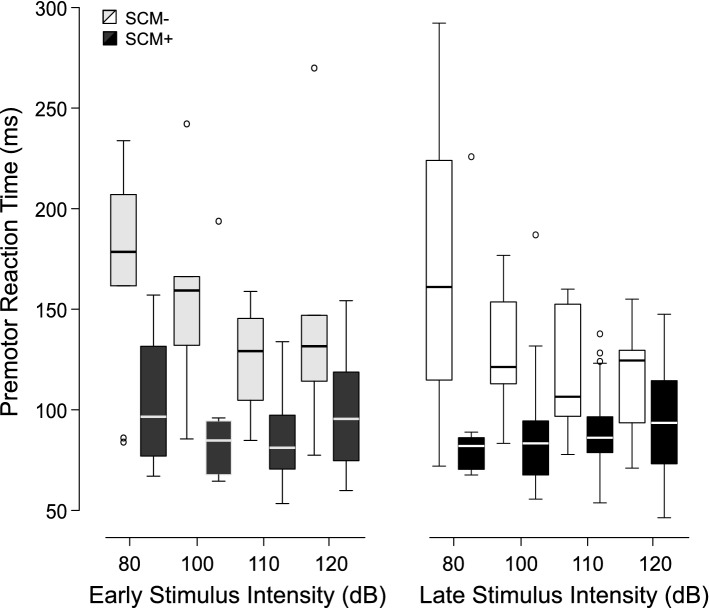
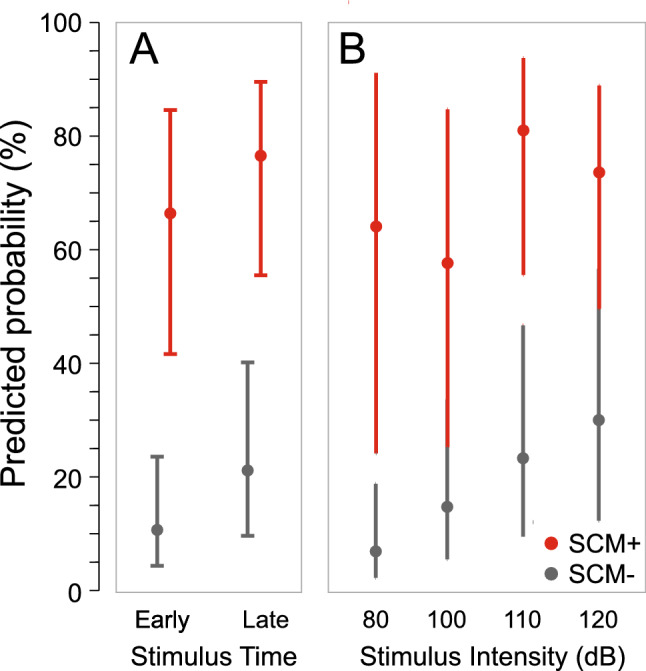
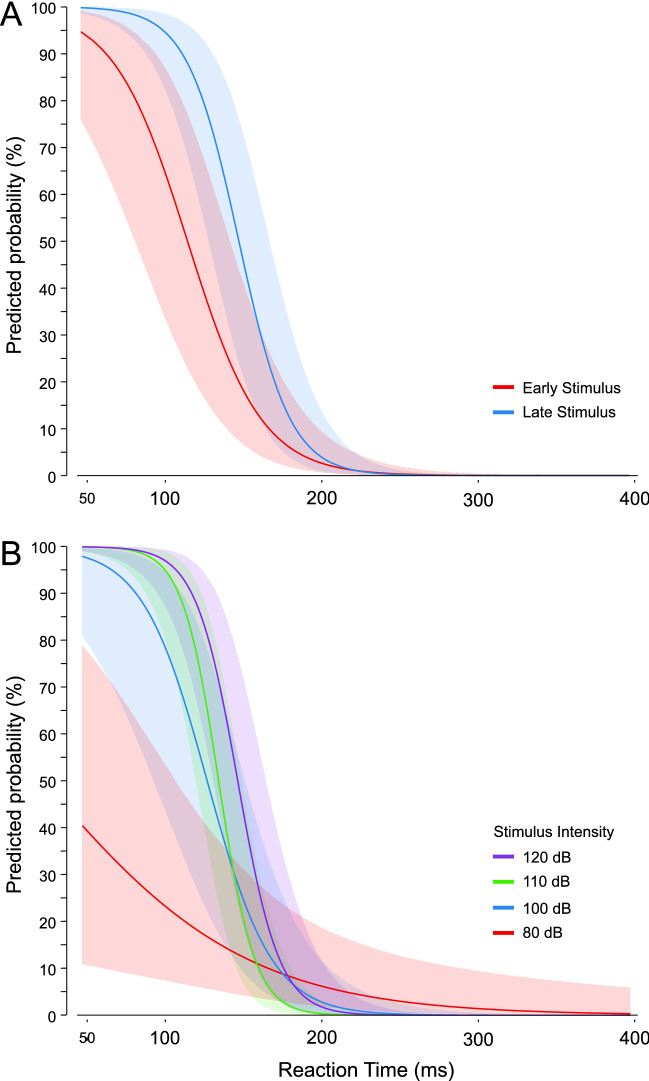
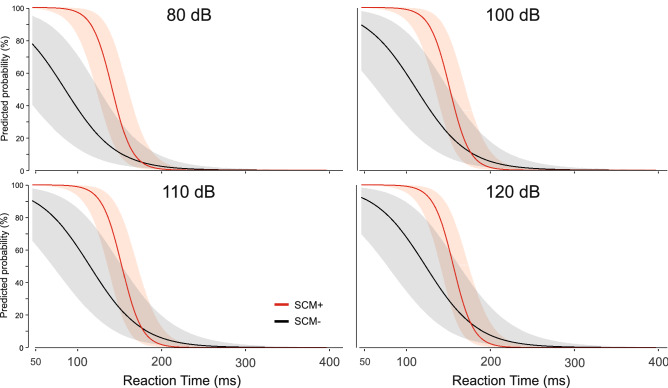
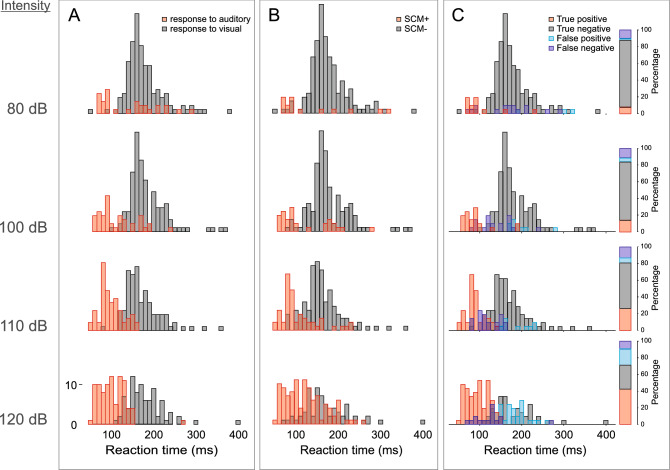
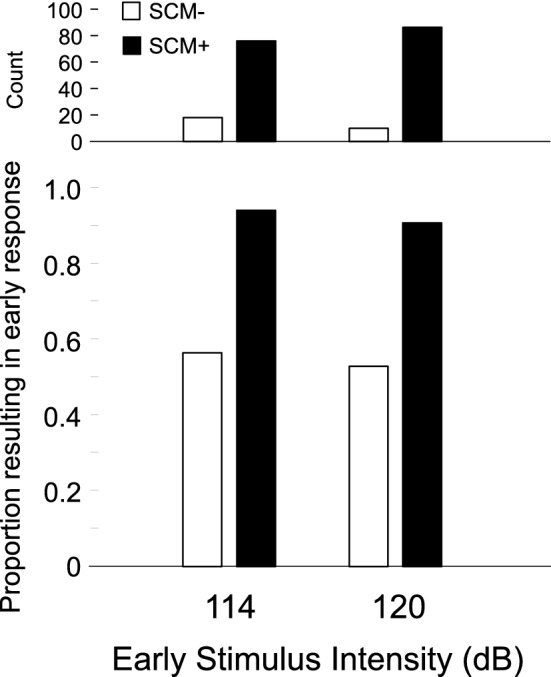
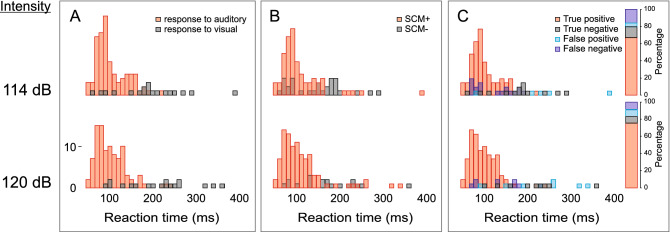
In a simple reaction time task, the presentation of a startling acoustic stimulus has been shown to trigger the prepared response at short latency, known as the StartReact effect. However, it is unclear under what conditions it can be assumed that the loud stimulus results in response triggering. The purpose of the present study was to examine how auditory stimulus intensity and preparation level affect the probability of involuntary response triggering and the incidence of activation in the startle reflex indicator of sternocleidomastoid (SCM). In two reaction time experiments, participants were presented with an irrelevant auditory stimulus of varying intensities at various time points prior to the visual go-signal. Responses were independently categorized as responding to either the auditory or visual stimulus and those with or without SCM activation (i.e., SCM+/-). Both the incidence of response triggering and proportion of SCM+ trials increased with stimulus intensity and presentation closer to the go-signal. Data also showed that participants reacted to the auditory stimulus at a much higher rate on trials where the auditory stimulus elicited SCM activity versus those that did not, and a logistic regression analysis confirmed that SCM activation is a reliable predictor of response triggering for all conditions.


Conflict of interest statement

The authors declare no competing interests.

Figures

Figure 1
Figure 1
Mean proportion (error bars: 95% CI) of auditory stimulus trials where a short latency burst of EMG activity was observed in the sternocleidomastoid muscle (SCM) as a function of stimulus intensity (dB) and time of stimulus presentation (early: − 1000 ms, black circles; late: − 300 ms, white circles) with respect to the visual go-signal.
Figure 2
Figure 2
Mean proportion (error bars: 95% CI) of auditory stimulus trials where the prepared response was triggered within 300 ms of the stimulus as a function of stimulus intensity (dB) and time of stimulus presentation (early: − 1000 ms, black circles; late: − 300 ms, white circles) with respect to the visual go-signal.
Figure 3
Figure 3
Proportion (bottom panels) and number (top panels) of trials where sternocleidomastoid (SCM) EMG activity was (SCM+, black/dark grey) or was not (SCM−, white/light grey) observed that resulted in triggering of the prepared response, as a function of stimulus intensity (dB) and time of stimulus presentation (early: − 1000 ms; late: − 300 ms). As not all participants showed SCM+ or SCM− for all conditions, the proportional data represents a grand mean across all participants.
Figure 4
Figure 4
Boxplots of premotor reaction time as a function of stimulus intensity (dB), time of stimulus presentation (early: − 1000 ms; late: − 300 ms), and whether sternocleidomastoid (SCM) EMG activity was (SCM+, black/dark grey) or was not (SCM−, white/light grey) observed. Box boundaries represent first and third quartiles, the horizontal line indicates the median, and error bars extend to the farthest data point within 1.5 times the interquartile range from the boundary. Small circles represent outlier data points.
Figure 5
Figure 5
Predicted probability (error bars: 95% CI) of observing the triggering of the prepared response for the individual predictors from the binomial generalized linear mixed model analysis. (A) shows probability based on stimulus presentation time (early: − 1000 ms; late: − 300 ms). (B) shows probability based on auditory stimulus intensity (dB). (C) shows probability based on whether sternocleidomastoid (SCM) EMG activity was (SCM+) or was not (SCM−) observed. (D) shows probability based on reaction time (ms).
Figure 6
Figure 6
Predicted probability (error bars: 95% CI) of observing the triggering of the prepared response based on whether sternocleidomastoid (SCM) EMG activity was (SCM+, red) or was not (SCM−, grey) observed as a function of stimulus presentation time (early: − 1000 ms; late: − 300 ms; A), or stimulus intensity (dB; B).
Figure 7
Figure 7
Predicted probability (error bars: 95% CI) of observing the triggering of the prepared response based on premotor reaction time (ms) as a function of stimulus presentation time (A; red: − 1000 ms; blue: − 300 ms), or stimulus intensity (B; red: 80 dB; blue: 100 dB; green: 110 dB; purple: 120 dB).
Figure 8
Figure 8
Predicted probability (error bars: 95% CI) of observing the triggering of the prepared response based on whether sternocleidomastoid (SCM) EMG activity was (SCM+, red) or was not (SCM−, grey) observed and premotor reaction time, separated by stimulus intensity (dB; separate panels). Note that models also include stimulus presentation time (early, late) as a factor but are collapsed across this factor for ease of presentation.
Figure 9
Figure 9
Histograms of premotor reaction time (RT) in 10 ms bins. (A) shows RT histograms as a function of stimulus intensity (arranged vertically) separated based on whether a response was made within 300 ms following the auditory stimulus (triggered, red) or made following the visual stimulus (not triggered, grey). (B) shows RT histograms as a function of stimulus intensity separated based on whether sternocleidomastoid (SCM) EMG activity was (SCM+, red) or was not (SCM−, grey) observed. (C) shows RT histograms as a function of whether the presence of SCM activity correctly predicted triggering (red: true positive; grey: true negative, blue: false positive; purple: false negative). The bar on the right of (C) also shows the percentage of RTs that fall into each of the aforementioned categories.
Figure 10
Figure 10
Proportion (bottom panel) and number (top panel) of trials where sternocleidomastoid (SCM) EMG activity was (SCM+, white) or was not (SCM−, black) observed that resulted in triggering of the prepared response, as a function of stimulus intensity (dB). As not all participants showed SCM+ or SCM− for all conditions, the proportional data represents a grand mean across all participants.
Figure 11
Figure 11
Boxplots of premotor reaction time as a function of stimulus intensity (dB), and whether sternocleidomastoid (SCM) EMG activity was (SCM+, black) or was not (SCM−, white) observed. Box boundaries represent first and third quartiles, the horizontal line indicates the median, and error bars extend to the farthest data point within 1.5 times the interquartile range from the boundary. Small circles represent outlier data points.
Figure 12
Figure 12
Histograms of premotor reaction time (RT) in 10 ms bins. (A) shows RT histograms as a function of stimulus intensity (arranged vertically) separated based on whether a response was made within 300 ms following the auditory stimulus (triggered, red) or made following the visual stimulus (not triggered, grey). (B) shows RT histograms as a function of stimulus intensity separated based on whether sternocleidomastoid (SCM) EMG activity was (SCM+, red) or was not (SCM−, grey) observed. (C) shows RT histograms as a function of whether the presence of SCM activity correctly predicted triggering (red: true positive; grey: true negative, blue: false positive; purple: false negative). The bar on the right of (C) also shows the percentage of RTs that fall into each of the aforementioned categories.

References

    1. Haith AM, Pakpoor J, Krakauer JW. Independence of movement preparation and movement initiation. J. Neurosci. 2016;36:3007–3015. doi: 10.1523/JNEUROSCI.3245-15.2016. - DOI - PMC - PubMed
    1. Klapp ST, Maslovat D. Preparation of action timing cannot be completed until immediately prior to initiation of the response to be controlled. Psychon. Bull. Rev. 2020;27:821–832. doi: 10.3758/s13423-020-01740-9. - DOI - PubMed
    1. Carlsen AN, Maslovat D, Franks IM. Preparation for voluntary movement in healthy and clinical populations: Evidence from startle. Clin. Neurophysiol. 2012;123:21–33. doi: 10.1016/j.clinph.2011.04.028. - DOI - PubMed
    1. Maslovat D, Klapp ST, Jagacinski RJ, Franks IM. Control of response timing occurs during the simple reaction time interval but on-line for choice reaction time. J. Exp. Psychol. Hum. Percept. Perform. 2014;40:2005–2021. doi: 10.1037/a0037522. - DOI - PubMed
    1. Maslovat D, Klapp ST, Forgaard CJ, Chua R, Franks IM. The effect of response complexity on simple reaction time occurs even with a highly predictable imperative stimulus. Neurosci. Lett. 2019;704:62–66. doi: 10.1016/j.neulet.2019.03.056. - DOI - PubMed

Publication types