. 2021 Dec 8;11(1):23656.
doi: 10.1038/s41598-021-03061-w.

Disturbance and distribution gradients influence resource availability and feeding behaviours in corallivore fishes following a warm-water anomaly

Affiliations

Disturbance and distribution gradients influence resource availability and feeding behaviours in corallivore fishes following a warm-water anomaly

Chancey MacDonald et al. Sci Rep. .

Abstract

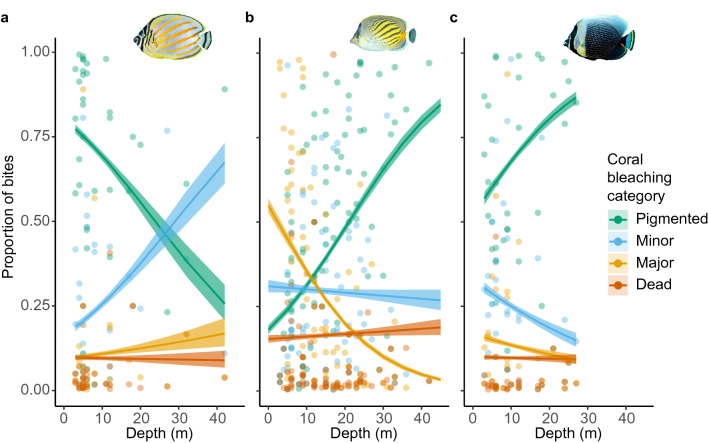
Understanding interactions between spatial gradients in disturbances, species distributions and species' resilience mechanisms is critical to identifying processes that mediate environmental change. On coral reefs, a global expansion of coral bleaching is likely to drive spatiotemporal pulses in resource quality for obligate coral associates. Using technical diving and statistical modelling we evaluated how depth gradients in coral distribution, coral bleaching, and competitor density interact with the quality, preference and use of coral resources by corallivore fishes immediately following a warm-water anomaly. Bleaching responses varied among coral genera and depths but attenuated substantially between 3 and 47 m for key prey genera (Acropora and Pocillopora). While total coral cover declined with depth, the cover of pigmented corals increased slightly. The abundances of three focal obligate-corallivore butterflyfish species also decreased with depth and were not related to spatial patterns in coral bleaching. Overall, all species selectively foraged on pigmented corals. However, the most abundant species avoided feeding on bleached corals more successfully in deeper waters, where bleaching prevalence and conspecific densities were lower. These results suggest that, as coral bleaching increases, energy trade-offs related to distributions and resource acquisition will vary with depth for some coral-associated species.


Conflict of interest statement

The authors declare no competing interests.

Figures

Figure 1
Figure 1
Differing levels of coral bleaching attenuation and health along a shallow to mesophotic depth gradient in Moorea, French Polynesia. (a) Variation in the proportion of severely bleached colonies (majority of colony white or with visible algae growing on recently bleached skeleton) among eight coral genera. (b) Matching site level depth variation in total coral cover (above) and cover of remaining pigmented corals (below). (c) The proportion of colonies remaining pigmented for the two primary prey genera of the focal fish species at the study location. (d) A research diver (Bart Shepherd) hovering over extensive coral bleaching during a decompression stop at a shallow study site. (e) Two of the focal fish species (Left: Chaetodon ornatissimus; Right: Chaetodon pelewensis) feeding on a bleached Pocillopora coral in shallow waters. Each line in (a) represents 1 of 2000 total draws in a Bayesian sampling model. In (b) and (c); red (site = Sofitel), blue (site = Rose Garden). Photos: Luiz Rocha.
Figure 2
Figure 2
The distributions of three obligate coral feeding butterflyfishes (aligned in rows) in relation the combined and isolated effects of water depth (0–50 m), total coral cover (0–80%) and pigmented coral cover (0–60%). The left column (a,e,i) shows butterflyfish densities along the depth gradient, without conditioning for the effects of coral cover and pigmented corals. The second column (b,f,j) shows butterflyfish density along the same depth gradient, after conditioning for the effects of coral cover gradients. In this column, (f) shows a significant interaction between depth and total coral cover (i.e., regardless of bleaching condition), with the later held constant at 5% (red), 30% (pink), and 60% (blue). The third column (c,g,k) shows the effects of total coral cover isolated from depth and pigmented coral cover. In this column, (g) shows an interaction with depth held constant at shallow (3 m — green), intermediate (15 m — blue) and upper mesophotic (30 m — orange) depths. The final column (d,h,l) shows the effects of pigmented coral cover after conditioning on coral cover and depth effects. NS signifies non-supported hypotheses, which are further highlighted with dashed mean-effect lines and greyed-out confidence intervals. See Supplemental Fig. S7 for more information about conditioning on covariates to isolate main effects.
Figure 3
Figure 3
Feeding selectivity and avoidance behaviours in relation to four levels of coral bleaching, for three obligate corallivorous butterflyfishes in Mo’orea, French Polynesia. Feeding preferences across all depths for all three species (a) and contrasts of feeding preferences among depths for each species (bd). Corn = Chaetodon ornatissimus (b), Cpel = Chaetodon pelewensis (c), Cret = Chaetodon reticulatus (d). Resource selection measures (metric = w^i) with confidence intervals spanning values wholly > 1 indicate resource selectivity (i.e., resource use is high relative its environmental availability), values spanning wholly < 1 indicated resource avoidance, and values containing resource avoidance, and values containing 1 indicate resource use is proportional to availability.
Figure 4
Figure 4
The proportion of bites taken from coral colonies of varying health, along a shallow-mesophotic depth gradient for three obligate corallivore butterflyfish species; (a) Chaetodon ornatissimus, (b) Chaetodon pelewensis, and (c) Chaetodon reticulatus.
Figure 5
Figure 5
(a) Counterfactual plots showing the predicted effects of increasing conspecific density (1–10 conspecific individuals 40 m−2) on the probability of C. pelewensis feeding on a bleached coral colony (in any given bite) at each of two depths (5 m, 30 m) when the proportion of bleached coral colonies is held at each of seven fixed values (10–70%). (a) The odds ratios of effects for the three (standardized) predictors used in the model that the counter factual plots are built from. In (b-h), the gradated fills represent the 60%, 80% and 95% compatibility intervals (posterior mass) for each prediction. In (a), these same three intervals are shown with decreasing thickness of the three stacked error bars for each predictor. An odds ratio of 1 (indicated in (a) by the vertical dashed line) indicates no change in the odds of feeding on a bleached coral as the value of the predictor increases.

References

    1. Jentsch A, White P. A theory of pulse dynamics and disturbance in ecology. Ecology. 2019;100:e02734. - PMC - PubMed
    1. Stuart-Smith RD, Brown CJ, Ceccarelli DM, Edgar GJ. Ecosystem restructuring along the Great Barrier Reef following mass coral bleaching. Nature. 2018;560:92–96. - PubMed
    1. Trisos CH, Merow C, Pigot AL. The projected timing of abrupt ecological disruption from climate change. Nature. 2020;580:496–501. - PubMed
    1. Blowes SA, et al. The geography of biodiversity change in marine and terrestrial assemblages. Science. 2019;366:339–345. - PubMed
    1. Schwartz MW, et al. Increasing elevation of fire in the Sierra Nevada and implications for forest change. Ecosphere. 2015;6:art121.

Publication types