. 2021 Dec 8;11(1):23680.
doi: 10.1038/s41598-021-03132-y.

Ectomycorrhizal fungus supports endogenous rhythmic growth and corresponding resource allocation in oak during various below- and aboveground biotic interactions

Affiliations

Ectomycorrhizal fungus supports endogenous rhythmic growth and corresponding resource allocation in oak during various below- and aboveground biotic interactions

Mika T Tarkka et al. Sci Rep. .

Abstract

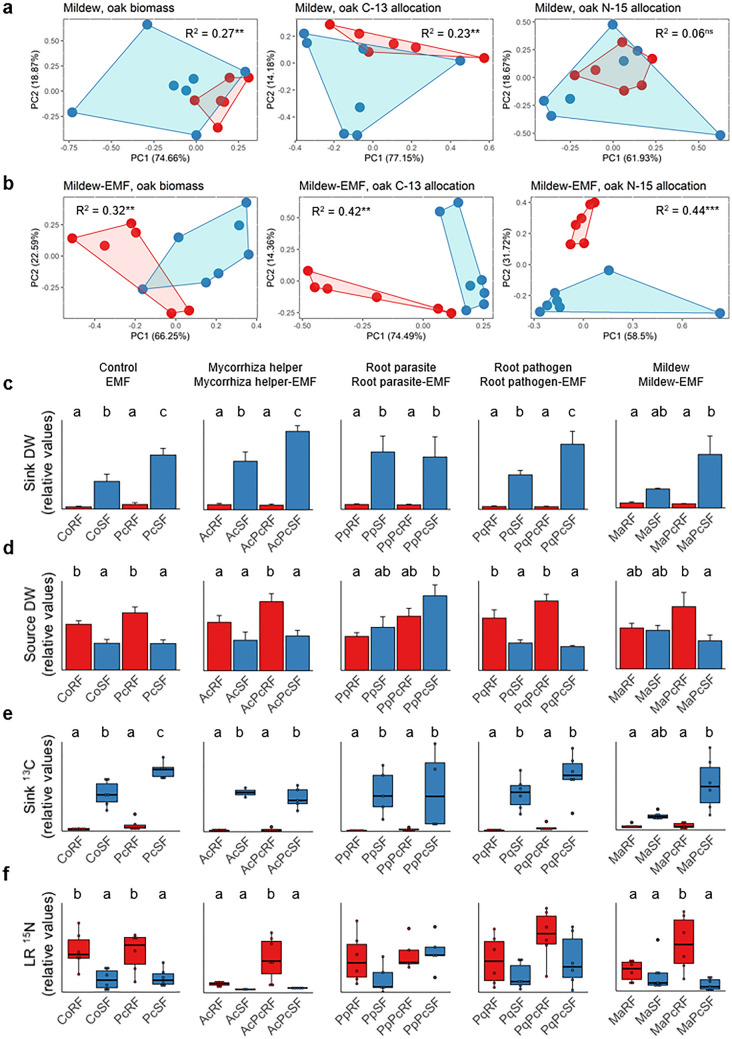
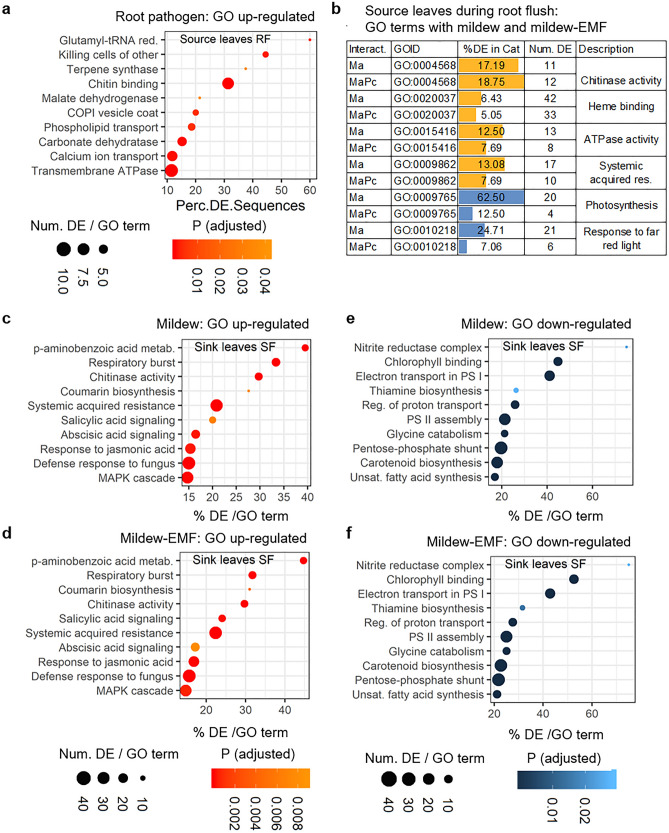
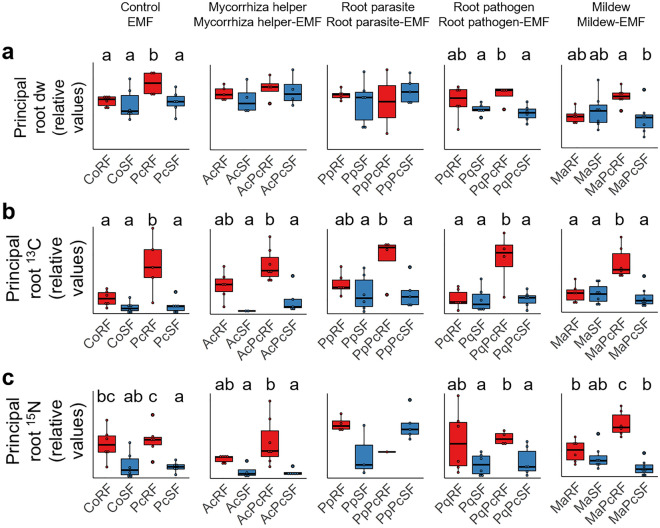
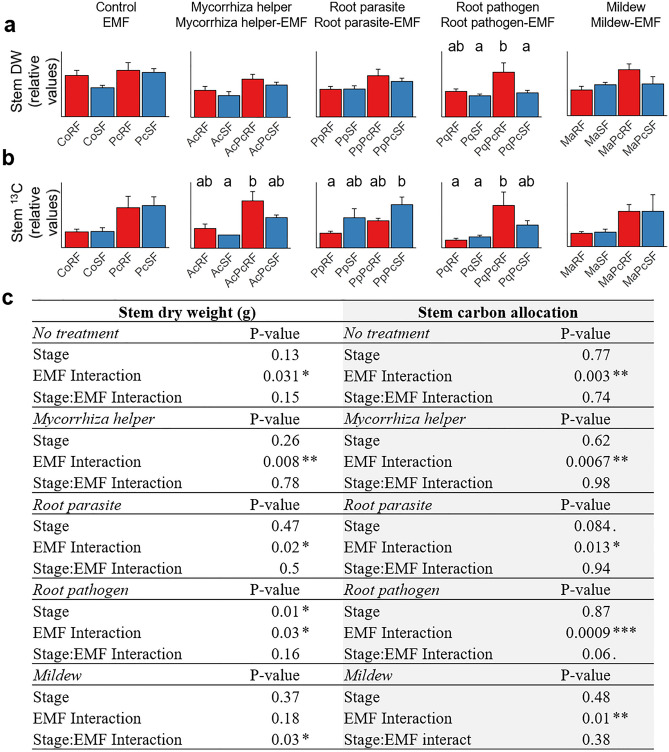
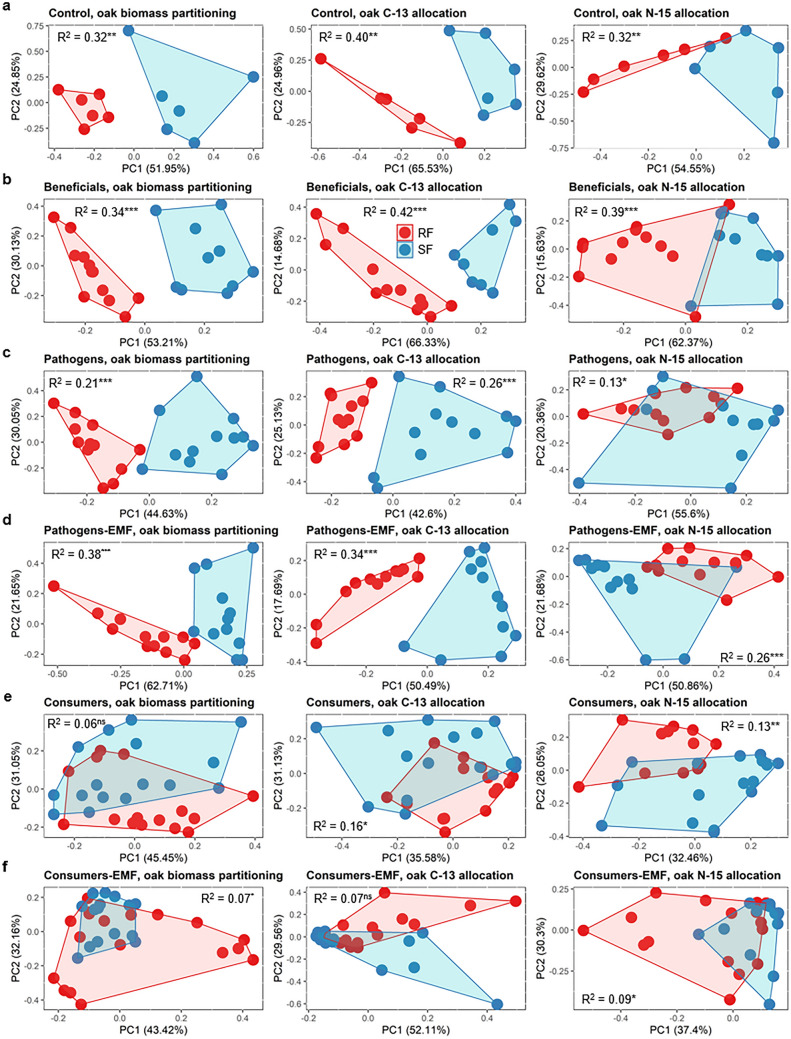
Endogenous rhythmic growth (ERG) is displayed by many tropical and some major temperate tree species and characterized by alternating root and shoot flushes (RF and SF). These flushes occur parallel to changes in biomass partitioning and in allocation of recently assimilated carbon and nitrogen. To address how biotic interactions interplay with ERG, we cross-compared the RF/SF shifts in oak microcuttings in the presence of pathogens, consumers and a mycorrhiza helper bacterium, without and with an ectomycorrhizal fungus (EMF), and present a synthesis of the observations. The typical increase in carbon allocation to sink leaves during SF did not occur in the presence of root or leaf pathogens, and the increase in nitrogen allocation to lateral roots during RF did not occur with the pathogens. The RF/SF shifts in resource allocation were mostly restored upon additional interaction with the EMF. Its presence led to increased resource allocation to principal roots during RF, also when the oaks were inoculated additionally with other interactors. The interactors affected the alternating, rhythmic growth and resource allocation shifts between shoots and roots. The restoring role of the EMF on RF/SF changes in parallel to the corresponding enhanced carbon and nitrogen allocation to sink tissues suggests that the EMF is supporting plants in maintaining the ERG.


Conflict of interest statement

The authors declare no competing interests.

Figures

Figure 1
Figure 1
Developmental stage dependent distribution of biomass and resource allocation in oak with biotic interactions. (a, b) Principal components analysis of the combined variables of sink and source leaves, stems, principal and lateral roots in mildew treatment (Ma) and in mildew and additional mycorrhizal fungal treatment (MaPc) during root flush (RF) and shoot flush (SF). Each symbol represents the total distribution of resources in an oak individual. Data points for each group are enclosed with a line, and red colour marks RF and blue colour marks SF. Based on a permutational multivariate analysis of variance, R-squared (R2) represents the proportion of the variance that's explained by growth stage, and asterisks indicate significant differences between the growth stages at the significance levels ***(P < 0.001); **(P < 0.01); *(P < 0.05); ns (not significant). (cf) Extent of biomass, recently fixed carbon and nitrogen (excess of 13C and excess of 15N) to the organs of oak during root and shoot flush in oak microcuttings engaged in biotic interactions. For the purpose of simplicity, relative values are shown here, and absolute values are given in Supplementary Fig. S3. Only those plant organs are shown, where the extent of resources changed from root flush to shoot flush in controls. Different letters indicate a significant difference according to ANOVA and Tukey HSD test (P < 0.05). The boxplots include a line marking the median, middle box representing the middle 50% of scores for each treatment, as well as whiskers and dots representing the scores outside and strongly deviating from the middle 50% of the scores. Please refer to Supplementary Table S4 for the values of difference. Where no lettering is included, the treatments were not different to each other. DW, dry weight; 13C, allocation of C-13; 15N, allocation of N-15; RF, root flush; SF, shoot flush; Pc, Piloderma croceum, Ac, Streptomyces sp. AcH505; AcPc = Streptomyces sp. AcH505 and Piloderma croceum; Pp, Pratylenchus penetrans, Pq, Phytophthora quercina; Ma, Microsphaera alphitoides.
Figure 2
Figure 2
Interaction type dependent changes in the enrichment of Gene Ontology terms. Gene Ontology (GO) terms enriched in up- (orange) or down-regulated (blue) genes at the adjusted significance level of FDR < 0.05 from sink leaves during shoot flush (SF) and source leaves during root flush (RF). (a) Source leaves during RF with root pathogen (Pq) Phytophthora quercina and (b) with mildew (Ma) Microsphaera alphitoides or mildew and ectomycorrhizal fungus (EMF) Piloderma croceum. (c, e) Sink leaves during SF with mildew, and (d, f), with mildew and EMF. Dot plots visualise the enrichment level as the percentage of differentially expressed genes in a GO category (dot position) and as the level of significance (dot colour). Bars visualise the enrichment level as the percentage of differentially expressed sequences in a GO category (bar length).
Figure 3
Figure 3
Rhythmic pattern of biomass partitioning and resource allocation is elicited by the ectomycorrhizal fungus in pedunculate oak principal roots. (a) Extent of biomass (g dry weight), (b) recently fixed carbon (excess of 13C), and (c) recently fixed nitrogen (excess of 15N) to the organs of oak during root and shoot flush in oak microcuttings engaged in biotic interactions. For the purpose of simplicity, relative values are shown here, and absolute values are given in Supplementary Fig. S3. Red colour marks RF and blue colour marks SF, and different letters indicate a significant difference according to linear model, ANOVA and Tukey’s test, at the significance level P < 0.05. Please refer to Supplementary Table S4 for the corresponding values. Where no lettering is included, the treatments were not different to each other. DW, dry weight; 13C, allocation of C-13; 15N, allocation of N-15; RF, root flush; SF, shoot flush; Pc, Piloderma croceum, Ac, Streptomyces sp. AcH505; Pp, Pratylenchus penetrans, Pq, Phytophthora quercina; Ma, Microsphaera alphitoides.
Figure 4
Figure 4
Effect of the ectomycorrhizal fungus on stem biomass and carbon allocation. (a) Stem biomass (g dry weight). (b) Carbon allocation to stem (13C excess). Different letters indicate a significant difference according to linear model, ANOVA and Tukey’s test, at the significance level P < 0.05. For the purpose of simplicity, relative values are shown here, and absolute values are given in Supplementary Fig. S3. (c) Effect of the EMF on biomass partitioning to stems. Data were analysed by linear model and the relative effects and the interaction between growth stage (RF/SF) and EMF (no/yes) were assessed by using two-way ANOVA. DW, dry weight; 13C, allocation of C-13; RF, root flush; SF, shoot flush; Pc, Piloderma croceum, Ac, Streptomyces sp. AcH505; Pp, Pratylenchus penetrans, Pq, Phytophthora quercina; Ma, Microsphaera alphitoides.
Figure 5
Figure 5
Growth stage dependent distribution of biomass and resource allocation in oak: Summary. Principal components analysis of the combined variables of sink and source leaves, stems, principal and lateral roots: biomass (dry weight), carbon allocation (13C excess) and nitrogen allocation (15N excess). Treatments comprise (a) control treatment, (b) EMF and mycorrhiza helper (beneficials), (c) root pathogen and mildew (pathogens), and with additional EMF (d), (e) root parasite, springtail and leaf herbivore (consumers), and with additional EMF (f). Springtail (Protaphorura armata) and Springtail-EMF data were obtained from Graf et al. (2019) and leaf herbivore (Lymantria dispar) and leaf herbivore-EMF data from Bacht et al. (2019). Each symbol represents the total distribution of biomass or resource allocation in an oak individual. Data points for each group are enclosed with a line, and red colour marks RF and blue colour marks SF. Based on a permutational multivariate analysis of variance, R-squared (R2) represents the proportion of the variance that's explained by growth stage, and asterisks indicate significant differences between the growth stages at the significance levels ***(P < 0.001); **(P < 0.01); *(P < 0.05); ns (not significant).

References

    1. Coley PD, Bryant JP, Chapin FS. Resource availability and plant antiherbivore defense. Science. 1985;230:895–899. - PubMed
    1. Schultz JC, Appel HM, Ferrieri AP, Arnold TM. Flexible resource allocation during plant defence responses. Front. Plant Sci. 2013;4:324. - PMC - PubMed
    1. Schaarschmidt S, Roitsch T, Hause B. Arbuscular mycorrhiza induces gene expression of the apoplastic invertase LIN6 in tomato (Lycopersicon esculentum) roots. J. Exp. Bot. 2006;57:4015–4023. - PubMed
    1. Bancal MO, Hansart A, Sache I, Bancal P. Modelling fungal sink competitiveness with grains for assimilates in wheat infected by a biotrophic pathogen. Ann. Bot. 2012;110:113–123. - PMC - PubMed
    1. Schwachtje, J., Minchin, P.E.H., Jahnke, S., van Dongen, J.T., Schittko, U. & Baldwin IT. SNF1-related kinases allow plants to tolerate herbivory by allocating carbon to roots. Proc. Natl. Acad. Sci. USA103, 12935–12940 (2006). - PMC - PubMed

Publication types