. 2021 Dec;53(12):1888-1901.
doi: 10.1038/s12276-021-00714-8. Epub 2021 Dec 8.

Single-cell RNA sequencing reveals B cell-related molecular biomarkers for Alzheimer's disease

Affiliations

Single-cell RNA sequencing reveals B cell-related molecular biomarkers for Alzheimer's disease

Liu-Lin Xiong et al. Exp Mol Med. 2021 Dec.

Abstract

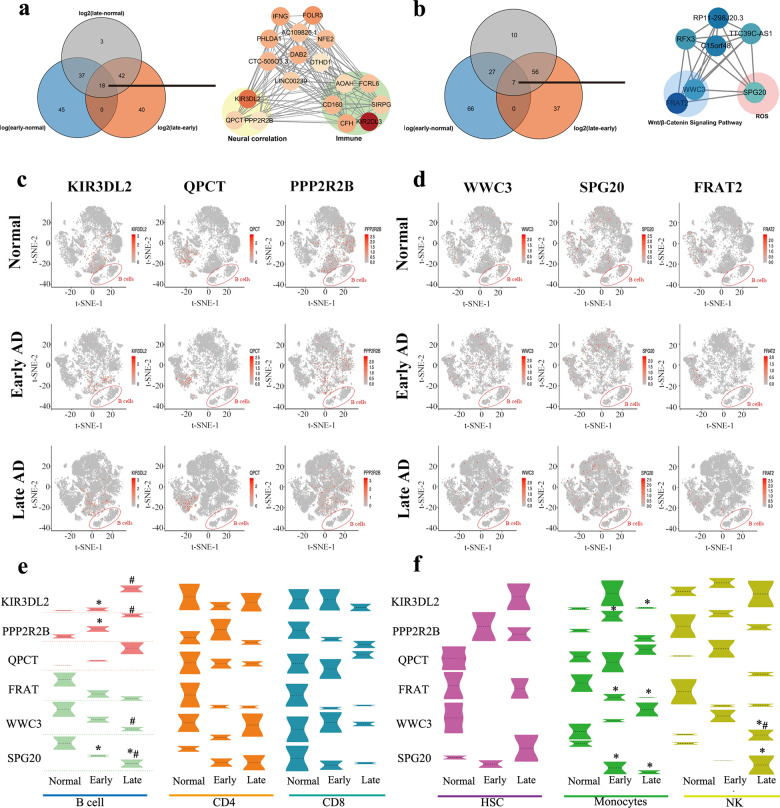
In recent years, biomarkers have been integrated into the diagnostic process and have become increasingly indispensable for obtaining knowledge of the neurodegenerative processes in Alzheimer's disease (AD). Peripheral blood mononuclear cells (PBMCs) in human blood have been reported to participate in a variety of neurodegenerative activities. Here, a single-cell RNA sequencing analysis of PBMCs from 4 AD patients (2 in the early stage, 2 in the late stage) and 2 normal controls was performed to explore the differential cell subpopulations in PBMCs of AD patients. A significant decrease in B cells was detected in the blood of AD patients. Furthermore, we further examined PBMCs from 43 AD patients and 41 normal subjects by fluorescence activated cell sorting (FACS), and combined with correlation analysis, we found that the reduction in B cells was closely correlated with the patients' Clinical Dementia Rating (CDR) scores. To confirm the role of B cells in AD progression, functional experiments were performed in early-stage AD mice in which fibrous plaques were beginning to appear; the results demonstrated that B cell depletion in the early stage of AD markedly accelerated and aggravated cognitive dysfunction and augmented the Aβ burden in AD mice. Importantly, the experiments revealed 18 genes that were specifically upregulated and 7 genes that were specifically downregulated in B cells as the disease progressed, and several of these genes exhibited close correlation with AD. These findings identified possible B cell-based AD severity, which are anticipated to be conducive to the clinical identification of AD progression.


Conflict of interest statement

The authors declare no competing interests.

Figures

Fig. 1
Fig. 1. Heterogeneity of PBMC population analysis by single-cell RNA-seq.
a MRI scanning images of the brains of a normal person and a representative late AD patient. b The number of single cells in each sample captured by single-cell RNA-seq 10X genomics. c The violin plot shows the gene number of each sample. d Pearson’s correlation plot visualizing the correlation (r) values between samples. N1, Normal-1; N2, Normal-2; EA1, Early AD-1; EA2, Early AD-2; LA1, Late AD-1; LA2, Late AD-2.
Fig. 2
Fig. 2. Verification of the differences in cell subsets of PBMCs in AD patients.
a Heat map of differentially expressed genes in samples from AD patients and normal controls and (b) KEGG analysis of pathways involved in upregulated genes and downregulated genes. c t-SNE shows the top 6 cell subsets in all samples and (d) quantification of the proportion of cells in each sample. e, f The t-SNE map shows the different distribution of 6 clusters in normal, early AD, and late AD patients. The data were presented as the mean. The heatmap was generated by the pheatmap R package, and the rows were clustered. Pearson distance measurement assigns values to the clustering rows. The bubble diagram was generated by the ggplot R package. The color of the bubbles varies from red to green. The redder the bubbles are, the greater the -log10(p value), that is, the smaller the p value. The larger the bubble is, the more genes are enriched. N1, Normal-1; N2, Normal-2; EA1, Early AD-1; EA2, Early AD-2; LA1, Late AD-1; LA2, Late AD-2.
Fig. 3
Fig. 3. Gene expression profiles of cell subpopulations of PBMCs in AD patients.
a Heat map of changes in the RNA expression of upregulated and downregulated genes in the top 6 cell types in normal people and early and late AD patients. N values below the cell names represent the cell counting results. b The gene expression changes trends of upregulated and downregulated genes in 6 different cell types. c KEGG pathway analysis of upregulated genes in 6 cell types. The heatmap was generated by the pheatmap R package, and the rows were clustered. Pearson distance measurement assigns values to the clustering rows. The line chart was generated by the ggplot R package. The bar chart of KEGG analysis was made by the hist function of R language in accordance with the -log10 (p value).
Fig. 4
Fig. 4. Differential gene expression profiles in B cells.
Venn diagram of (a) upregulated and (b) downregulated genes in different cell types. The specifically (c) upregulated and (d) downregulated genes in B cells and significant alterations in B cells revealed by the circular heat map. e, f PBMCs of 43 AD patients and 41 normal subjects were harvested and subjected to flow cytometry with a panel of T cell, B cell and NK cell marker monoclonal antibodies. g The positive cell numbers of T cells, B cells and NK cells (mean ± SEM). hj Correlation analysis of CDR with the number of T cells, B cells and NK cells. The Venn diagram and Circosheatmap were generated by TBtool.
Fig. 5
Fig. 5. Functional verification of B cells in AD mice.
a The time spent and the number of rearing in the mice from the WT, AD + PBS and AD + BCDT groups. b The latency to target, c, e the motion trail at 5th day and 6th day of mice from WT, AD + PBS and AD + BCDT groups in Morris water maze. d The distance traveled and (f) the number of target crossings in mice of three groups. g The alteration rate, the time spent in the novel arm and the novel arm entry rate of mice in the three groups in the Y-maze. WT wild-type (mice), BCDT B cell depletion treated.
Fig. 6
Fig. 6. The effect of B cell depletion on Aβ deposition.
a Histological images of Aβ plaque distribution in the brain among the WT, AD + PBS and AD + BCDT groups. Scale bar = 20 μm and 50 μm. b Quantification data including integrated optical density (IOD) of Aβ plaque, the number of plaques and the area of plaques in WT, AD + PBS and AD + BCDT groups. c The distribution of Aβ plaques in the hippocampus (CA1, CA2, CA3, DG) among the three groups. Scale bar = 100 μm and 400 μm. d The IOD, amount and area of Aβ plaques in the four regions of the hippocampus among the three groups. WT, wild-type (mice); BCDT, B cell depletion treated.
Fig. 7
Fig. 7. The identification and verification of specific genes.
a Venn diagram of the top 100 upregulated genes with the highest fold change among normal people and patients at different stages of AD (left) and interactive relationships among the 18 overlapping genes by Cytoscape (right). The darker the red color is, the greater the fold change in expression in the late-stage group, and the more significant the upregulation of genes. b Venn diagram of the top 100 downregulated genes with the highest fold change among normal people and patients at different stages of AD (left) and interactive relationship among the 7 overlapping genes by Cytoscape (right). The darker the blue color is, the greater the fold change in expression in the late-stage group, and the more significant the downregulation of genes. c The t-SNE map shows the expression variation of three specifically upregulated genes in B cells at normal, early, and late stages of AD. d The t-SNE map shows the expression variation of three specifically downregulated genes in B cells at normal, early, and late stages of AD (mean ± SEM). e, f Violin plots showing the expression variation of KIR3DL2, PPP2R2B, QPCT, FRAT2, WWC3 and SPG20 in 6 types of cells (B cells, CD4, CD8, HSCs, monocytes and NK cells) in normal controls and patients with early and late stages of AD. *p < 0.05 vs. normal group, #p < 0.05 vs. early AD group.

References

    1. Hogh P. Alzheimer’s disease. Ugeskr. Laege. 2017;179:V09160686. - PubMed
    1. Atkinson SP. Alzheimer’s disease: a special collection. Stem Cells Transl. Med. 2017;6:1951–1955. - PMC - PubMed
    1. Briggs R, Kennelly SP, O’Neill D. Drug treatments in Alzheimer’s disease. Clin. Med (Lond.). 2016;16:247–253. - PMC - PubMed
    1. Chioua M, et al. Synthesis, biological assessment and molecular modeling of racemic QuinoPyranoTacrines for Alzheimer’s Disease Therapy. Chem. Sel. 2018;3:461–466.
    1. Van G-BM, et al. Correction: metabolic changes and inflammation in cultured astrocytes from the 5xFAD mouse model of Alzheimer’s disease: alleviation by pantethine. PLos One. 2018;13:e0194586. - PMC - PubMed

Publication types