. 2021 Dec;600(7889):494-499.
doi: 10.1038/s41586-021-04183-x. Epub 2021 Dec 8.

Exercise plasma boosts memory and dampens brain inflammation via clusterin

Affiliations

Exercise plasma boosts memory and dampens brain inflammation via clusterin

Zurine De Miguel et al. Nature. 2021 Dec.

Abstract

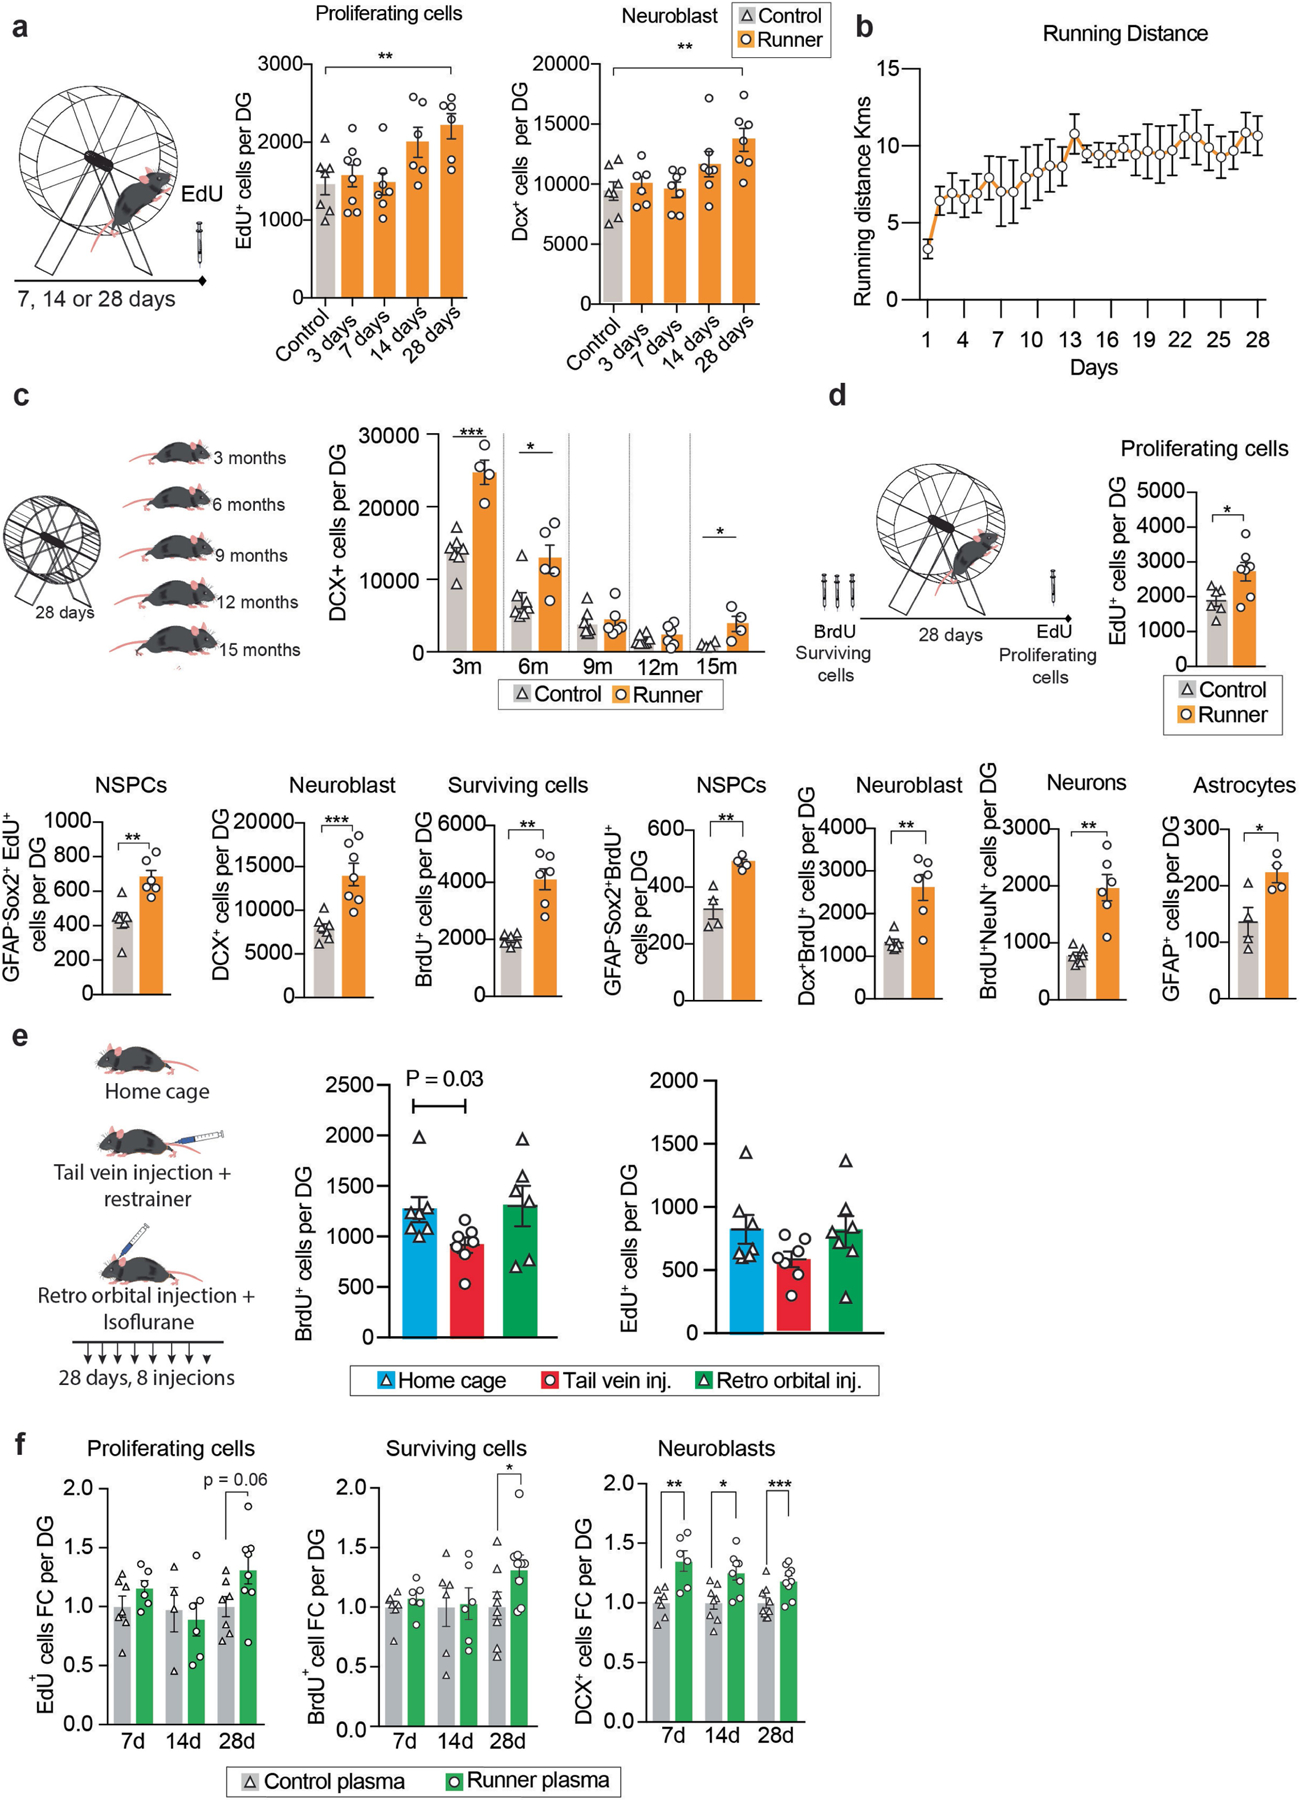
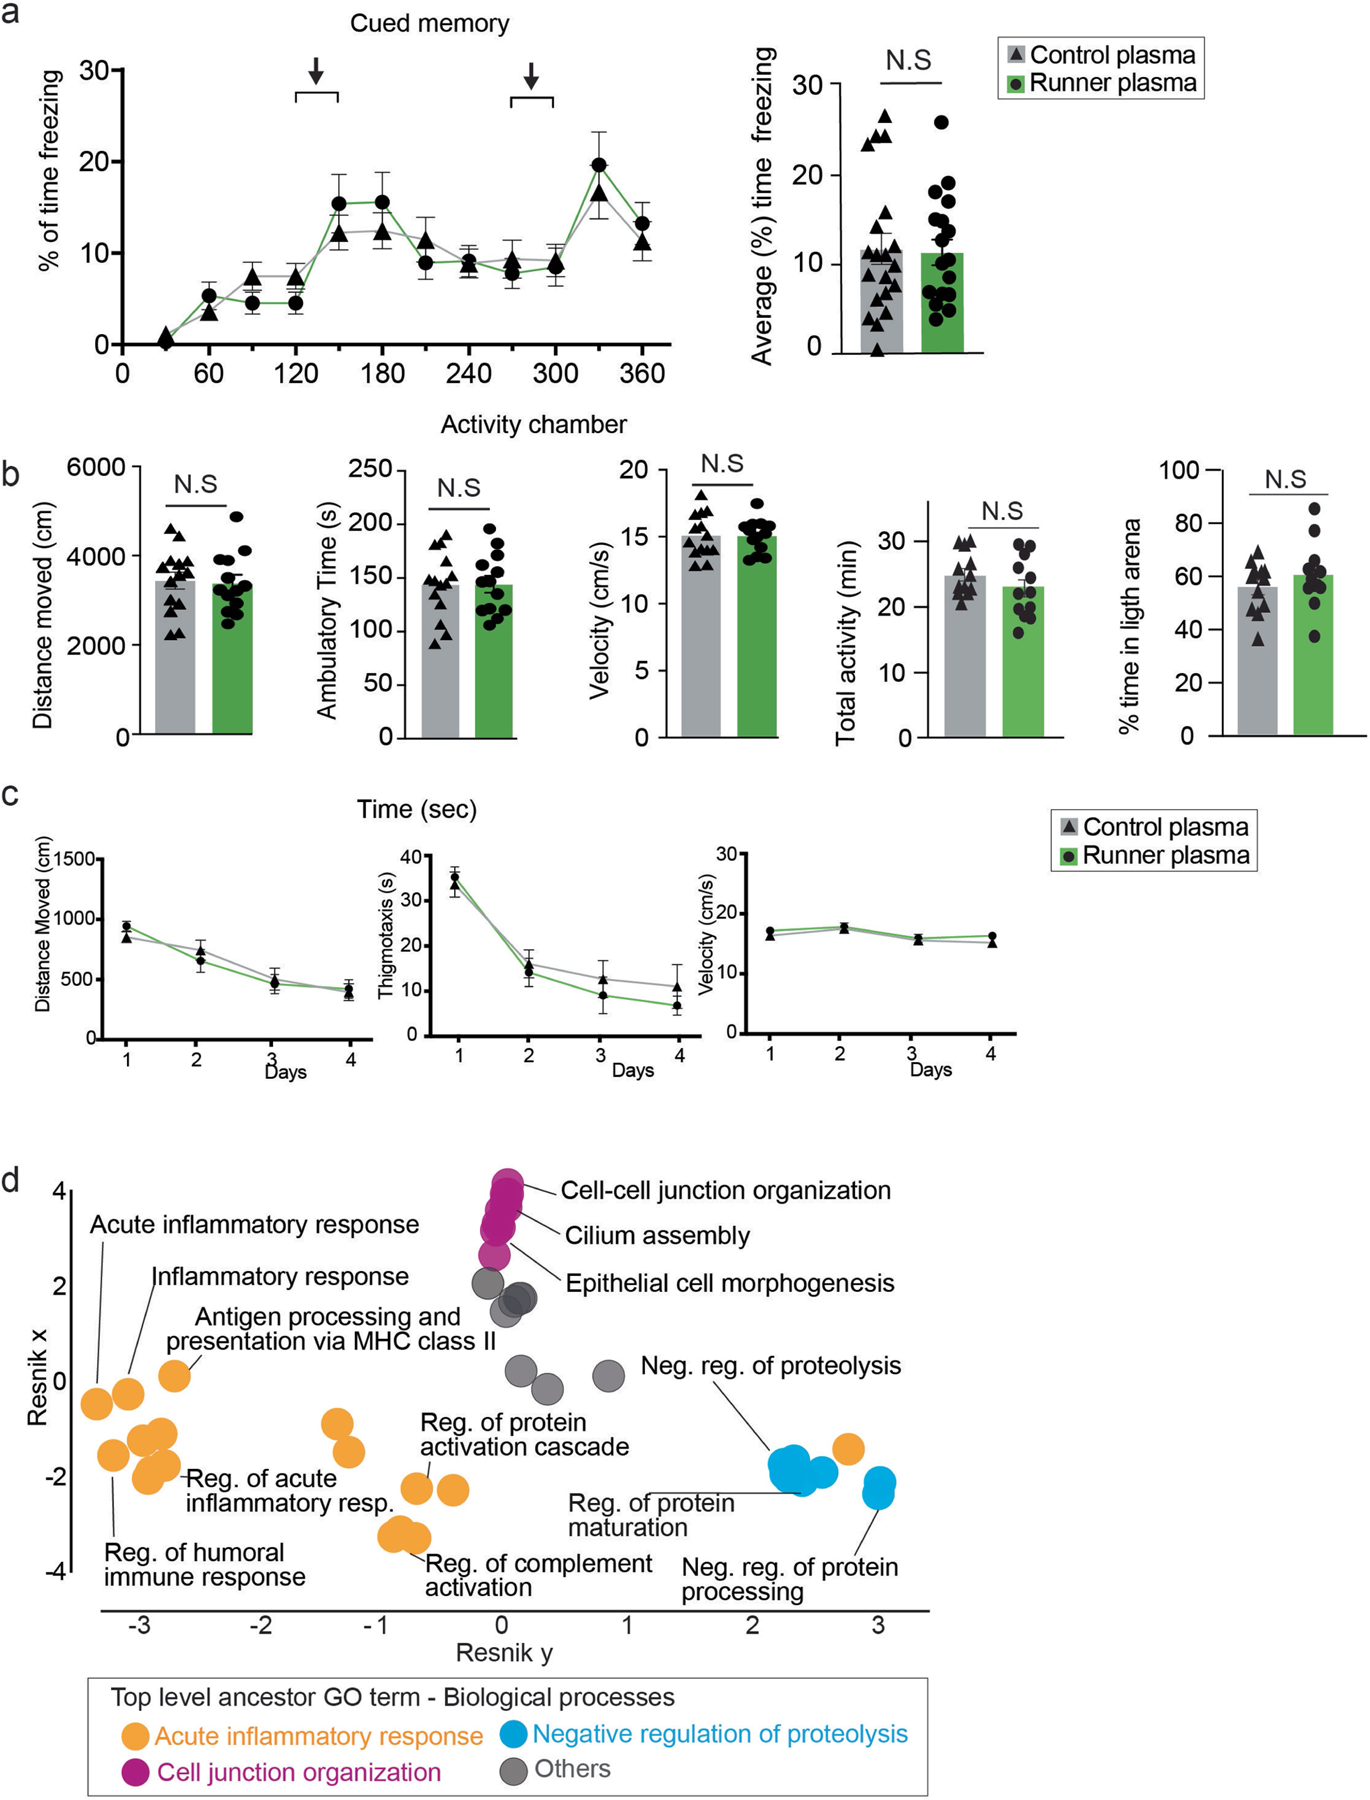
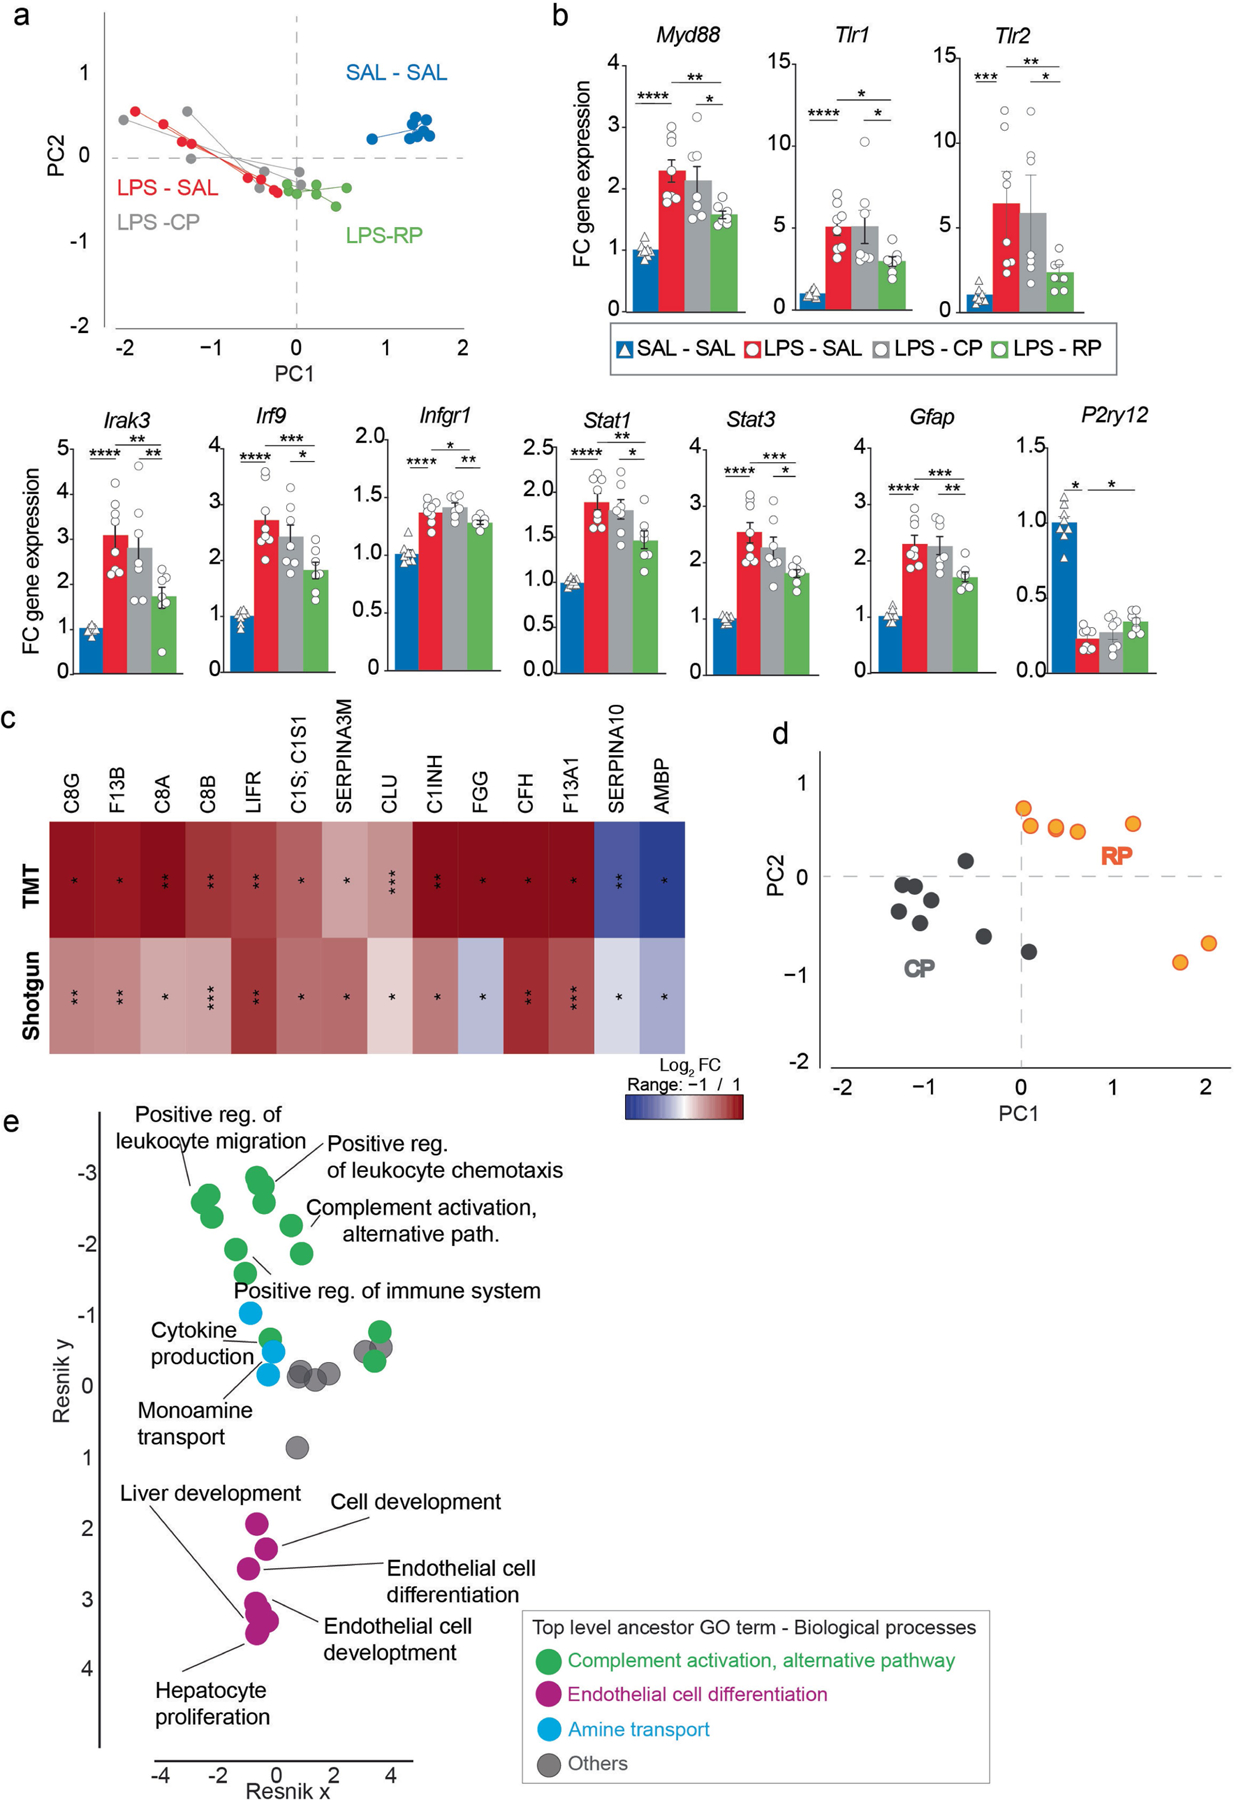
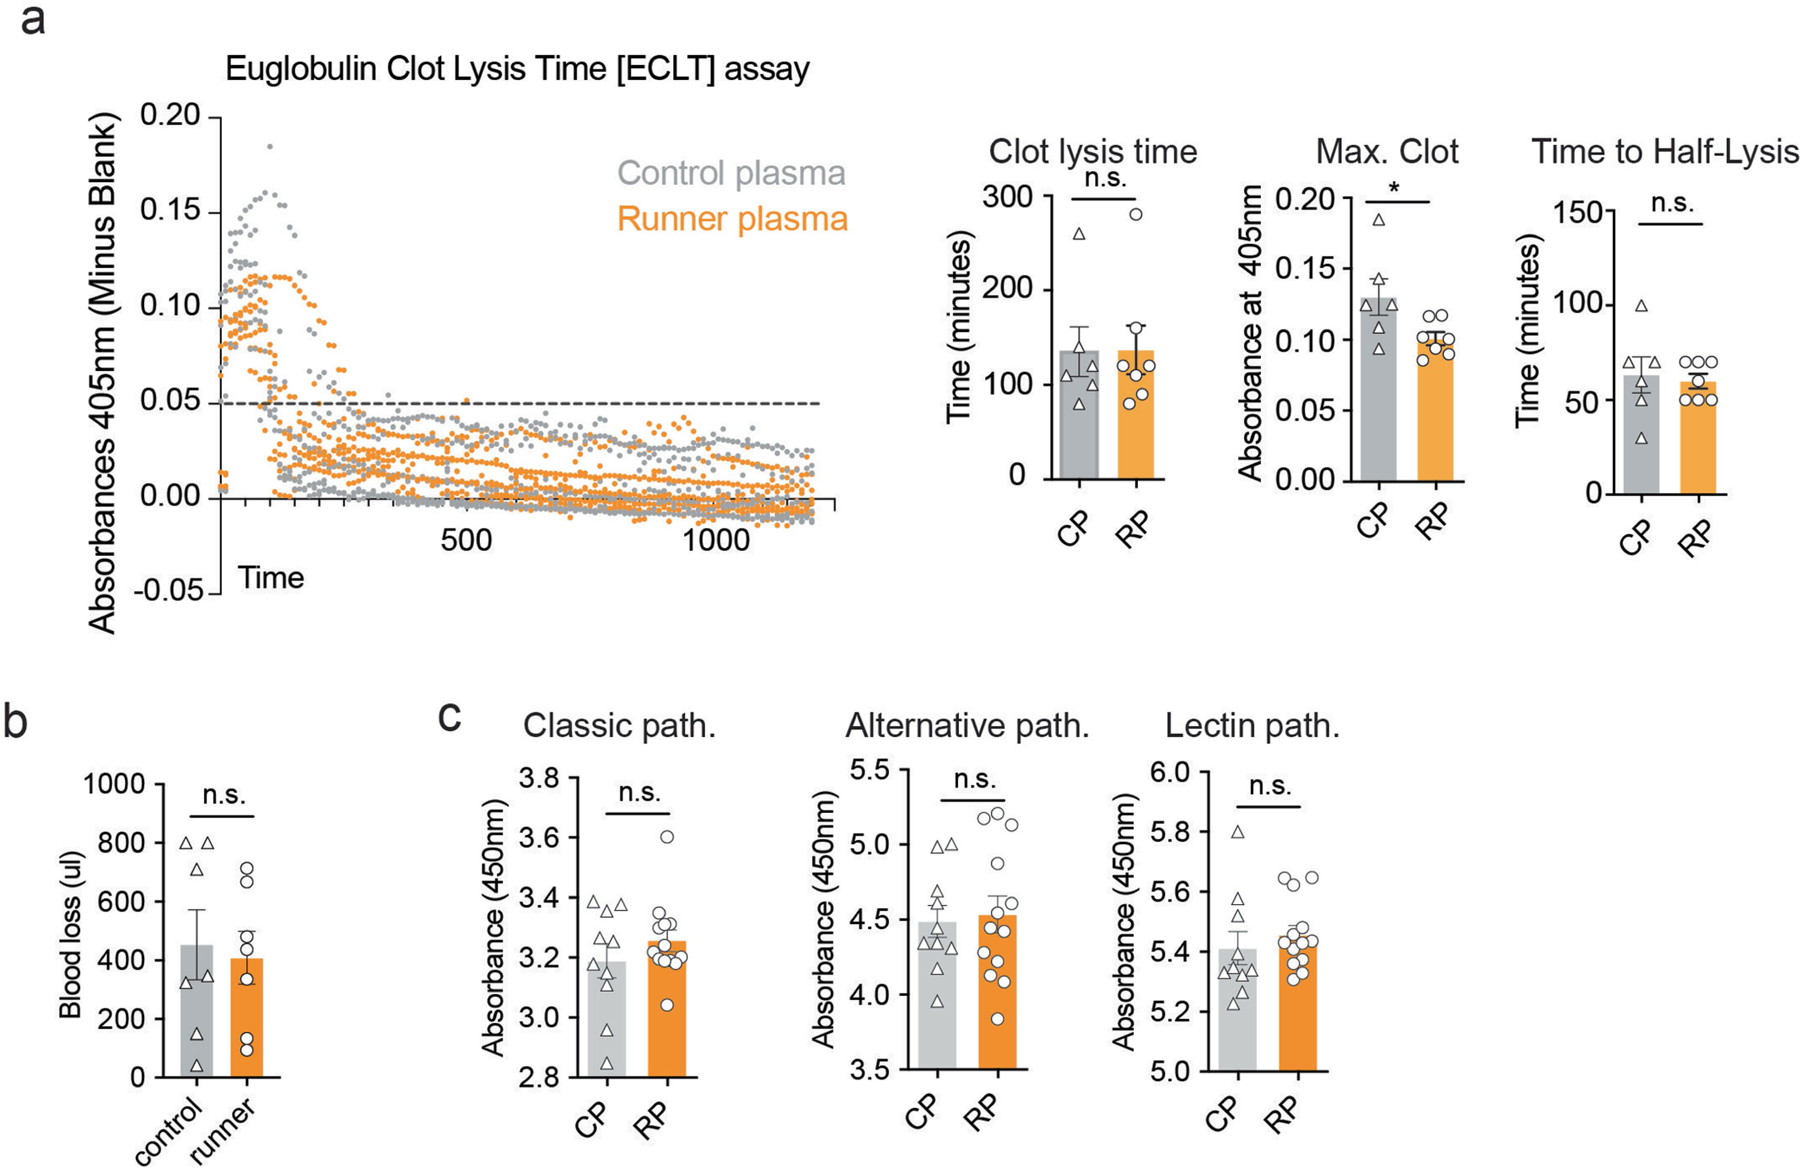
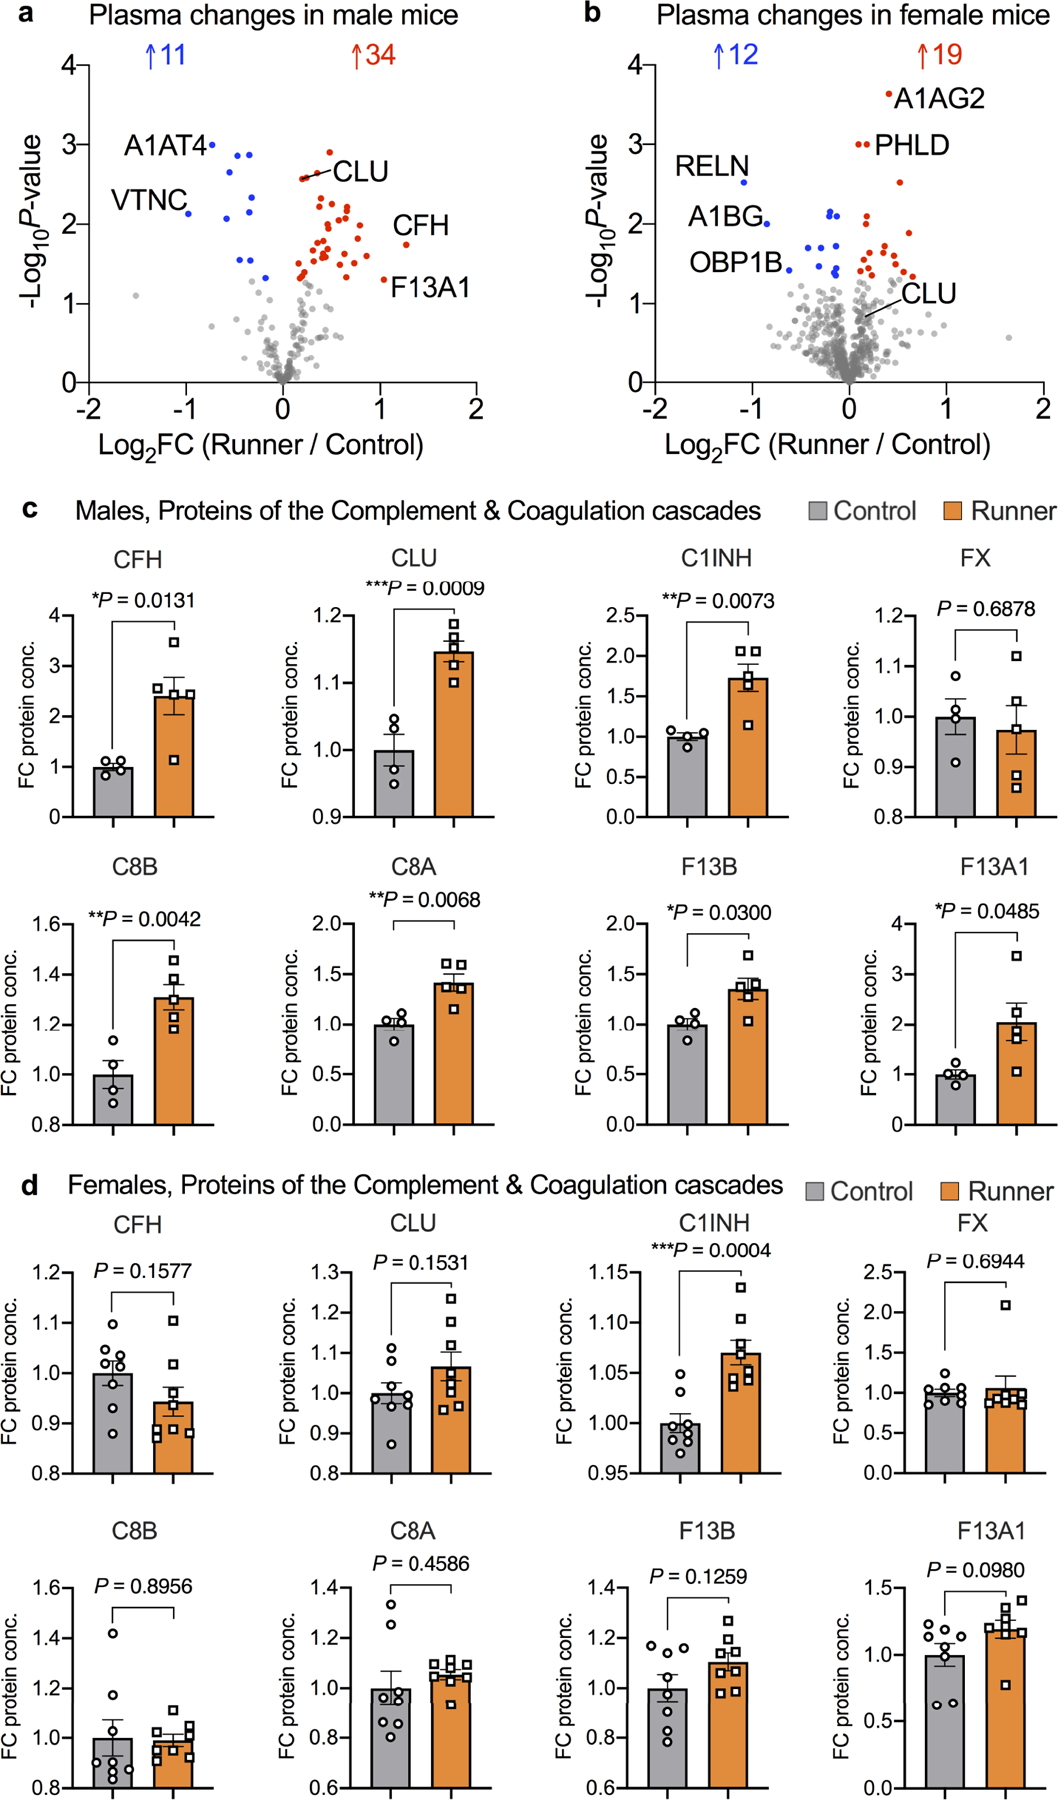
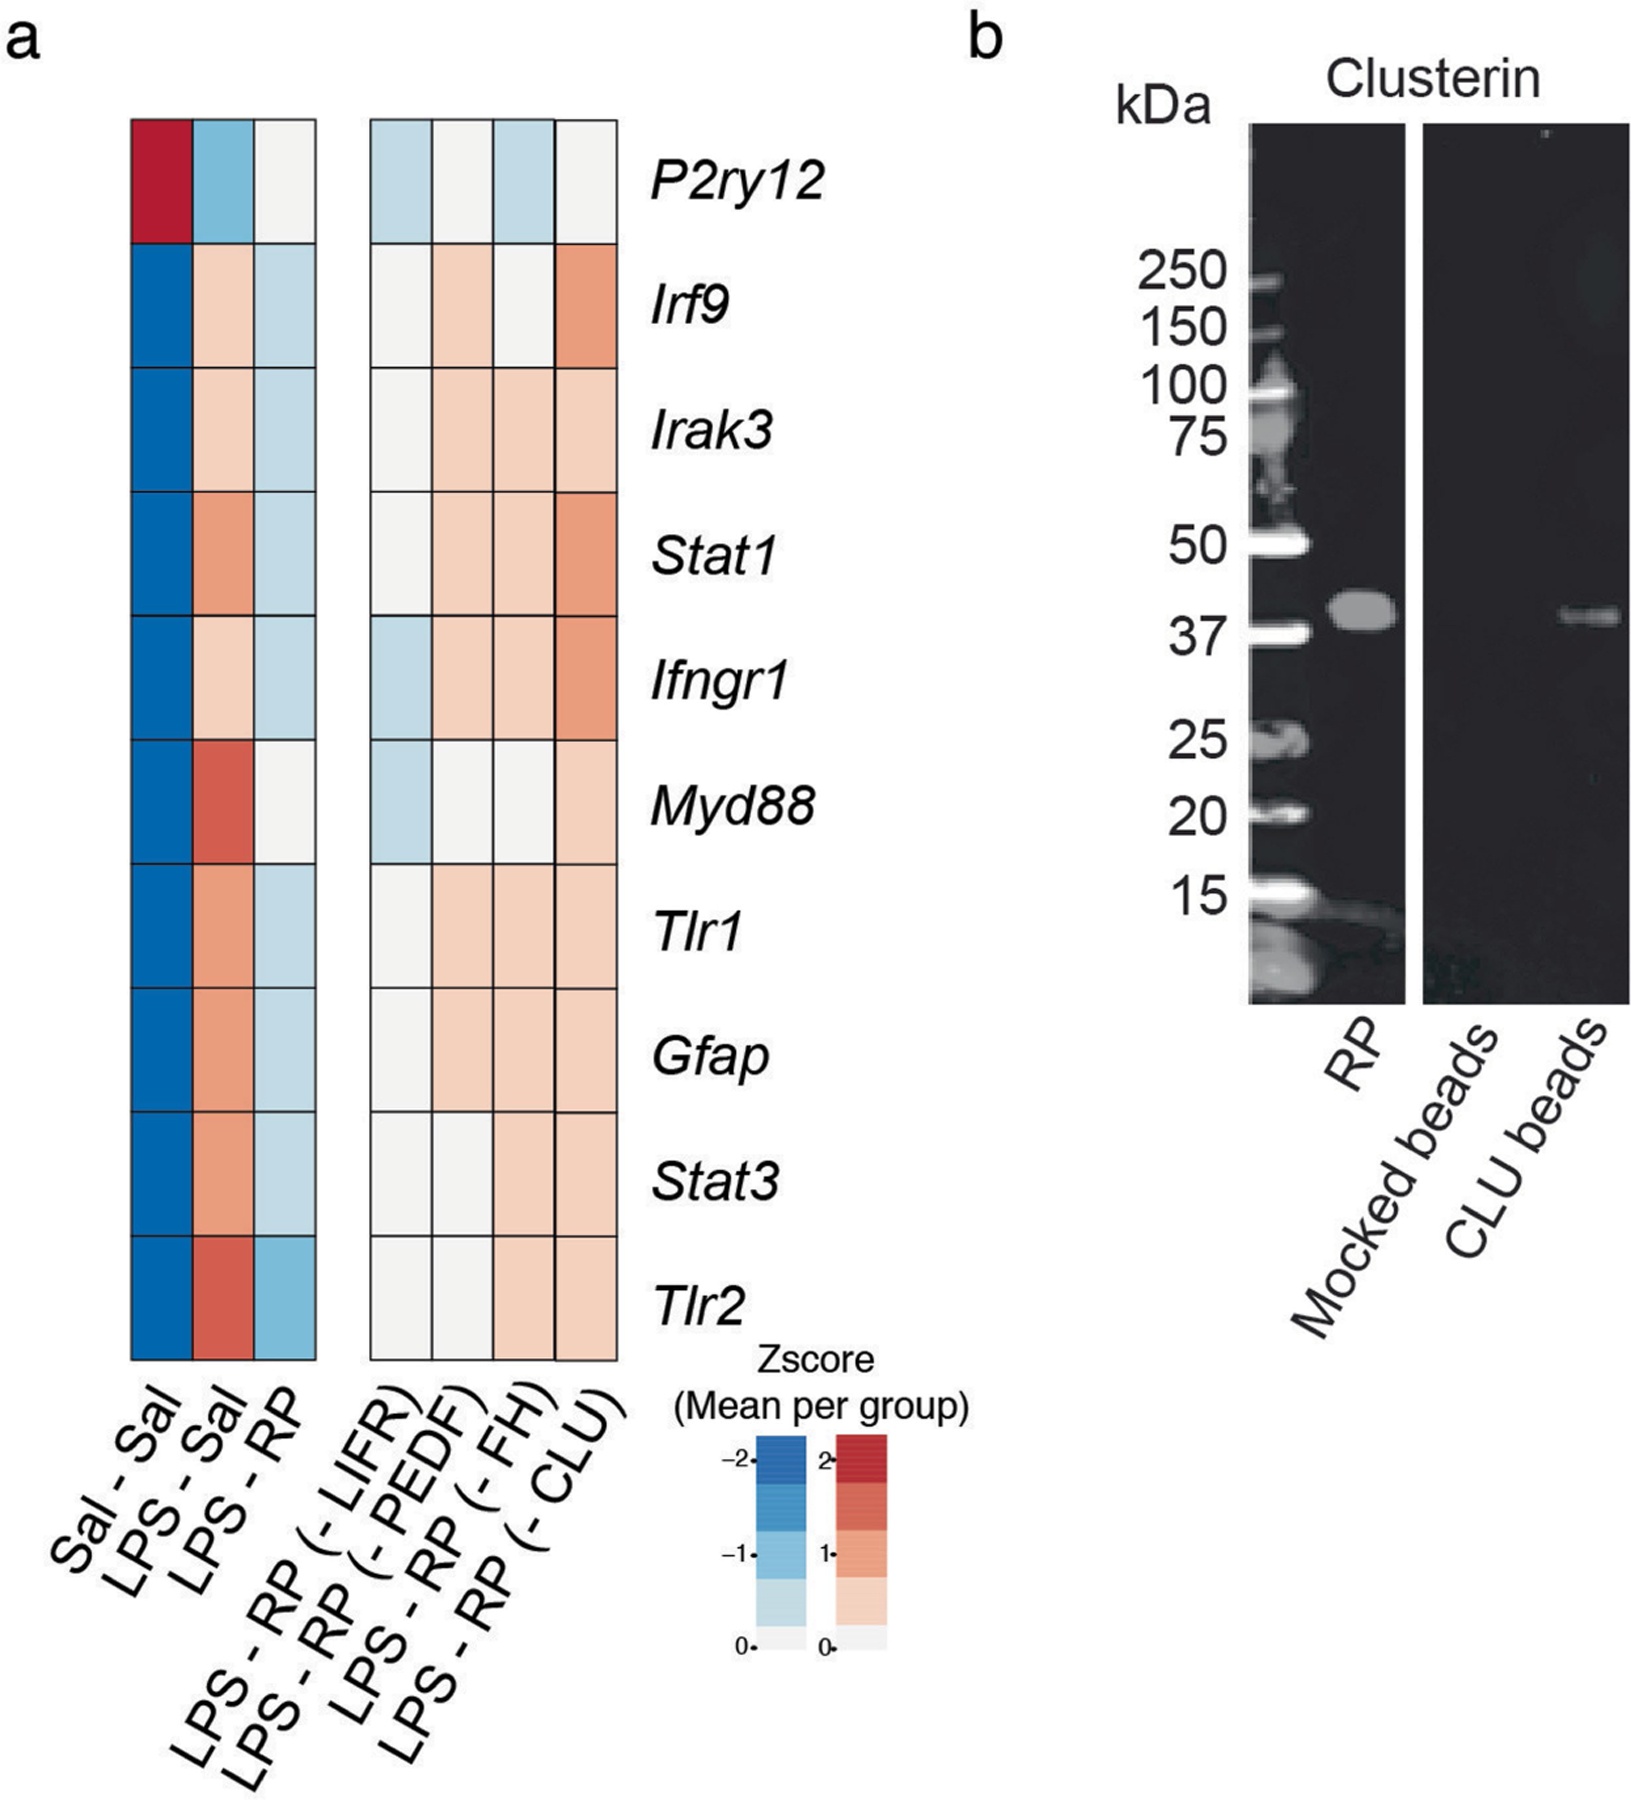
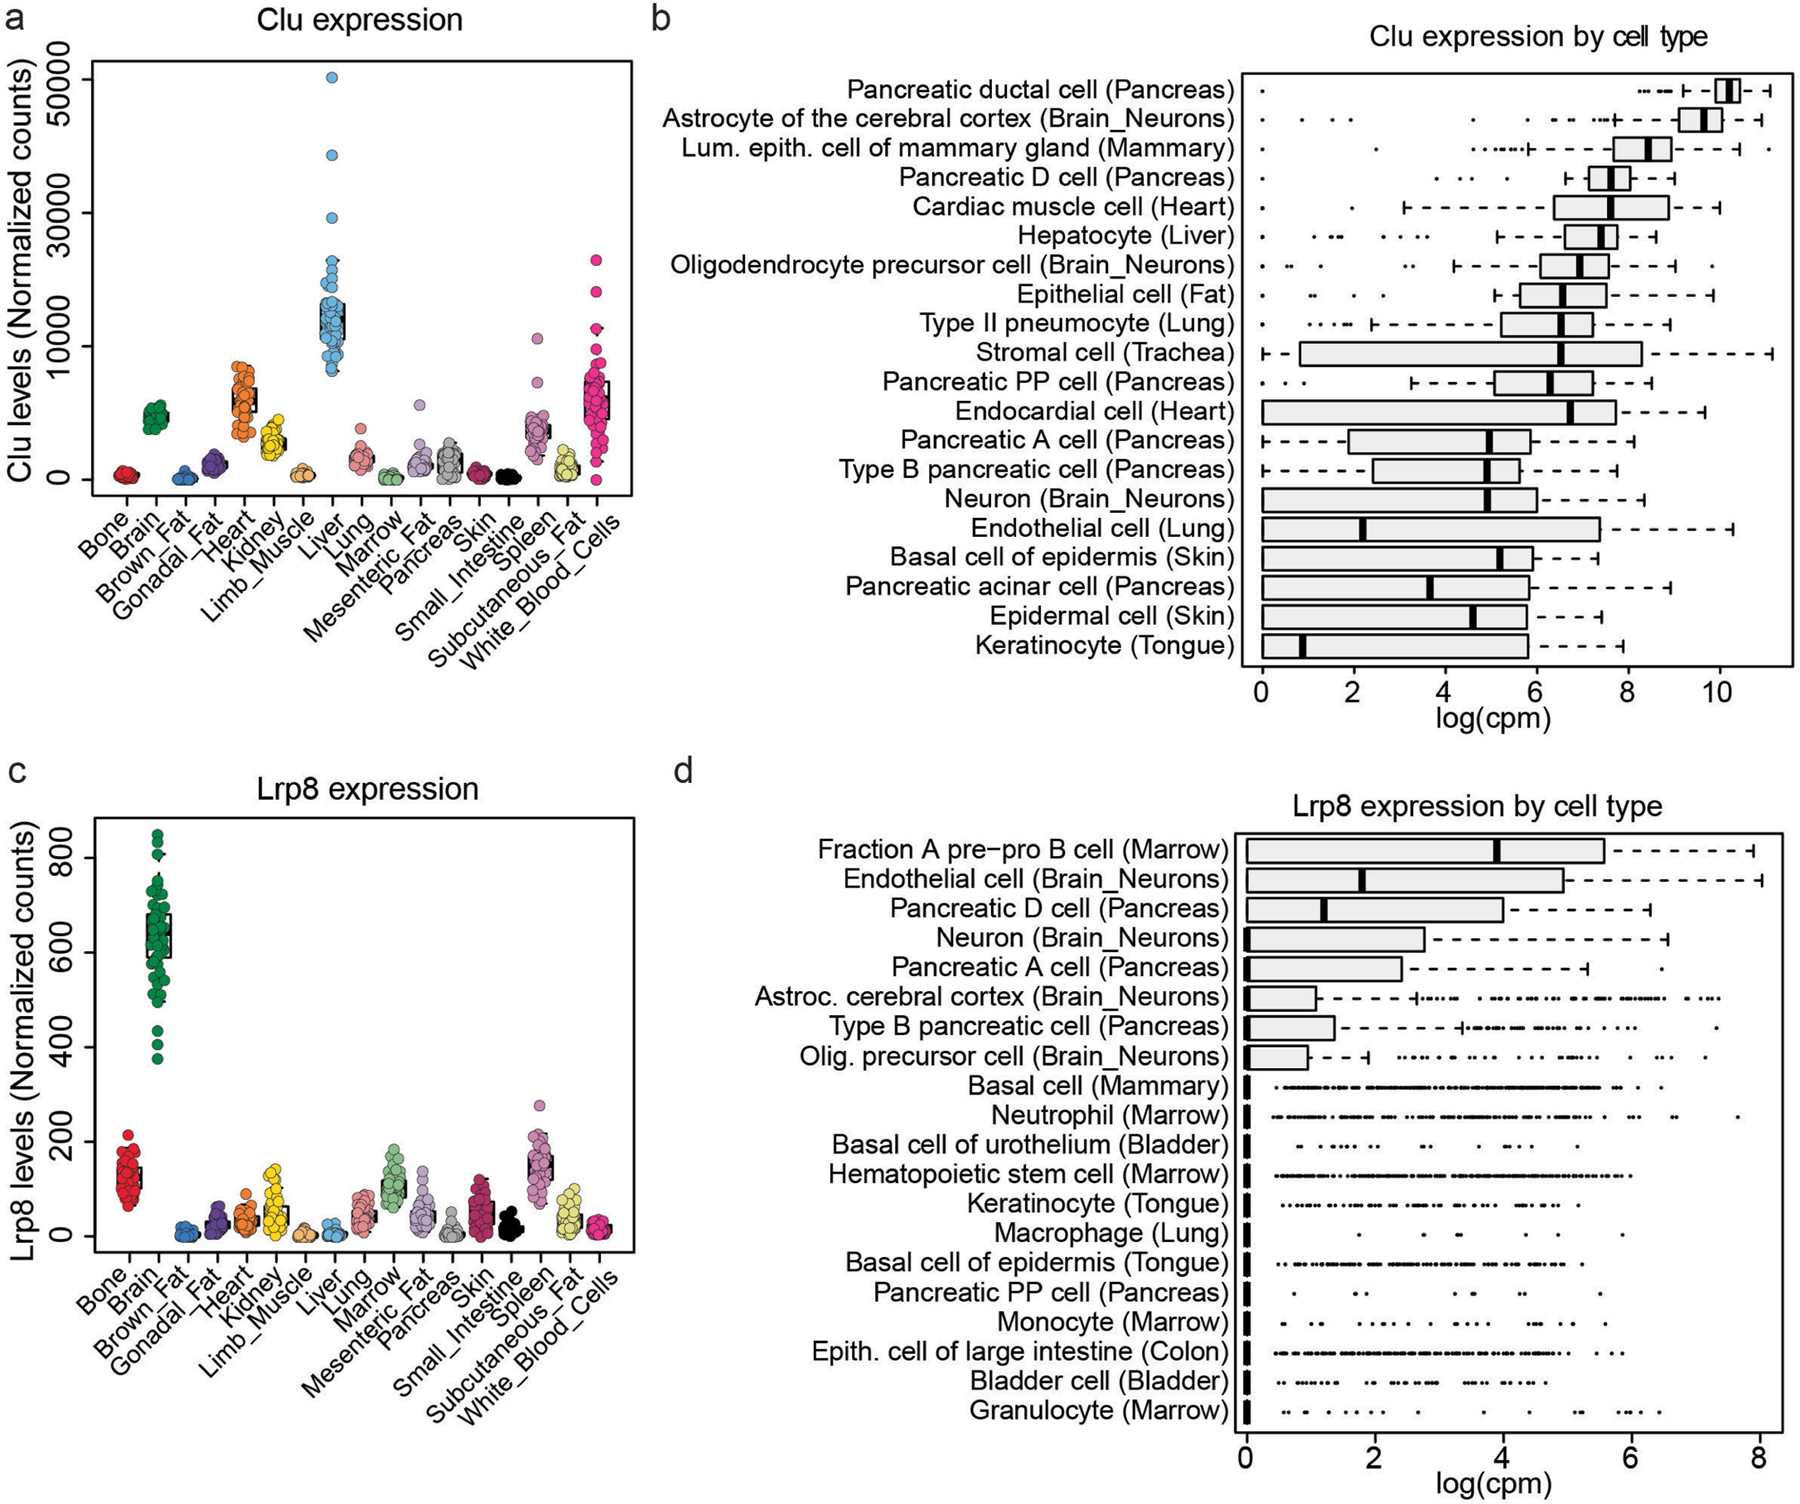
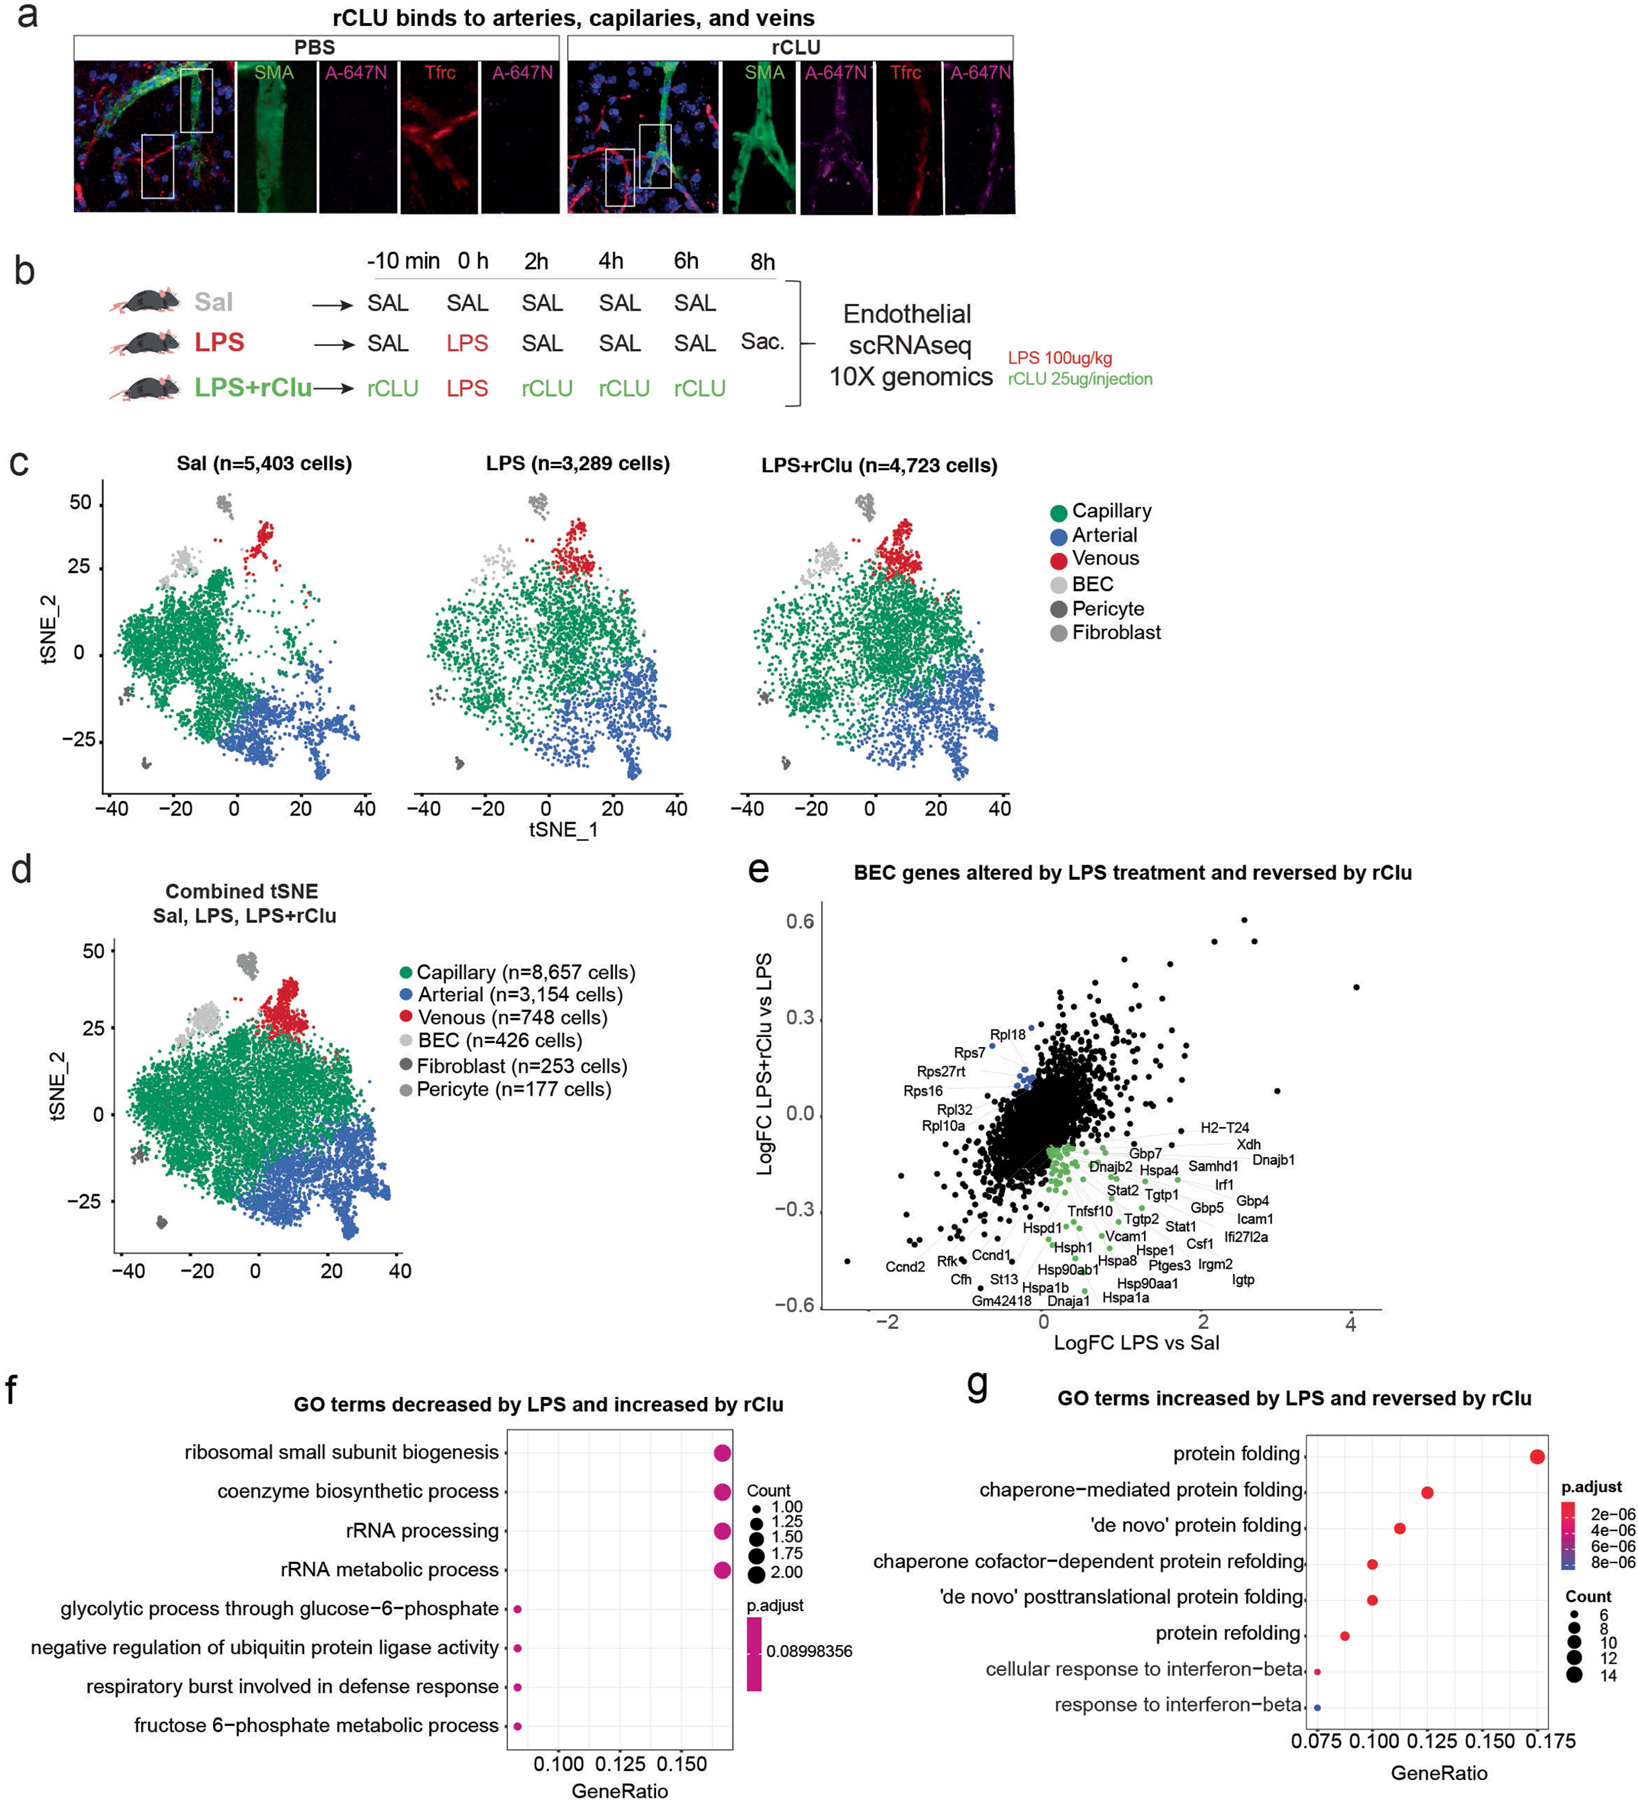
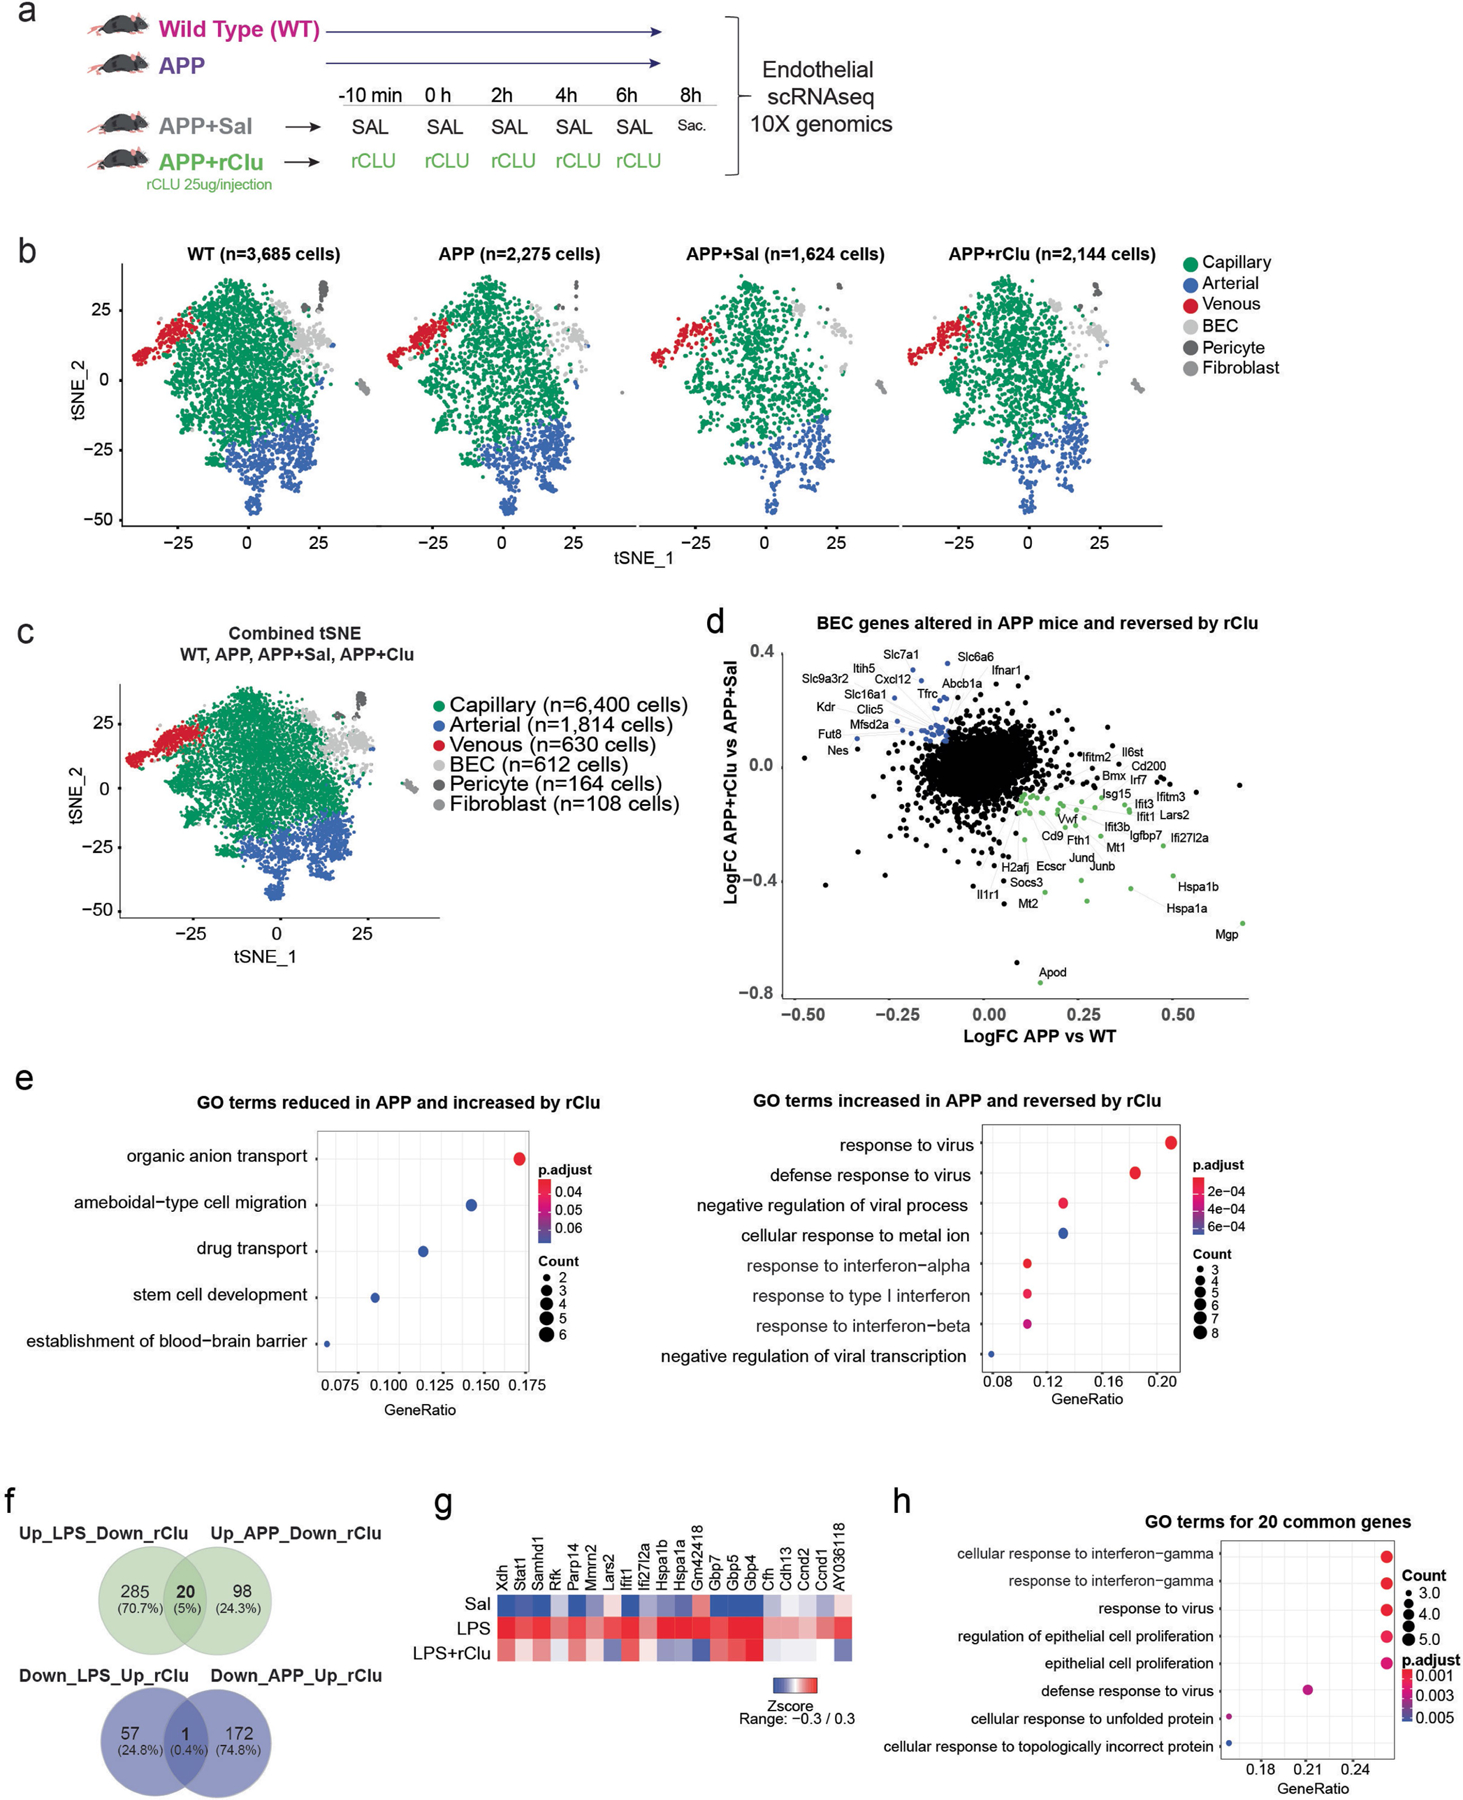
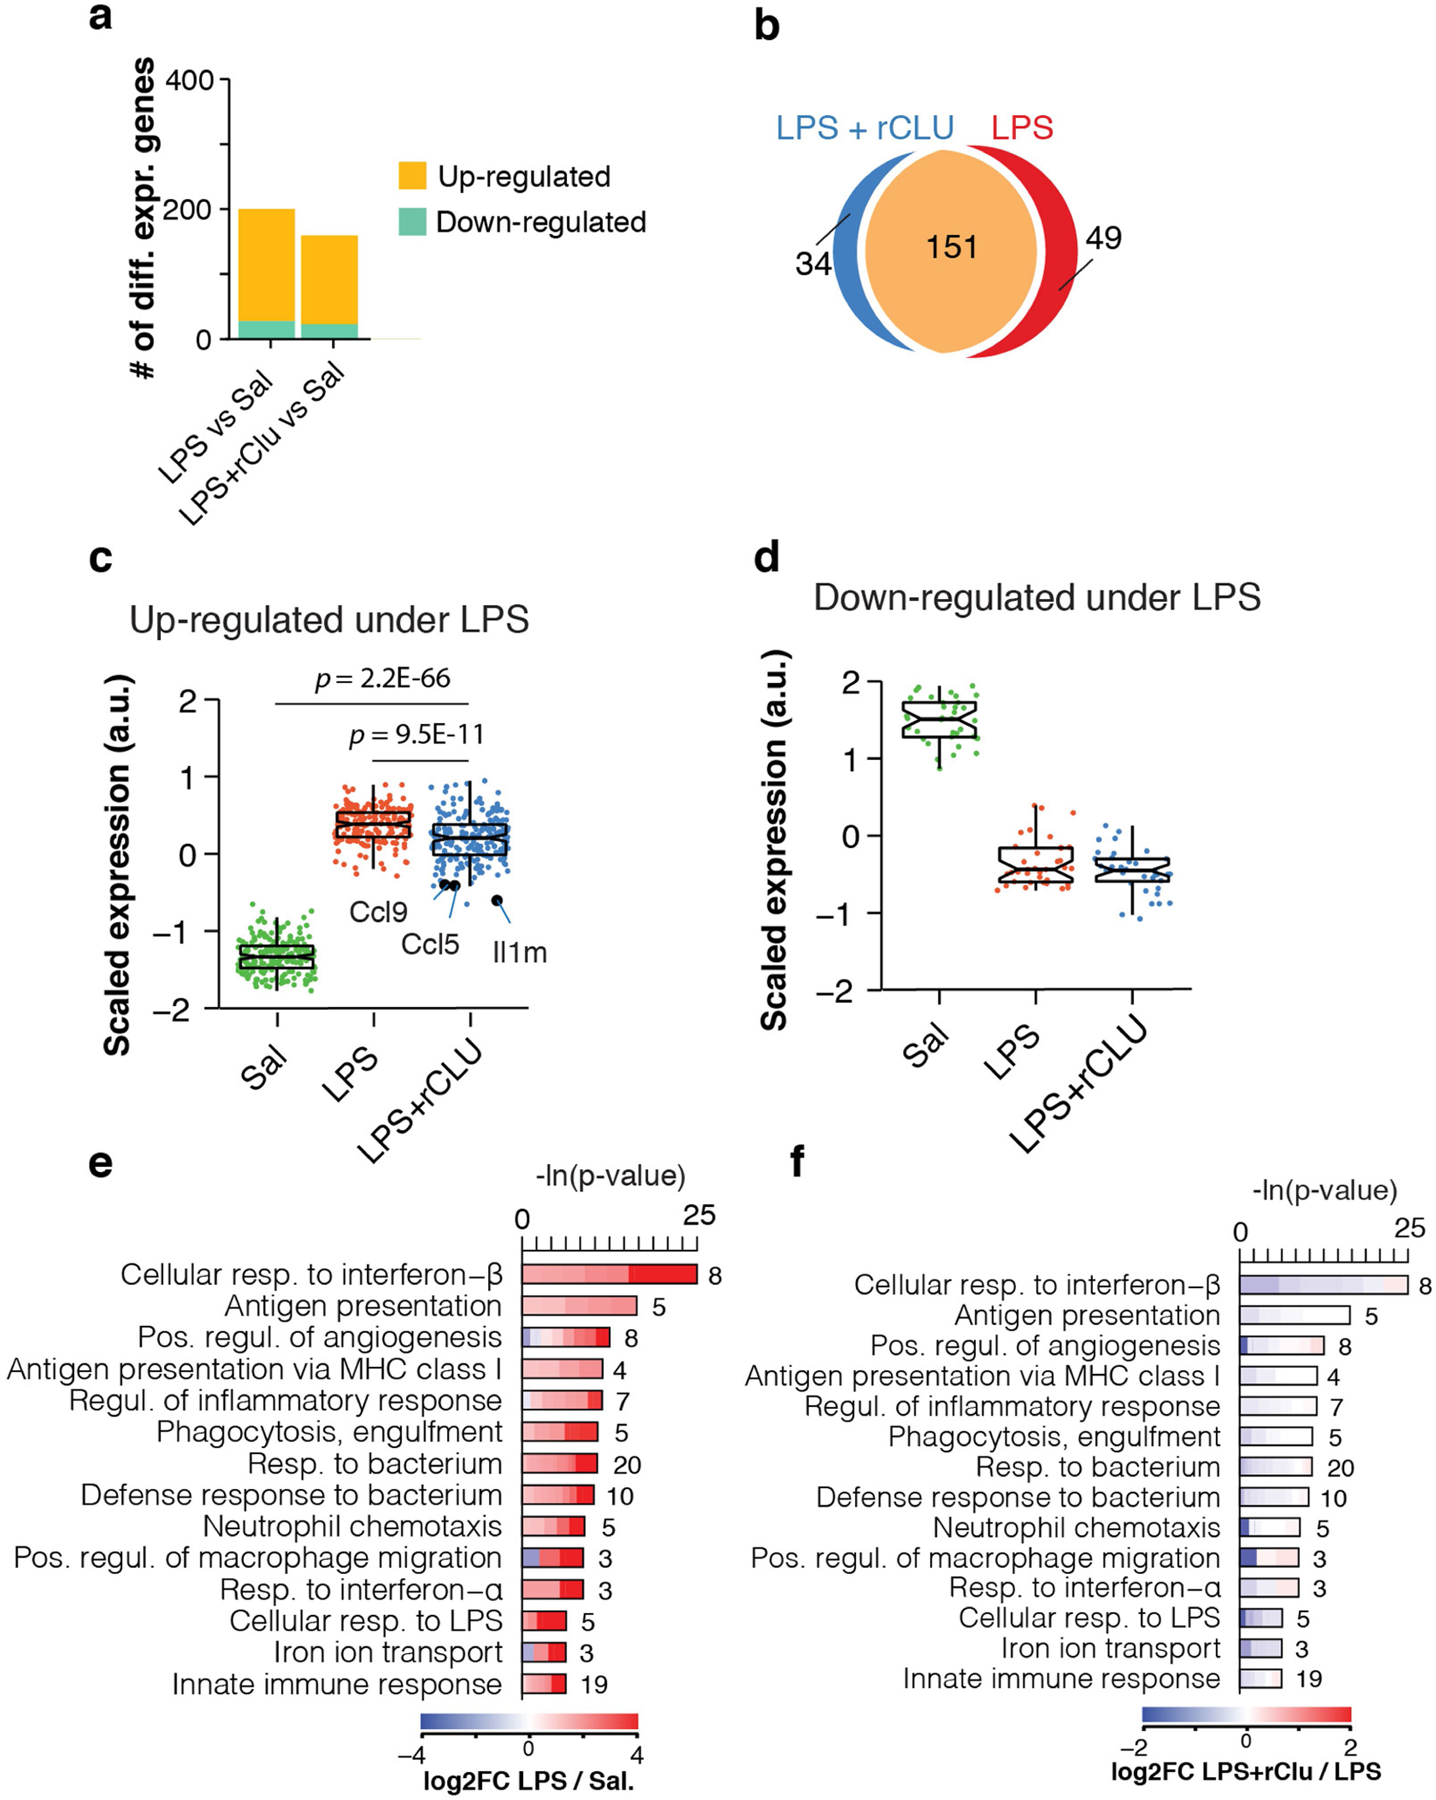
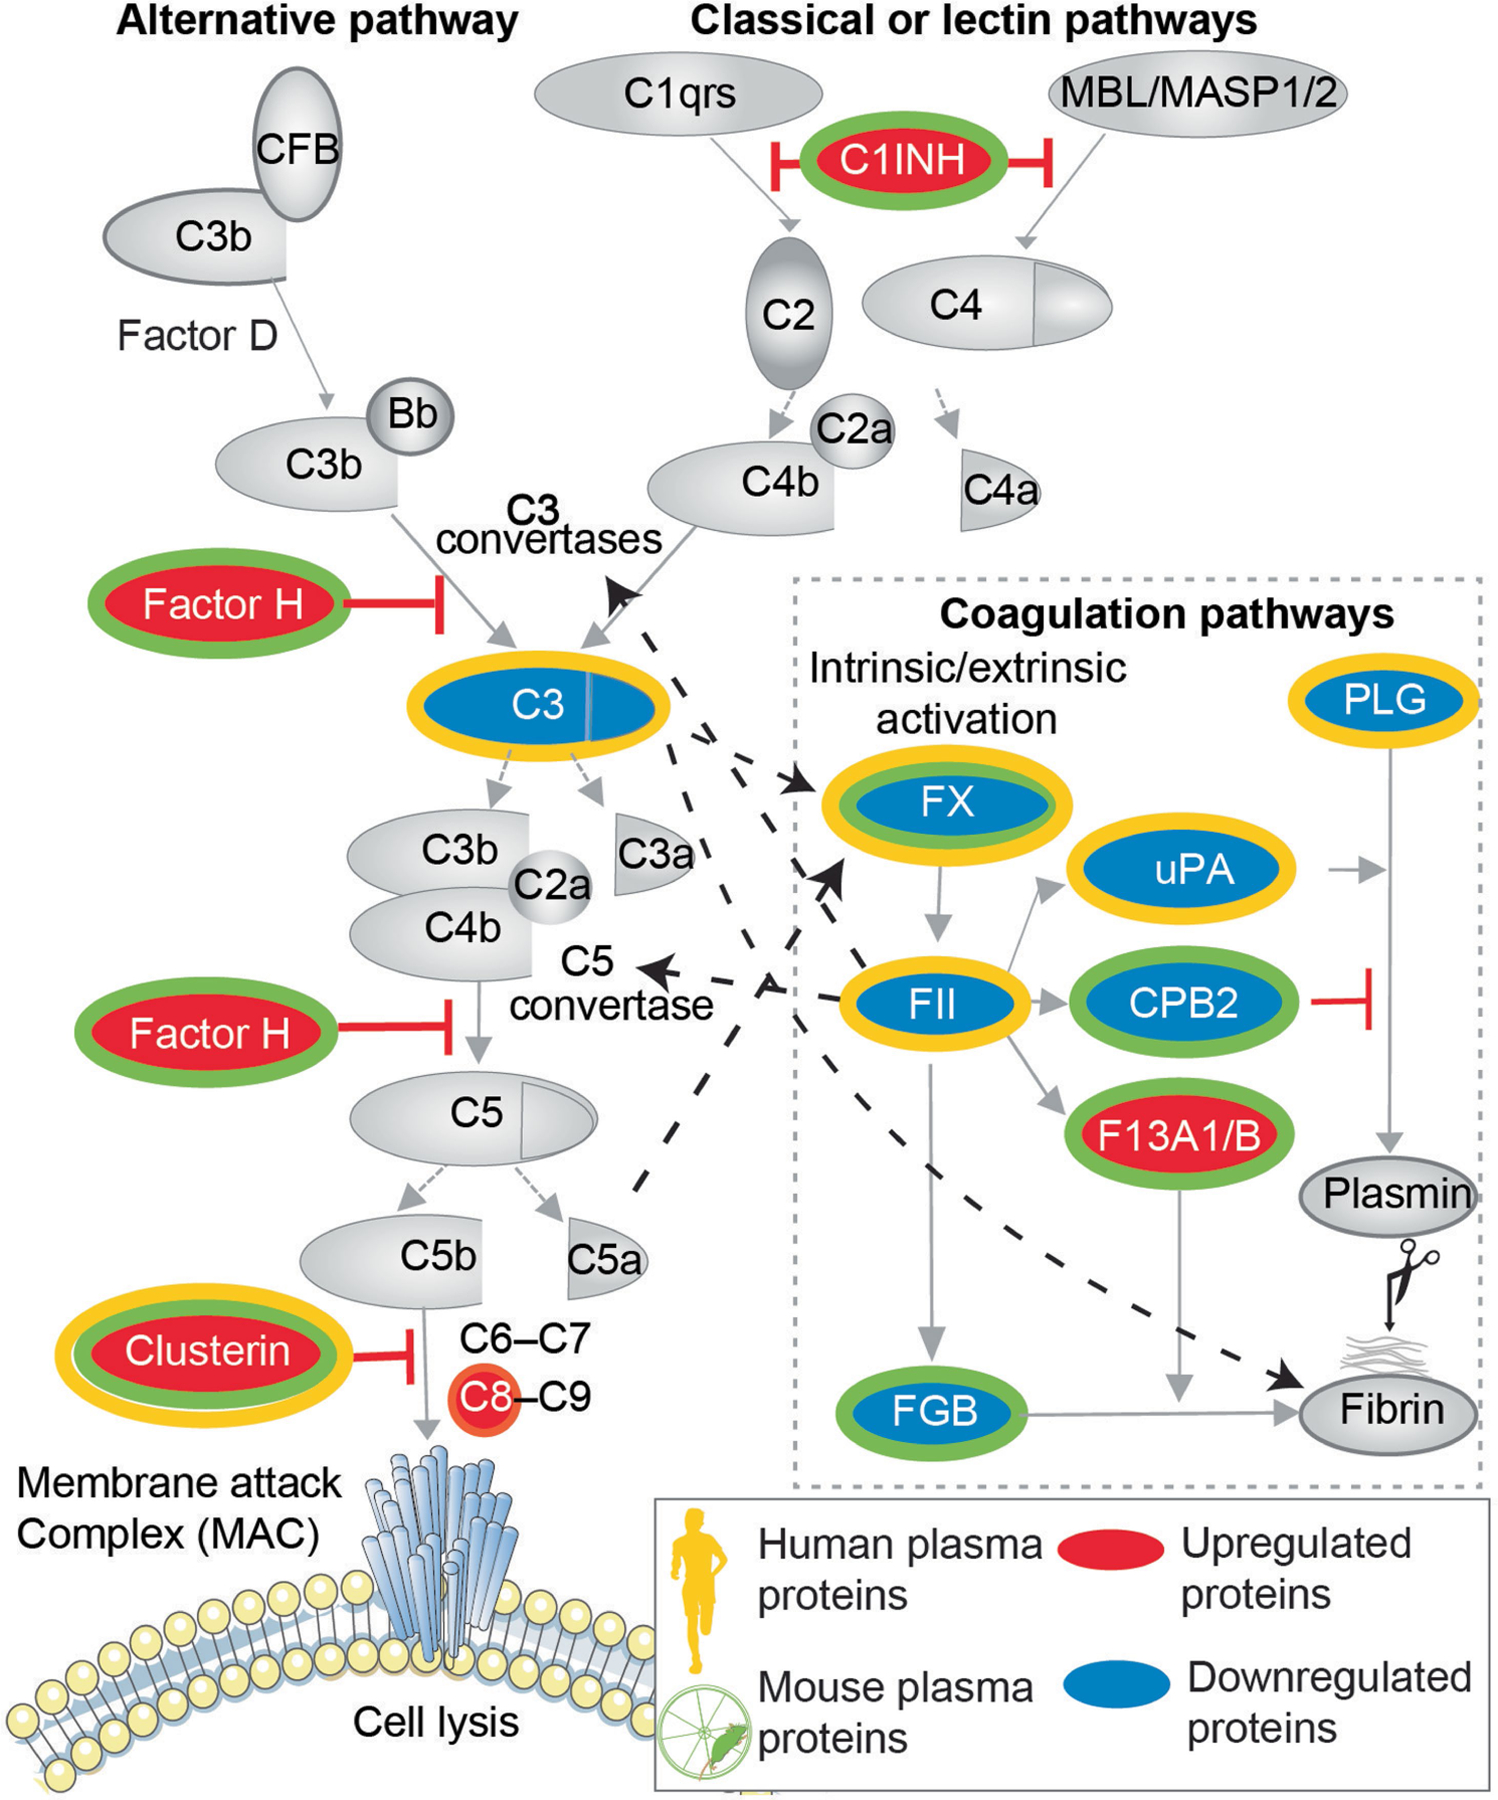
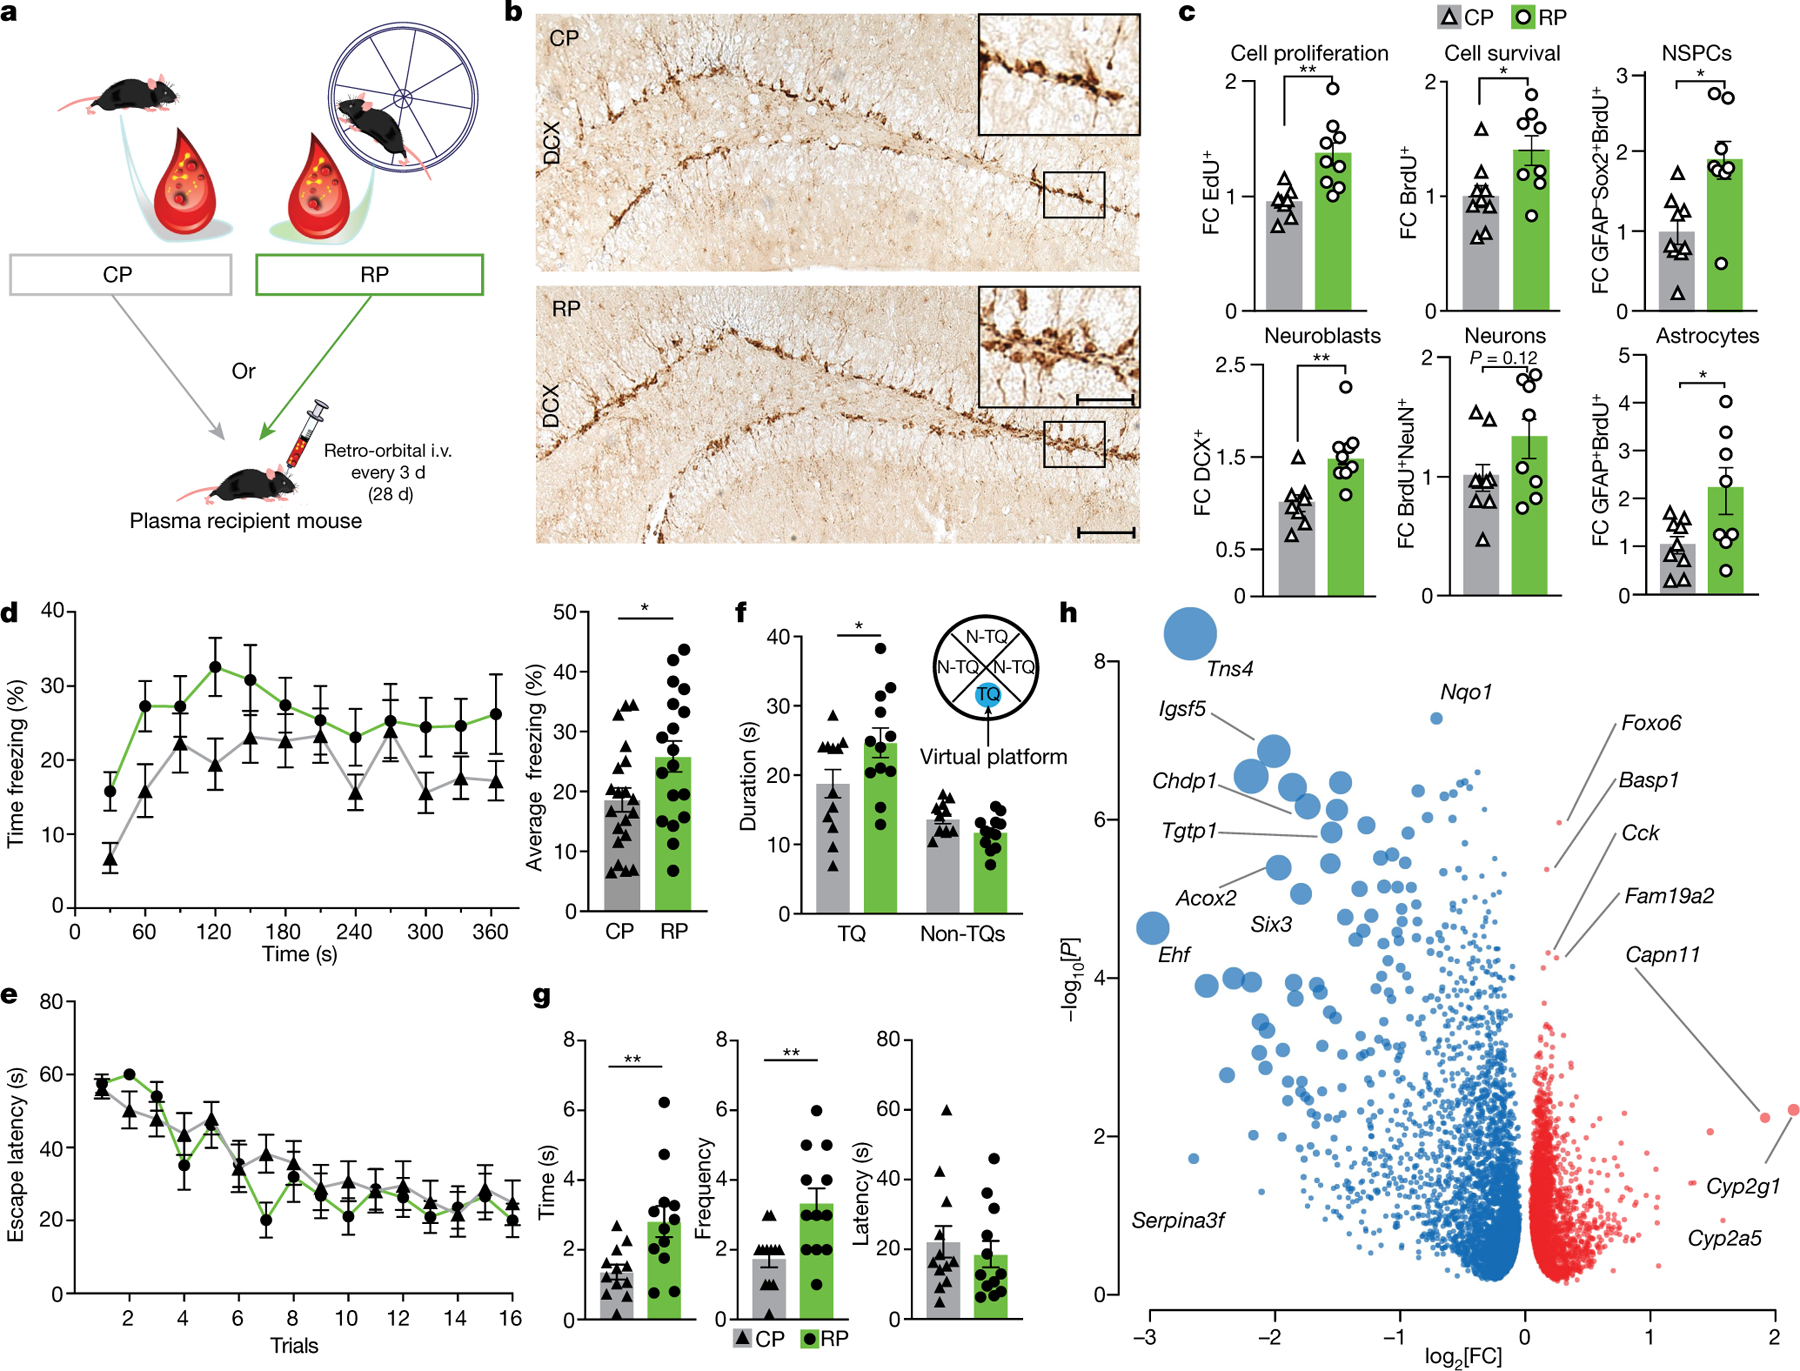
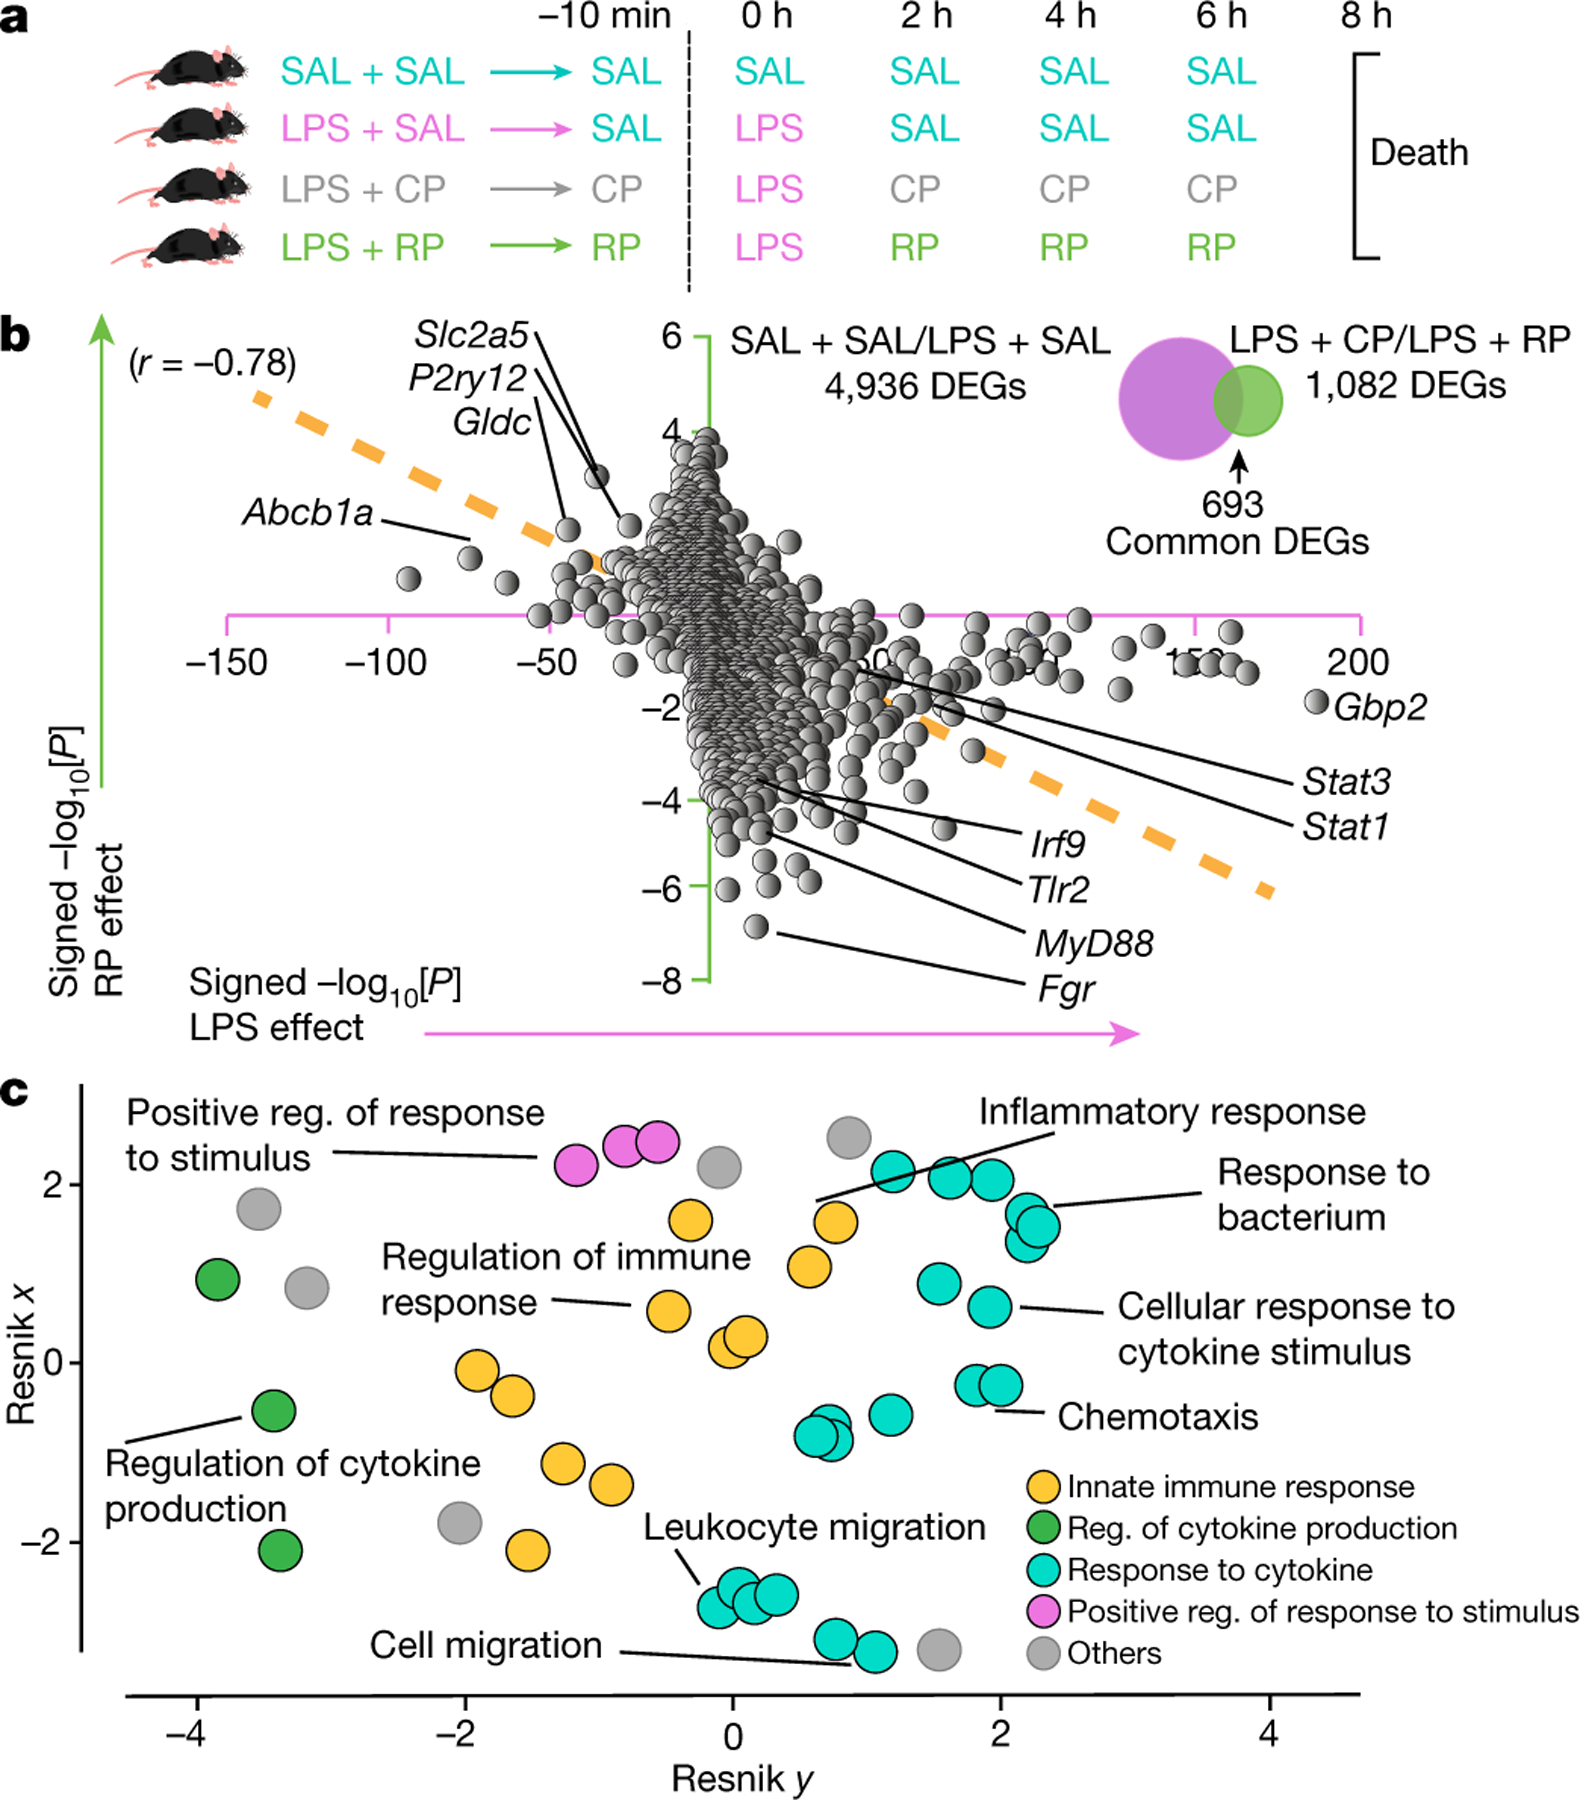
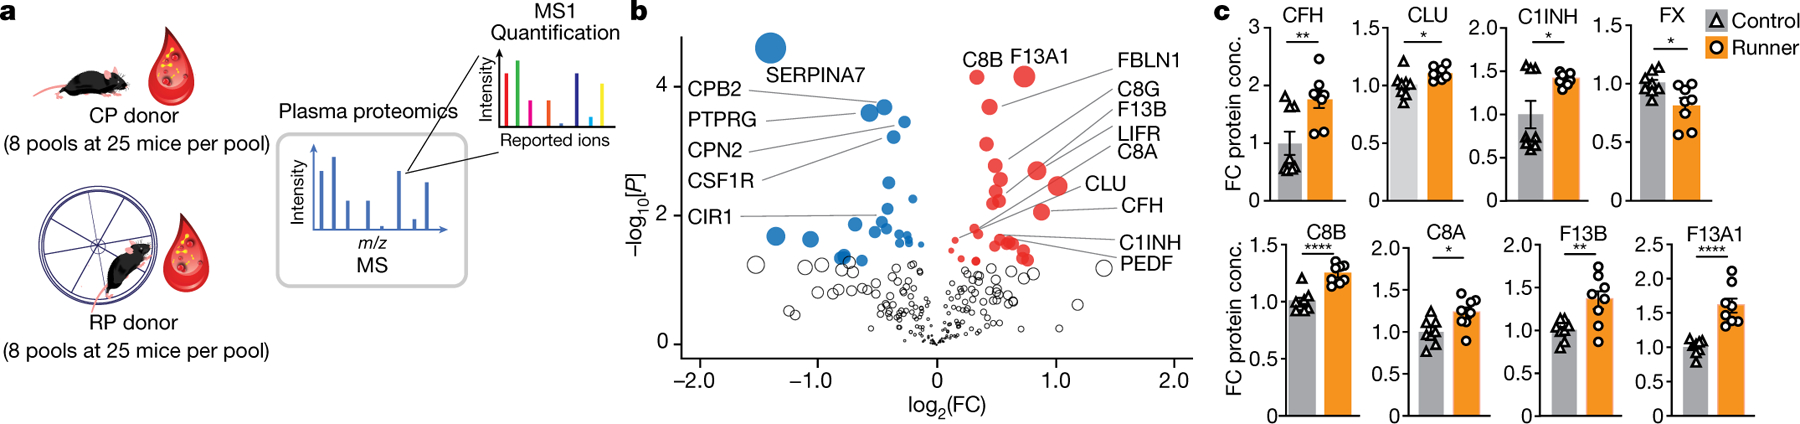
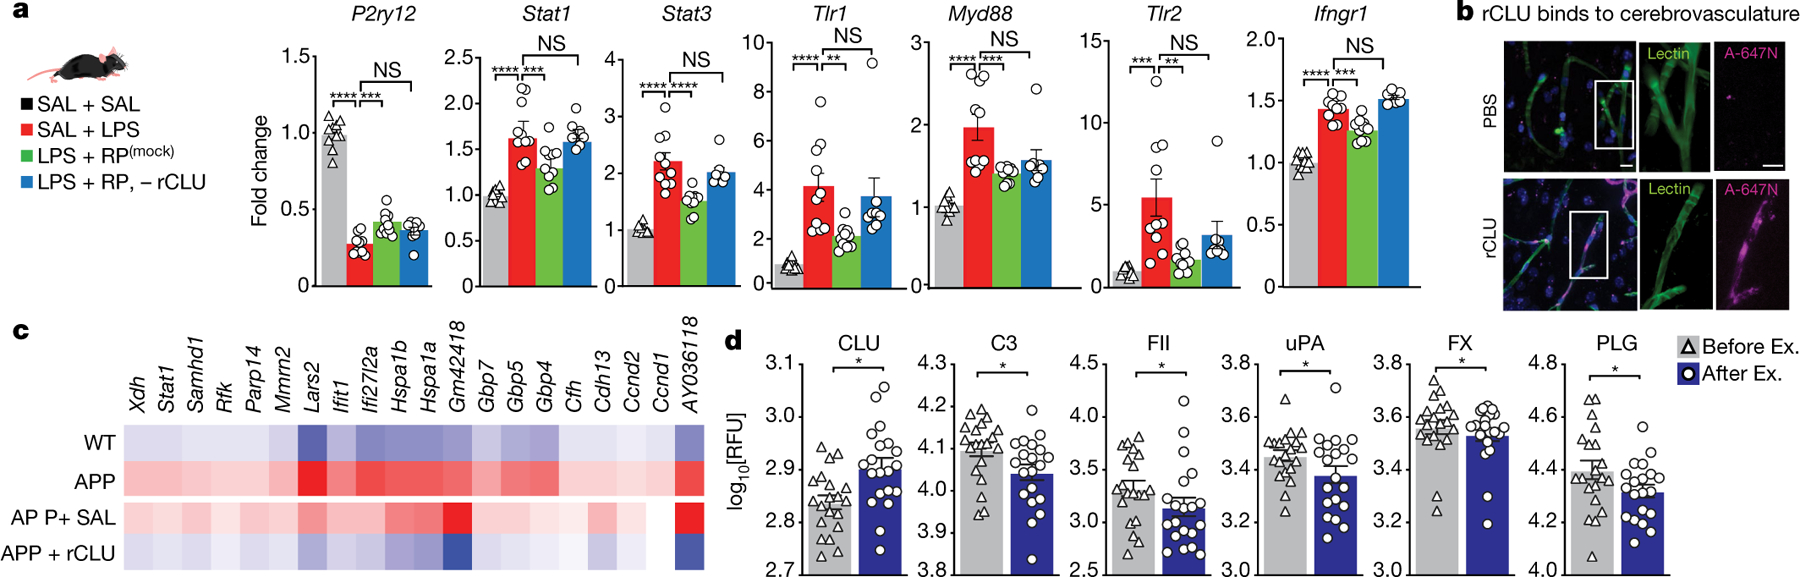
Physical exercise is generally beneficial to all aspects of human and animal health, slowing cognitive ageing and neurodegeneration1. The cognitive benefits of physical exercise are tied to an increased plasticity and reduced inflammation within the hippocampus2-4, yet little is known about the factors and mechanisms that mediate these effects. Here we show that 'runner plasma', collected from voluntarily running mice and infused into sedentary mice, reduces baseline neuroinflammatory gene expression and experimentally induced brain inflammation. Plasma proteomic analysis revealed a concerted increase in complement cascade inhibitors including clusterin (CLU). Intravenously injected CLU binds to brain endothelial cells and reduces neuroinflammatory gene expression in a mouse model of acute brain inflammation and a mouse model of Alzheimer's disease. Patients with cognitive impairment who participated in structured exercise for 6 months had higher plasma levels of CLU. These findings demonstrate the existence of anti-inflammatory exercise factors that are transferrable, target the cerebrovasculature and benefit the brain, and are present in humans who engage in exercise.


Conflict of interest statement

Competing interests N.O. is affiliated with Calico Life Sciences and has no financial interests to declare. The other authors declare no competing interests.

Figures

Extended Data Fig. 1 |
Extended Data Fig. 1 |. Changes in cell proliferation and survival with running or runner plasma infusions.
a, Male mice at 3–4 months of age had access to a running wheel for 3, 7, 14 or 28 days while controls remain without access to running wheels. EdU was administered 24 h before sacrifice. Plots show total number of cells per dentate gyrus (DG) of fluorescent immunolabelled EdU+ cells (n = 6–8 per group) and DCX+ cells (n = 6–7 per group). b, Running distance per day by male mice (n = 5) at 3–4 months of age with free access to a running wheel. c, Male mice at 3, 6, 9, 12 and 15 months of age had access to a running wheel for 28 days. Graphs show total number of DCX+ cells per dentate gyrus (n=4–8 per group). Means ± s.e.m; unpaired Student’s two-tailed t test; * P < 0.05, ** P < 0.01, *** P < 0.01. d, Male mice at 3 months of age had access to a running wheel for 28 days. BrdU was administered 3 days before the exercise and EdU 24 h before sacrifice. Graphs show total number of cells per dentate gyrus (DG) of fluorescent immunolabelled cells (n=4–6 per group). Means ± s.e.m; unpaired Student’s two-tailed t test; * P < 0.05. e, Control injections of saline via retro-orbital vein in combination with Isoflurane do not impair neural stem activity. Mice at 3–4 months of age were injected with saline via the tail vein or the retro orbital vein with 200 μl of saline, every 3 days for 28 days. BrdU was administered 3 days before saline administration and EdU 24 h before sacrifice. The hippocampus was dissected and processed for immunohistochemistry. Graphs show total number of cells per dentate gyrus (DG) of fluorescent immunolabelled cells (n=7–8 per group). Means ± s.e.m; Unpaired Student’s two-tailed t test. f, Runner plasma infusions from 28 days runners upregulate proliferation and survival of hippocampal new born cells. Plasma from running mice (3–4 months of age) that run for 7, 14 or 28 days was collected and transferred to matched aged non-running mice, once every 3 days 28 days. BrdU was administered 3 days before plasma administration and EdU 24 h before sacrifice. Graphs show fold change of total number of cells per dentate gyrus (DG) of fluorescent immunolabelled EdU+ cells, BrdU+ cells and DCX+ cells (n = 6–9 per group). Means ± s.e.m; unpaired Student’s two-tailed t test; * P < 0.05, ** P < 0.01 and *** P < 0.001. The images in a, c, d and e were generated using Servier Medical Art (https://smart.servier.com) and MediaLab (https://medialab.biochem.wisc.edu/clip-art/).
Extended Data Fig. 2 |
Extended Data Fig. 2 |. Changes in behavioural and hippocampal biological processes in response to runner plasma infusions.
a, Plasma from running mice (3–4 months of age) was collected and transferred to matched aged non-running mice, once every 3 days for 28 days. Mice were then tested for cued memory on the fear conditioning test. Graphs show percentage of freezing behaviour in response to the light/tone cues associated with the fear stimulus in CP and RP recipient mice (n = 18–20 per group). Means ± s.e.m; Unpaired Student’s two-tailed t test, N.S. not significant. b, CP and RP infused mice show comparable activity and velocity in the activity chamber (n = 13–14 per group) and percentage of time spent in the light arena (n = 12 per group). Means ± s.e.m; unpaired Student’s two-tailed t test; N.S., not significant. c, Graphs show distance traveled, thigmotaxis and velocity displayed by mice infused with RP or CP in the water maze test (n = 12 per group). d, Hierarchical networks of the abundance of gene ontology (GO) terms (Fisher’s exact test, P < 0.05) related to biological processes using REVIGO (Resnik measurement, 0.7 distance). GO terms correspond to the DEGs with treatment of CP versus RP shown in Fig. 1h.
Extended Data Fig. 3 |
Extended Data Fig. 3 |. Validation of changes in gene expression in response to runner plasma infusions and validation of changes in proteins with running.
a, PCA analysis of common DEGs (Wald test, P < 0.05) induced by LPS (SAL-SAL (blue) vs. SAL-LPS (red) and by RP treatment (LPS-CP (grey) vs. LPS-RP (green)) (n = 7–8 per group). b, Graphs show fold changes of relative gene expression of indicated genes measured by qPCR (n = 7–8 per group). Means ± s.e.m; One-way ANOVA and Bonferroni post-hoc; * P < 0.05, ** P < 0.01, *** P < 0.001 and **** P < 0.0001. c, Validation of proteins captured with shotgun-LC MS1 using TMT-LC MS3 detection and analysis. Heat map depicting the relative levels of the top differentially expressed plasma proteins detected. Unpaired Student’s two-tailed t test; * P < 0.05, ** P < 0.01 and *** P < 0.001. d, Classification by PCA analysis using plasma proteins detected by Shotgun-LC-MS1 and significantly changed with running (unpaired Student’s two-tailed t test, P < 0.05). Data are Log2 transformed and missing values imputed by using the mean of each group. Control plasma (grey); runner plasma (orange). (n = 8 per group). e, Hierarchical networks of the abundance of gene ontology (GO) terms (Fisher’s exact test, P < 0.05) related to biological processes using REVIGO (Resnik measurement, 0.7 distance). GO terms correspond to the proteins significantly change with running when comparing CP with RP (unpaired Student’s two-tailed t test, P < 0.05) and shown in Fig. 3b.
Extended Data Fig. 4 |
Extended Data Fig. 4 |. Assessment of fibrinolysis and measurement of clot formation in runner plasma.
a, The formation and lysis of clots in control and runner’s plasma as measured by the Euglobulin Clot Lysis Time [ECLT] assay. Clot formation and lysis is measured under continuous spectrophotometric absorbance readings at 405nm. (Maximum clot formation is defined as the maximum absorbance; Clot lysis time is defined as the as the time at which the curve reaches an absorbance of 0.05 or less; Time to half lysis is defined as the time at which the curve reaches 50% of clot lysis) (n=6–7 per group). Means ± s.e.m; unpaired Student’s two-tailed t test; n.s., not significant, * P < 0.05. b, Amount of blood lost in runner and control mice after tail clipping as measured by the haemoglobin concentration (n = 7 per group). Means ± s.e.m; unpaired Student’s two-tailed t test; n.s., not significant. c, Measuring the activity of the classical, alternative, and lectin complement pathways in control versus runner’s plasma. Plots show absorbance at 450nm indicative of levels of membrane C5b-9 attack complex formation induced by IgM, LPS, or Mannose Binding Lectin (MBL) respectively (n = 10–13 per group). Means ± s.e.m; Unpaired Student’s two-tailed t test; n.s., not significant.
Extended Data Fig. 5 |
Extended Data Fig. 5 |. Changes in plasma proteins in female and male mice in response to running.
a - b. Volcano plot showing proteins significantly changed (P < 0.05) in RP versus CP in female or male mice. Downregulated proteins (blue); upregulated proteins (red). Unpaired Student’s two-tailed t test without FDR correction. c – d. Representative plasma proteins of the complement and coagulation pathways in male or female mice with 28 days of running (n = 8 per group). Means ± s.e.m, Unpaired Student’s two-tailed t test.
Extended Data Fig. 6 |
Extended Data Fig. 6 |. Immunodepletion of clusterin in runner plasma abrogates its anti-inflammatory properties on the hippocampus.
a. Male mice (3–4 months of age) were injected with LPS and treated with saline (LPS – SAL, n=10), runner plasma (LPS – RP, n=10), runner plasma without CLU (LPS – RP – CLU, n=8), runner plasma without FH (LPS – RP – FH, n=8), runner plasma without LIFR (LPS – RP – LIFR, n=8)) or runner plasma without PDEF (LPS – RP – PDEF, n=8). Heat map representing the relative differences between the mean of each group (zscore of means) on selected inflammatory gene markers in the hippocampus. b. Western blotting shows that CLU removal from a plasma sample after depletion via CLU antibody coupled to superparamagnetic beads using a Dynabeads® Antibody Coupling Kit bind to CLU.
Extended Data Fig. 7 |
Extended Data Fig. 7 |. Expression of Clu and its receptor Lrp8 across different cell types and organs of the adult mouse.
a. Clu mRNA levels across organs quantified from the bulk RNA-seq dataset conducted on different organs of the adult mouse. b. Bar chart showing the top 20 Clu expressing cells at the mRNA level among >100 different cell types of the adult mouse quantified from the Tabula Muris Atlas dataset (n=4 male and n = 4 female biological replicates). c. The mRNA levels of the Clu receptor LRP8/ApoER2 across organs quantified from the bulk RNA-seq dataset conducted on different organs of the adult mouse. d. Bar chart showing the top 20 Lrp8 expressing cells at the mRNA level among >100 different cell types of the adult mouse quantified from the Tabula Muris Atlas dataset.
Extended Data Fig. 8 |
Extended Data Fig. 8 |. Experimental design, cell population consistency, and pathways analysis of the scRNA-seq experiment conducted on hippocampal BEC isolated from LPS and CLU treated mice.
a, Confocal representative images show peripherally injected rCLU tagged with Atto-647N or control PBS containing Atto-647N colocalized with cells of the cerebrovasculature, arteries (SMA), capillaries and veins (Tfrc). Scale bars, 10 μm. b, Schematic depicting the experimental paradigm followed for the injections of the three groups. 3- to 4-month-old male mice received Saline only injections (Sal), LPS plus saline treatments (LPS), or LPS plus recombinant CLU (LPS+Clu). BECs were isolated from n = 4–5 per group. c, tSNE plots showing the cellular proportions, numbers, and distributions in the three experimental groups (Sal, LPS, LPS+Clu). d, tSNE plots show distribution of BECs among arterial, capillary, and venous cells by group. Combined tSNE plot for BECs sorted from 3- to 4-month-old male mice (n = 4–5 mice per group) treated with Saline, LPS, and LPS+CLU. (Cells labelled as BEC are of low quality and were excluded from differential expression analysis.). e, Scatter plots show a list of selected genes altered in BECs (arterial, capillary, and venous) by acute inflammation (LPS) and reversed by CLU treatment. Coloured genes represent genes that pass the cutoff fold change of 1.1. Green: Genes increased by inflammation and reversed by CLU. Blue: Genes reduced by inflammation and reversed by CLU. (Log FC: natural logarithm of fold change). f-g, Dotplot showing Gene Ontology (GO) Biological Processes terms for BEC genes (Benjamini–Hochberg adjustment test, FDR < 0.05) that decrease or increase by LPS treatment and are reversed by CLU. Genes were selected based on the cutoff fold change of 1.1. The images in b were generated using MediaLab (https://medialab.biochem.wisc.edu/clip-art/).
Extended Data Fig. 9 |
Extended Data Fig. 9 |. Experimental design, cell population consistency, and pathways analysis of the scRNA-seq experiment conducted on hippocampal BEC isolated from APP and CLU treated mice.
a, Schematic depicting the experimental paradigm followed for the injections of the four groups. 14-months-old male Wild Type (WT) and APP transgenic mice that received no treatment, 17-months-old male APP mice that received saline only injections (APP+Sal) or repetitive CLU injections (APP+Clu) (BECs were isolated from n = 4–5 per group). b, tSNE plots showing the cellular proportions, numbers, and distributions in the four experimental groups (WT, APP, APP+Sal, APP+Clu). c, tSNE plots show distribution of BECs among arterial, capillary, and venous cells by group. Combined tSNE plot for BECs sorted from 14-month-old male wild-type and APP transgenic mice and 17-month-old male APP mice treated with Saline or CLU (BECs sorted from n = 4–5 mice per group). (Cells labelled as BEC are of low quality and were excluded from differential expression analysis.). d, Scatter plots show a list of selected genes altered in BECs (arterial, capillary, and venous) by chronic (APP) inflammation and reversed by CLU treatment. Coloured genes represent genes that pass the cutoff fold change of 1.1. Green: Genes increased by inflammation and reversed by CLU. Blue: Genes reduced by inflammation and reversed by CLU. (Log FC: natural logarithm of fold change). e, Dotplot showing Gene Ontology (GO) Biological Processes terms for BEC genes (Benjamini–Hochberg adjustment test, FDR < 0.05) that decrease or increased in APP mice compared to wild types and are reversed by CLU. Genes were selected based on the cutoff fold change of 1.1. f, Venn Diagram showing the number of unique and common genes that are increased by LPS and APP and reversed by CLU and reduced by LPS and APP and reversed by CLU (Extended Data Fig. 8f,g and 9e). g, Heatmap showing the common 20 genes increased with acute (LPS) inflammation and reversed by rCLU treatment (from Extended Data Fig. 8e panel). h, Dot plot showing Gene Ontology (GO) Biological Processes terms for BEC genes (Benjamini–Hochberg adjustment test, FDR < 0.05) of the common genes (from panel f, left) that increased with acute (LPS) and chronic (APP) inflammation and are reversed by Clu treatment. The images in a were generated using MediaLab (https://medialab.biochem.wisc.edu/clip-art/).
Extended Data Fig. 10 |
Extended Data Fig. 10 |. Changes in cortical gene expression in response to LPS inoculation and treatment with CLU.
a. Number of DEGs (Wald test; P < 0.1) between Saline-treated mice (n = 4) and either LPS (n =8) or LPS+rCLU (n = 7) injected animals. b. Venn diagrams depicting the overlap of DEGs (shown in panel a) in whole cortex of mice inoculated with LPS or LPS+rCLU, relative to the Saline-injected controls. c – d. Boxplot representation of scaled expression levels of 200 differentially up- and down-regulated genes under LPS as opposed to Saline controls. Whiskers represent the first and fifth quartiles, box edges represent the second and fourth quartiles and the centre line represents the third quartile/median. Two-sided Wilcoxon rank-sum test. e – f. Representative GO enrichment categories of LPS significantly regulated genes. Lengths of bars represent negative ln-transformed P using two-sided Fisher’s exact test. Colours indicate gene-wise log2 fold-changes (log2(FC)) between (e) LPS and Saline treatment or (f) LPS+rCLU and LPS treatment. Numbers beside bars indicate DEGs induced by LPS in that GO category.
Extended Data Fig. 11 |
Extended Data Fig. 11 |. Changes in plasma proteins of the complement and coagulation pathways in humans and male mice in response to exercise.
Schematic representation of the significantly changed (P < 0.05) plasma proteins of complement and coagulation cascades in humans and mice after exercise. Dotted black arrows indicate relationship between factors of the complement and the coagulation system. The diagram was generated using Servier Medical Art (https://smart.servier.com), MediaLab (https://medialab.biochem.wisc.edu/clip-art/) and Freepik (https://www.freepik.com).
Fig. 1 |
Fig. 1 |. RP induces neuroplasticity, improves cognition and reduces inflammation.
a, Plasma from running male mice was transferred to age- and sex-matched non-running mice. BrdU was administered 3 d before plasma administration and EdU was administered 24 h before euthanasia. The hippocampus was analysed using RNA-seq and immunohistochemistry. i.v., intravenous. b, Representative images of immunolabelled DCX+ cells in the DG of mice that were treated with CP or RP. Scale bars, 100 μm and 50 μm (inset). c, Fold change (FC) in immunolabelled cells per DG. For EdU and DCX, n = 8 (CP), n = 9 (RP); for BrdU, NSPCs, neurons and astrocytes, n = 9 (CP), n = 8 (RP). Data are mean ± s.e.m. Statistical analysis was performed using unpaired Student’s two-tailed t-tests; *P < 0.05, **P < 0.01. d, The percentage of time freezing during the contextual memory test in CP-recipient (n = 20) and RP-recipient (n = 18) mice. Data are mean ± s.e.m. Statistical analysis was performed using unpaired Student’s two-tailed t-tests; *P < 0.05. e, Escape latencies of CP- and RP-infused mice in the Morris water maze test. n = 12 per group. Data are mean ± s.e.m. f, Time spent in the target quadrant (TQ) for CP- and RP-infused mice. n = 12 per group. Data are mean ± s.e.m. Statistical analysis was performed using one-way analysis of variance (ANOVA) and Sidak’s post hoc test; *P < 0.05. N-TQ, non-TQ. g, The time, frequency and latency of CP- and RP-infused mice interacting with the virtual platform. n = 12 per group. Data are mean ± s.e.m. Statistical analysis was performed using unpaired Student’s two-tailed t-tests; **P < 0.01. h, Downregulated (blue) and upregulated (red) genes in the hippocampus of mice injected with CP or RP. The dot size represents the product of log2-transformed fold change and −log10-transformed P values. Statistical analysis was performed using Wald tests; P < 0.05. n = 8 per group. The images in a were generated using MediaLab (https://medialab.biochem.wisc.edu/clip-art/), Servier Medical Art (https://smart.servier.com) and Freepik (https://www.freepik.com).
Fig. 2 |
Fig. 2 |. RP counteracts LPS-induced neuroinflammation.
a, Male mice that were injected with LPS were treated with saline (SAL), RP or CP. An additional control group received SAL for all injections. b, Hippocampal DEGs shown as a correlation of the changes in signed −log10-transformed P values (Wald test, P < 0.05) with LPS (SAL + SAL (n = 8) versus LPS + SAL (n = 8)) and RP treatment (LPS + CP (n = 7) versus LPS + RP (n = 8)). c, Hierarchical networks of the abundance of GO terms (Fisher’s exact test, P < 0.05) related to biological processes using REVIGO (Resnik measurement, 0.7 distance). The GO terms correspond to the DEGs shown in b. Reg., regulation. The images in a were generated using MediaLab (https://medialab.biochem.wisc.edu/clip-art/).
Fig. 3 |
Fig. 3 |. Running alters complement and coagulation proteins.
a, Eight pools of RP or CP (n = 25 male mice per pool) were collected, dialysed and analysed using shotgun LC–MS/MS. b, The downregulated (blue) and upregulated (red) proteins (Student’s two-tailed t-test, P < 0.05) in RP versus CP (n = 8 per group). The dot size represents the product of log2-transformed fold change and − log10-transformed P values. c, Complement and coagulation proteins significantly changed with running. Data are mean ± s.e.m. n = 8 per group. Statistical analysis was performed using unpaired Student’s two-tailed t-tests; *P < 0.05, **P < 0.01, ***P < 0.001, ****P < 0.0001. Conc., concentration. The images in a were generated using Freepik (https://www.freepik.com) and MediaLab (https://medialab.biochem.wisc.edu/clip-art/).
Fig. 4 |
Fig. 4 |. Clusterin reduces hippocampal inflammation.
a, Male mice were injected with LPS and treated with saline (n = 10), RP (mock) (mock, immunodepleted with IgG control antibodies) (n = 10) or RP without CLU (n = 8), or saline for all of the injections (n = 10). qPCR analysis for the effect of each treatment on the indicated genes is shown. Data are mean ± s.e.m. Statistical analysis was performed using one-way ANOVA and Bonferroni post hoc test; NS, not significant; **P < 0.01, ***P < 0.001, ****P < 0.0001. b, Representative hippocampal images of mice injected intravenously with Atto-647N–rCLU (A-647N) or control Atto-647N-PBS. rCLU binds to the cerebrovasculature. n = 3 biological replicates. Scale bars, 10 μm. c, Common 20 genes in hippocampal BECs increased in APP mice and reversed by rCLU treatment. BECs were isolated from n = 4–5 mice per group. d, Relative plasma levels of complement and coagulation proteins in humans before (Before Ex.) and after 6 months of exercise (After Ex.), determined by SOMAscan. n = 20 participants. Data are mean ± s.e.m. Statistical analysis was performed using paired Student’s two-tailed t-tests; *P < 0.05. RFU, relative fluorescence units. The images in a were generated using MediaLab (https://medialab.biochem.wisc.edu/clip-art/).

Comment in

References

    1. Prakash RS, Voss MW, Erickson KI & Kramer AF Physical activity and cognitive vitality. Annu. Rev. Psychol 66, 769–797 (2015). - PubMed
    1. Gleeson M et al. The anti-inflammatory effects of exercise: mechanisms and implications for the prevention and treatment of disease. Nat. Rev. Immunol 11, 607–615 (2011). - PubMed
    1. He XF et al. Voluntary exercise promotes glymphatic clearance of amyloid beta and reduces the activation of astrocytes and microglia in aged mice. Front. Mol. Neurosci 10, 144 (2017). - PMC - PubMed
    1. van Praag H, Christie BR, Sejnowski TJ & Gage FH Running enhances neurogenesis, learning, and long-term potentiation in mice. Proc. Natl Acad. Sci. USA 96, 13427–13431 (1999). - PMC - PubMed
    1. Hawley JA, Hargreaves M, Joyner MJ & Zierath JR Integrative biology of exercise. Cell 159, 738–749 (2014). - PubMed

Publication types