. 2021 Dec;600(7890):759-764.
doi: 10.1038/s41586-021-04175-x. Epub 2021 Dec 8.

Structures of the σ2 receptor enable docking for bioactive ligand discovery

Affiliations

Structures of the σ2 receptor enable docking for bioactive ligand discovery

Assaf Alon et al. Nature. 2021 Dec.

Abstract

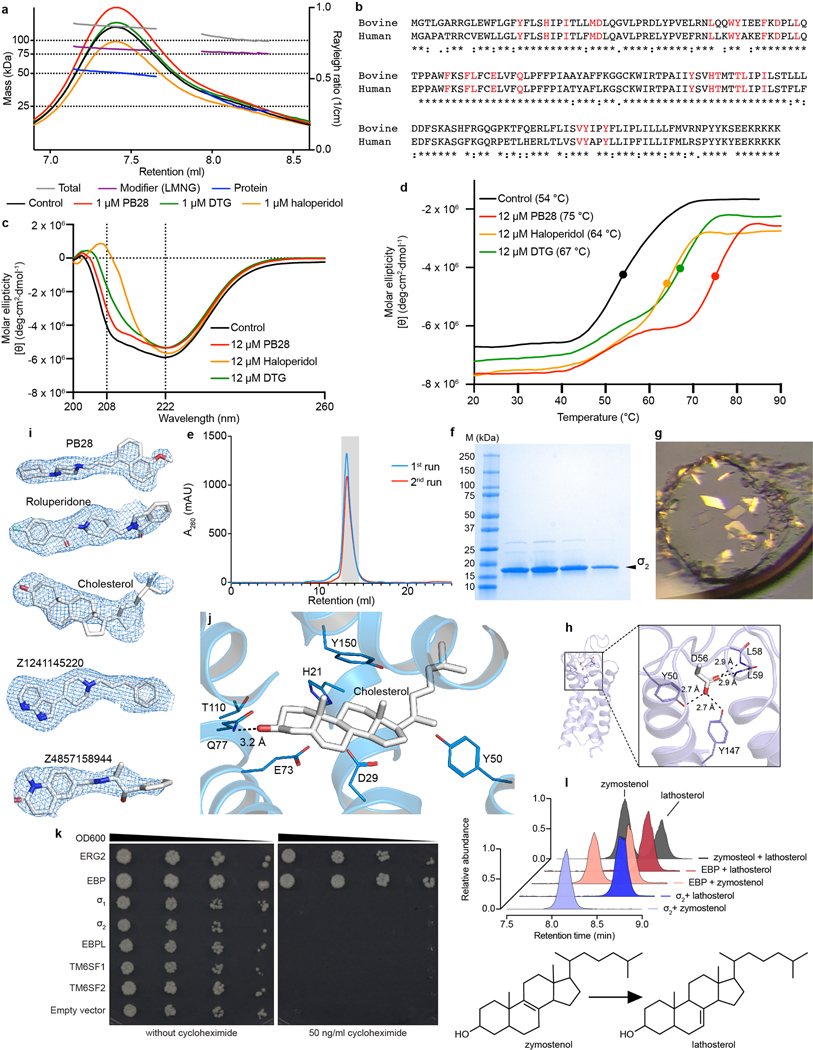
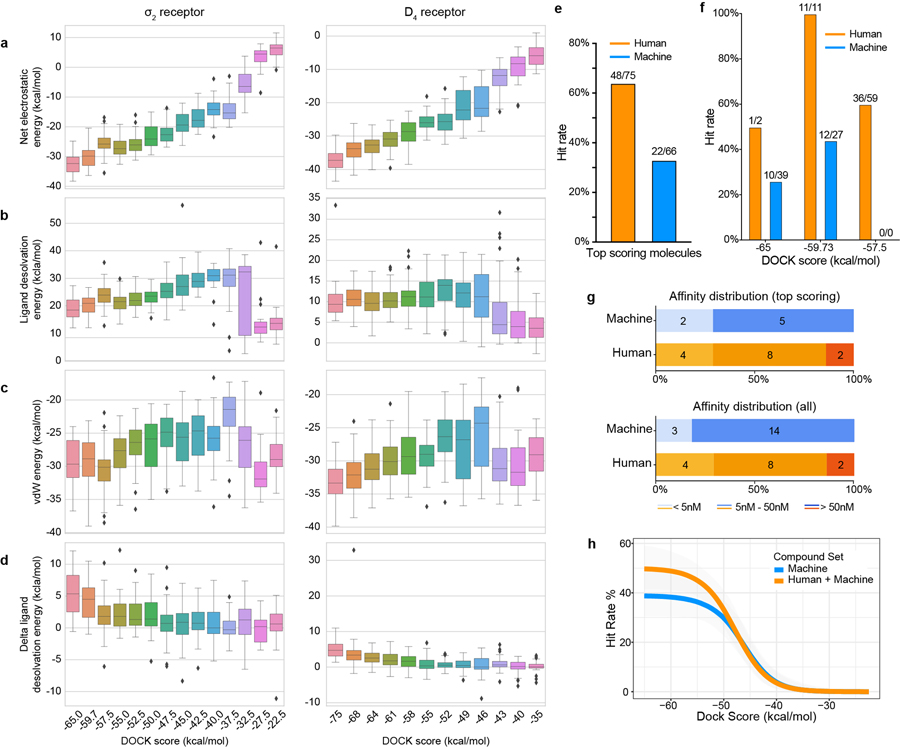
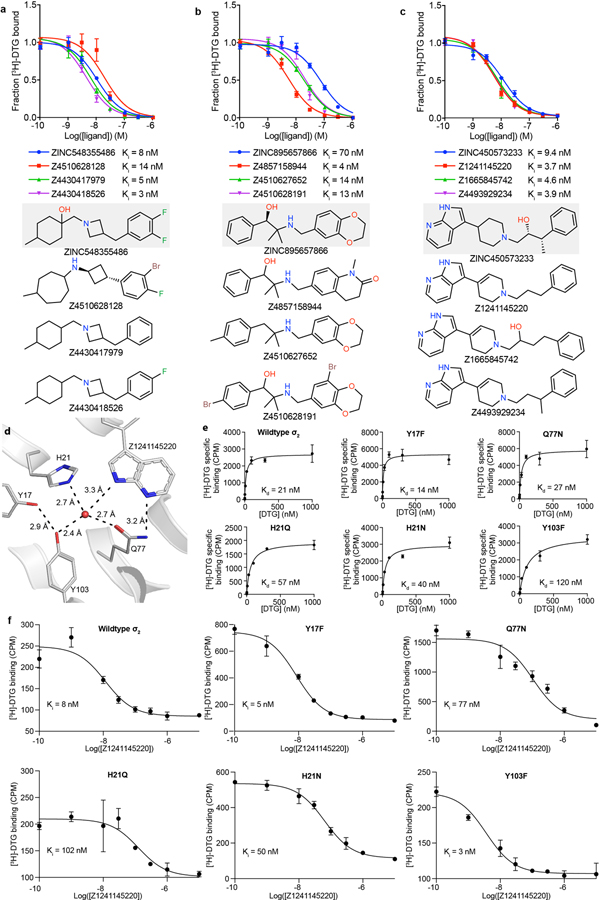
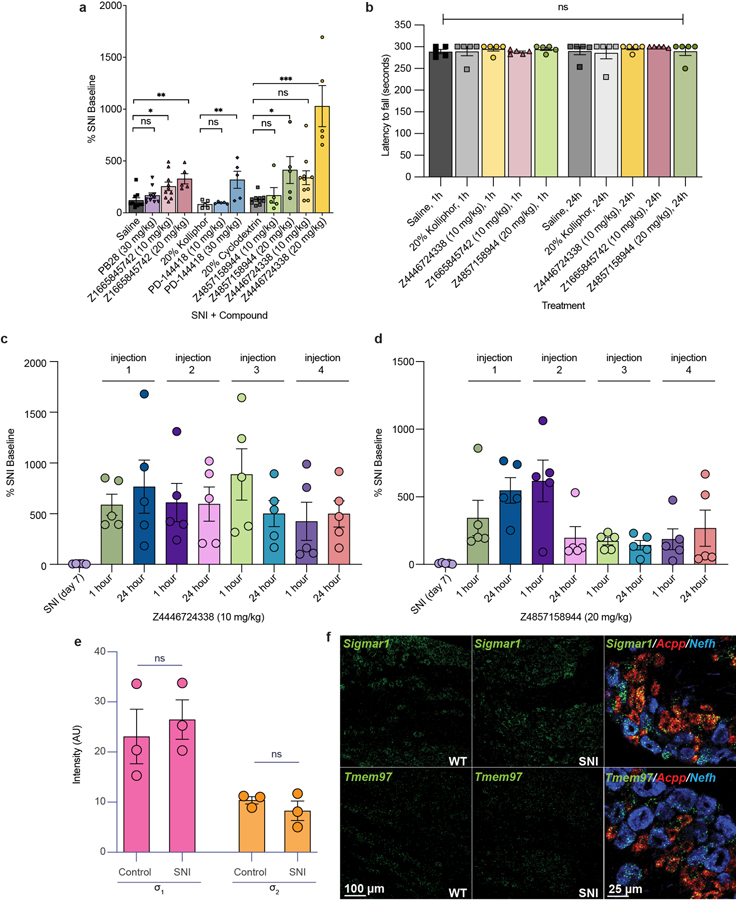
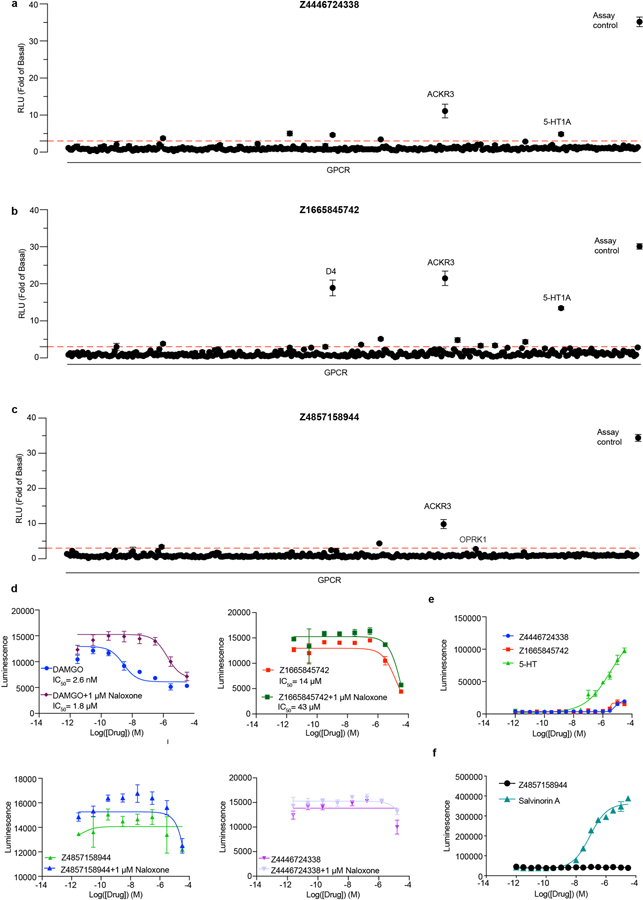
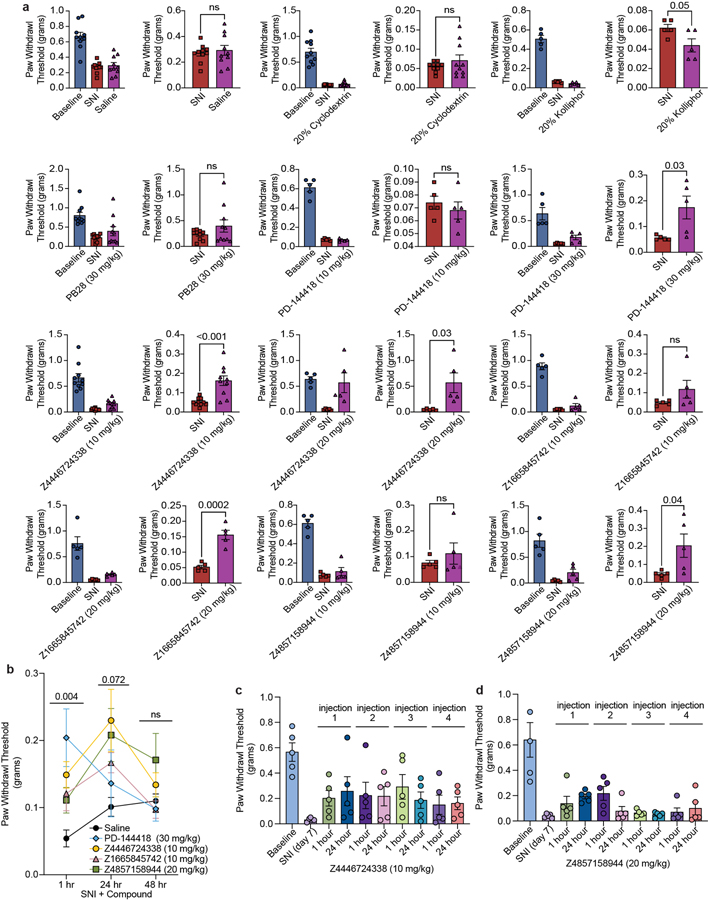
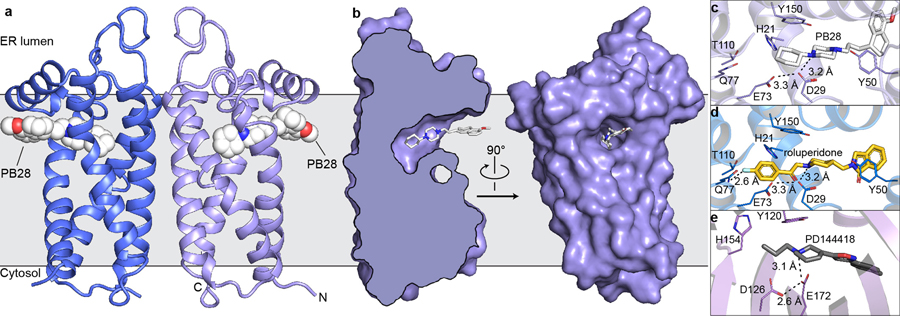
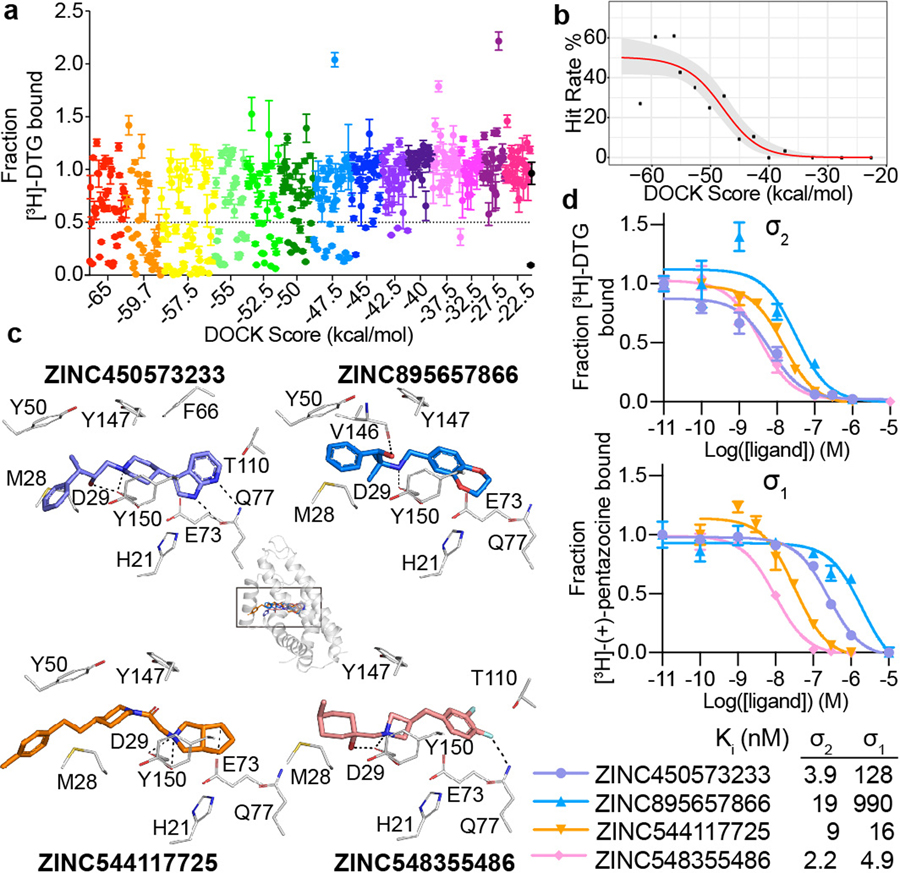
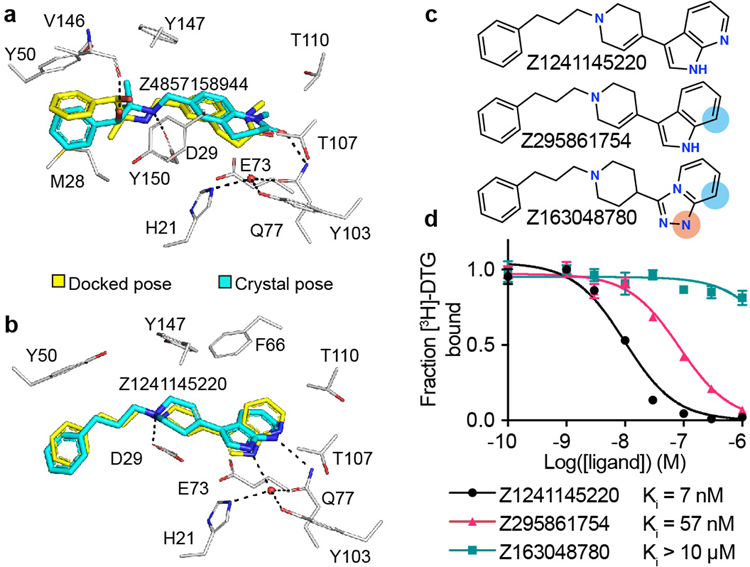
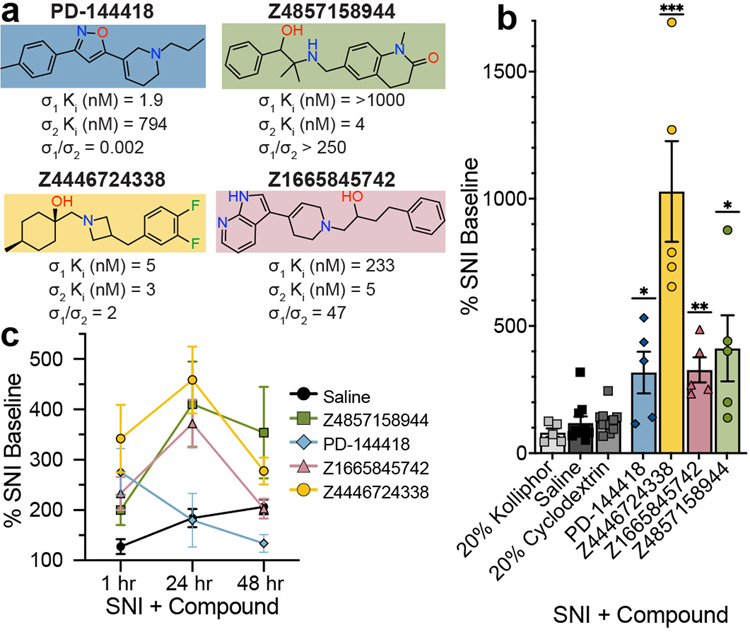
The σ2 receptor has attracted intense interest in cancer imaging1, psychiatric disease2, neuropathic pain3-5 and other areas of biology6,7. Here we determined the crystal structure of this receptor in complex with the clinical candidate roluperidone2 and the tool compound PB288. These structures templated a large-scale docking screen of 490 million virtual molecules, of which 484 compounds were synthesized and tested. We identified 127 new chemotypes with affinities superior to 1 μM, 31 of which had affinities superior to 50 nM. The hit rate fell smoothly and monotonically with docking score. We optimized three hits for potency and selectivity, and achieved affinities that ranged from 3 to 48 nM, with up to 250-fold selectivity versus the σ1 receptor. Crystal structures of two ligands bound to the σ2 receptor confirmed the docked poses. To investigate the contribution of the σ2 receptor in pain, two potent σ2-selective ligands and one potent σ12 non-selective ligand were tested for efficacy in a mouse model of neuropathic pain. All three ligands showed time-dependent decreases in mechanical hypersensitivity in the spared nerve injury model9, suggesting that the σ2 receptor has a role in nociception. This study illustrates the opportunities for rapid discovery of in vivo probes through structure-based screens of ultra large libraries, enabling study of underexplored areas of biology.


Figures

Extended Data Figure 1 |
Extended Data Figure 1 |. Characterization of σ2 receptor.
a, Size-exclusion chromatography with multi-angle light scattering of the human σ2 receptor. The σ2 receptor was run either without ligand or with 1 μM of the indicated ligand. Lines indicate calculated total mass (gray), detergent micelle (blue), and protein (purple). b, Sequence alignment between the human and bovine σ2 protein sequences performed using T-coffee. Residues that line the binding pocket are marked in red. c, Circular dichroism analysis of the bovine σ2 receptor alone (black) or with the indicated ligand. Data is representative of multiple experiments. d, Circular dichroism melting curves of the bovine σ2 receptor. Temperature was raised from 20 °C to 90 °C and molar ellipticity was measured at 222 nm. Protein was incubated either with or without indicated ligand at 12 μM. Melting temperatures for each measurement are indicated with a circle. Data is representative of multiple experiments e, Size-exclusion chromatography (SEC) of the bovine σ2 receptor. Blue trace is after proteolytic tag removal. Red trace is protein applied on size exclusion after reapplying the tag-free protein on affinity resin to remove proteins with intact tags. The trace presented is representative of multiple purifications. f, Analysis of receptor purity after the second SEC using SDS-PAGE. Gray rectangle in e represents fractions chosen for analysis. The SDS-PAGE presented here is representative of multiple purifications. See Source Data for uncropped version. g, Crystals of bovine σ2 receptor in the lipidic cubic phase. h, Aspartate 56 (D56) is important for receptor structure but not for ligand binding. A tight network of hydrogen bonds that bridges extracellular loop 1 to TM helix 4 is depicted with black dashed lines. i, Electron density maps for the various ligands. Polder maps were calculated in Phenix. Maps are contoured at a level of 3 σ. j, View of cholesterol binding pose, showing contacts with other binding pocket residues. Hydrogen bonds are marked with black dashed lines. k, Yeast complementation assay. A ΔERG2 yeast strain was transformed with plasmids harboring the indicated genes. Yeast cells were grown to logarithmic phase and diluted to OD600 of 0.1, and then further diluted in a five-fold serial dilution series. Two microliters of each dilution were spotted on plates. Yeast cells were grown either in permissive conditions of no cycloheximide or in the restrictive conditions of 50 ng/ml cycloheximide, which requires functional Δ8–9 sterol isomerase activity for viability. ERG2 and EBP can act as sterol isomerases and rescue the growth of ΔERG2 Saccharomyces cerevisiae while the σ2 receptor, the σ1 receptor, or any other member of the EXPERA family cannot. l, EBP can catalyze the conversion of zymostenol to lathosterol while σ2 cannot. Standards are in dark gray. EBP converts zymostenol to lathosterol (apricot) but does not convert lathosterol to zymostenol (dark red). The σ2 receptor does not convert lathosterol to zymostenol (dark blue) or zymostenol to lathosterol (light purple). Structures of zymostenol and lathosterol are depicted below the traces.
Extended Data Figure 2 |
Extended Data Figure 2 |. Comparisons of the distribution of docking scores.
a-d, The distribution of docking scores of tested molecules for hit rate curves against σ2 (left column) and D4 (right column) receptors. All tested molecules are grouped based on docking score bins. The distributions are shown in box plots for a, net electrostatic energy, b, ligand desolvation energy, c, van der Waals (vdW) energy and d, delta ligand desolvation energy after recalculating atomic desolvation energy based on the docked pose. e-h, Comparison of hit rates and affinities achieved by combined docking score and human inspection and these achieved by docking score alone. e, Overall hit rates for selecting compounds from the first 3 scoring bins by each strategy: human prioritization and docking score (orange), or docking score alone (blue). Hit rate is the ratio of active compounds/tested compounds; the raw numbers appear at the top of each bar. f, Hit rates for selecting compounds at different scoring ranges by each strategy: human prioritization and docking score (orange) or docking score alone (blue). g, Distribution of the binding affinity level among the hits from e (top panel). We measured competition binding curves for 14 docking hits from human prioritization and docking score, and 7 hits from the docking score alone. These are divided into three affinity ranges: <5 nM; 5 nM–50 nM; >50 nM; Distribution of the binding affinity level among the hits from all different scoring ranges (bottom panel). We measured competition binding curves for 14 docking hits from human prioritization and docking score, and 17 hits from the docking score alone. h. Hit-rate curve comparison with/without human picks. The hit rate without human picks at the top plateau is 39% and at the bottom plateau is 0%, and the docking score (dock50) and slope at the maximum (slope50) are −46.5 kcal mol−1 and −3.5% per kcal mol−1, respectively.
Extended Data Figure 3 |
Extended Data Figure 3 |. Analogs of σ2 receptor ligands and the effect of a structural water molecule.
a-c, Initial hits and selected analogs of σ2 receptor ligands. Competition binding curves on the top panel, 2D drawings of compounds are on the bottom panel. Parent compound is indicated by gray background. Points shown as mean ± SEM from three technical replicates. a, Parent compound ZINC548355486 and its three potent analogues. b, Parent compound ZINC895657866 and its three potent analogues. c, Parent compound ZINC450573233 and its three potent analogues. d-f, The binding site of the σ2 receptor contains a structural water. d, Water coordination at the binding site of the σ2 receptor. Water molecule is depicted as a red sphere. Hydrogen bonds are indicated by black dashed lines. e, Saturation binding curve to measure the dissociation constant (Kd) of [3H]-DTG for the various mutants of σ2 receptor meant to disrupt water coordination. Residues proximal to the structural water were chosen for mutation. Residues were mutated to the indicated amino acid. Points shown as mean ± SEM from three technical replicates. f, Competition binding measurement of affinity of Z1241145220 in various mutants of σ2. Points shown as mean ± SEM from three technical replicates.
Extended Data Figure 4 |
Extended Data Figure 4 |. Effect of systemic σ receptor ligands on motor behavior.
a, Response of mice to a von Frey filament after spared nerve injury (SNI). All five ligands are compared to their respective vehicles (PD-144418 10 mg/kg (n = 5) and 30 mg/kg (n = 5) vs. kolliphor (n = 5), one-way ANOVA, F(2, 12) = 7.49, p = 0.008; Z4446724338 10 mg/kg (n = 10) and 20 mg/kg (n = 5) vs cyclodextrin (n = 10), one-way ANOVA, F(2, 22) = 25.12, p < 0.001; Z4857158944 10 mg/kg (n = 5) and 20 mg/kg (n = 5) vs cyclodextrin (n = 10), one-way ANOVA, F(2, 17) = 5.10, p = 0.02; Z1665845742 10 mg/kg (n = 10) and 20 mg/kg (n = 5) and PB28 30 mg/kg (n = 10) vs saline (n = 10), one-way ANOVA, F(3, 31) = 6.18, p = 0.002; asterisks define individual group differences to respective vehicle control using Dunnett’s multiple comparisons Post-hoc test; ns = not significant, * p < 0.05, ** p < 0.01, *** p < 0.001). Data shown are mean ± SEM. Data for higher doses and vehicles is replotted from Fig. 4. b, No sedation or motor impairment on the rotarod was observed after drug treatments compared to vehicle at 1 hour (Z1665845742 10 mg/kg (n = 5) and Z4857158944 20 mg/kg (n = 5) vs saline (n = 5), one-way ANOVA, F(2, 12) = 1.04, p = 0.38; Z4446724338 10 mg/kg (n = 5) vs kolliphor (n = 5), unpaired two-tailed Student’s t-test, t(8) = 0.47, p = 0.65) or 24 hours post-injection (Z1665845742 10 mg/kg (n = 5) and Z4857158944 20 mg/kg (n = 5) vs saline (n = 5), one-way ANOVA, F(2, 12) = 0.45, p = 0.65; Z4446724338 10 mg/kg (n = 5) vs kolliphor (n = 5), unpaired two-tailed Student’s t-test, t(8) = 0.72, p = 0.49); ns = not significant. Data shown are means ± SEM. c, Response of SNI mice to a von Frey filament after repeated injections of Z4446724338 10 mg/kg (n = 5). Mechanical thresholds were assessed 1 hour and 24 hours after four separate injections. Data shown are means ± SEM normalized to each mouse’s SNI baseline. d, Response of SNI mice to a von Frey filament after repeated injections of Z4857158944 10 mg/kg (n = 5). Mechanical thresholds were assessed 1 hour and 24 hours after four separate injections. Data shown are means ± SEM normalized to each mouse’s SNI baseline. e. Quantification of the expression levels of Sigmar1 (σ1) and Tmem97 (σ2) in wildtype (WT) and SNI mice detected by in situ hybridization (n = 3 mice per group). Representative images can be found in panel f. Data shown are mean ± SEM; unpaired two-tailed Student’s t-test— Sigmar1: t(4) = 0.5, p = 0.64; Tmem97: t(4) = 1.0, p = 0.37; ns = not significant. AU = arbitrary units. f, in situ hybridization of mouse dorsal root ganglion (DRG) sections for Sigmar11) and Tmem972) genes illustrates expression in myelinated (Nefh-positive; blue) and unmyelinated (Acpp-positive; red) subsets of sensory neurons and no change after SNI.
Extended Data Figure 5 |
Extended Data Figure 5 |. Off-target profiling of Z4446724338, Z1665845742, and Z4857158944.
a-c, TANGO screens against a panel of 320 GPCRs for the indicated σ2 ligand. a, Z4446724338, b, Z1665845742, c, Z4857158944. d, GloSensor μOR-mediated cAMP inhibition (Gi activation) by DAMGO, Z4446724338, Z1665845742, and Z4857158944. e-f, Follow-up does-response curves for pain-related receptors that showed activation in a-c. e, Z4446724338 and Z1665845742 against 5HT1A. f, Z4857158944 against κOR. Data shown are means ± SEM.
Extended Data Figure 6 |
Extended Data Figure 6 |. Paw withdrawal thresholds and in situ intensity measurements.
a, Paw withdrawal thresholds (PWT) before (blue bar) and after (red bar) spared nerve injury (SNI), as well as after SNI + treatment (purple bar). For easier visualization of individual data points, data was also plotted without the pre-SNI baseline. Data are the same as in Figure 4b and Extended Data Figure 4a, but without the normalization to the individual post-SNI baselines and are expressed as mean ± SEM; mice per group: saline (n = 10); cyclodextrin (n = 10); kolliphor (n = 5); PB28 30 mg/kg (n = 10); PD-144418 10 mg/kg (n = 5) and 30 mg/kg (n = 5); Z4446724338 10 mg/kg (n = 10) and 20 mg/kg (n = 5); Z1665845742 10 mg/kg (n = 5) and 20 mg/kg (n = 5); Z4857158944 10 mg/kg (n = 5) and 20 mg/kg (n = 5); unpaired two-tailed Student’s t-test. b, PWTs 1 hour, 24 hours, and 48 hours after saline or drug treatment. Data are the same as in Figure 4c, but without the normalization to the individual post-SNI baselines, and are expressed as mean ± SEM. Significance levels determined using Dunnett’s multiple comparisons Post-hoc test reflect the difference between Z4446724338 and saline for simplicity (two-way ANOVA; time × treatment interaction: F(8, 80) = 2.4, p = 0.02; time: F(2, 74) = 5.2, p = 0.009; treatment: F(4, 40) = 3.3, p = 0.02; four treatment groups (n = 10) except PD-144418 (n = 5); ns = not significant. c, Response of SNI mice to a von Frey filament after repeated injections of Z4446724338 10 mg/kg (n = 5). Mechanical thresholds were assessed 1 hour and 24 hours after four separate injections. Data shown are paw withdrawal thresholds in grams, expressed as mean ± SEM. d, Response of SNI mice to a von Frey filament after repeated injections of Z4857158944 10 mg/kg (n = 5). Mechanical thresholds were assessed 1 hour and 24 hours after four separate injections. Data shown are paw withdrawal thresholds in grams, expressed as mean ± SEM.
Figure 1 |
Figure 1 |. Structure of the σ2 receptor and binding site ligand recognition.
a, Structure of the σ2 receptor bound to PB28. Amino- and carboxy-termini are indicated. Membrane boundaries were calculated using the PPM server. b, Cross-section of the σ2 receptor binding pocket (left) and view of the entrance to the binding pocket from the membrane (right). c, View of PB28 binding pose, showing charge–charge interaction with Asp29 (black dotted line) and contacts with other binding pocket residues. d, Analogous structure of the roluperidone binding pose. e, Structure of the σ1 receptor bound to PD144418 (PDB ID: 5HK1). Amino acids that serve similar roles and positioned in a similar orientation to amino acids in the σ2 receptor are indicated.
Figure 2 |
Figure 2 |. Docking 490 million molecules against the σ2 receptor.
a, Displacement of the radioligand [3H]-DTG by each of the 484 molecules tested at 1 μM (mean ± SEM of three technical replicates). The molecules are colored and grouped by docking score. Dashed line indicates 50% radioligand displacement. Dots below the dashed line represent confirmed binders, whose numbers diminish with worsening docking score. b, The hit-rate of 484 experimentally tested compounds was plotted against docking energy. The docking score (dock50) and slope at the maximum (slope50) are −48 kcal mol−1 and −4.2% per kcal mol−1, respectively. The gray band represents the 95% credible interval. c, Docked poses of four representative ligands from different scaffolds. d, Competition binding curves of the four molecules in c. against the σ2 receptor (upper panel) and the σ1 receptor (lower panel). The data are the mean ± SEM from three technical replicates.
Figure 3 |
Figure 3 |. High structural fidelity between docked and crystallographic poses of novel σ2 receptor ligands.
Ligand crystal poses (carbons in cyan) overlaid with respective docked poses (yellow). σ2 receptor carbons are in grey, oxygens in red, nitrogens in blue, sulfurs in yellow, hydrogen bonds are shown as black dashed lines. a, Z4857158944-bound complex (PDB ID: 7M96; RMSD = 1.4 Å). b, Z1241145220-bound complex (PDB ID: 7M95; RMSD = 0.88 Å). c, Two Z1241145220 analogues that disrupt the hydrogen bonds with Gln77 and the structural water. Blue and apricot circles depict differences between the analogues and the parent compound. d, Competition binding curve of compounds from c. The data are the mean ± SEM from three technical replicates.
Figure 4 |
Figure 4 |. σ1/2 ligands are anti-allodynic in a model of neuropathic pain.
a, Selectivity of four ligands at σ1 and σ2. PD-144418 values from the litrature. b, Response of mice to a von Frey filament after spared nerve injury (SNI). Ligands are compared to their vehicles (PD-144418 30 mg/kg (n = 5) vs. kolliphor (n = 5), one-way ANOVA, F(2, 12) = 7.49, p = 0.008; Z4446724338 20 mg/kg (n = 5) vs cyclodextrin (n = 10), one-way ANOVA, F(2, 22) = 25.12, p = 0.0000021; Z4857158944 20 mg/kg (n = 5) vs cyclodextrin (n = 10), one-way ANOVA, F(2, 17) = 5.10, p = 0.02; Z1665845742 20 mg/kg (n = 5) vs saline (n = 10), one-way ANOVA, F(3, 31) = 6.18, p = 0.002; asterisks define individual group differences to respective vehicle control using Dunnett’s multiple comparisons Post-hoc test; kolliphor vs. PD-144418 30 mg/kg (p = 0.009); cyclodextrin vs. Z4446724338 20 mg/kg (p < 0.001); cyclodextrin vs. Z4857158944 20 mg/kg (p = 0.01); saline vs. Z1665845742 20 mg/kg (p = 0.002); * p < 0.05, ** p < 0.01, *** p < 0.001). Data shown are mean ± SEM. Also see Extended Data Fig. 4a. c, The anti-allodynic effects of σ2, but not σ1, ligands peak at 24 hours post-injection (two-way ANOVA; time × treatment interaction: F(8,80) = 2.25, p = 0.03; time: F(2,76) = 5.09, p = 0.009; treatment: F(4,40) = 5.40, p = 0.001; four treatment groups (n = 10) except PD-144418 (n = 5); asterisks define difference between Z4446724338 and saline at 1 hr (p = 0.03), 24 hr (p = 0.008), and 48 hr (p = 0.11) for simplicity; ns = not significant, * p < 0.05, ** p < 0.01). Data shown are mean ± SEM.

References

    1. Waarde A van et al. Potential applications for sigma receptor ligands in cancer diagnosis and therapy. Biochimica Et Biophysica Acta Bba - Biomembr 1848, 2703–2714 (2015). - PubMed
    1. Harvey PD et al. Effects of Roluperidone (MIN-101) on two dimensions of the negative symptoms factor score: Reduced emotional experience and reduced emotional expression. Schizophr Res 215, 352–356 (2020). - PubMed
    1. Sahn JJ, Mejia GL, Ray PR, Martin SF & Price TJ Sigma 2 Receptor/Tmem97 Agonists Produce Long Lasting Antineuropathic Pain Effects in Mice. Acs Chem Neurosci 8, 1801–1811 (2017). - PMC - PubMed
    1. Intagliata S et al. Discovery of a Highly Selective Sigma-2 Receptor Ligand, 1-(4-(6,7-Dimethoxy-3,4-dihydroisoquinolin-2(1H)-yl)butyl)-3-methyl-1H-benzo[d]imidazol-2(3H)-one (CM398), with Drug-Like Properties and Antinociceptive Effects In Vivo. Aaps J 22, 94 (2020). - PubMed
    1. Quadir SG et al. The Sigma-2 receptor / transmembrane protein 97 (σ2R/TMEM97) modulator JVW-1034 reduces heavy alcohol drinking and associated pain states in male mice. Neuropharmacology 184, 108409 (2021). - PMC - PubMed

LinkOut - more resources