. 2021 Dec;600(7890):695-700.
doi: 10.1038/s41586-021-04198-4. Epub 2021 Dec 8.

Unrepresentative big surveys significantly overestimated US vaccine uptake

Affiliations

Unrepresentative big surveys significantly overestimated US vaccine uptake

Valerie C Bradley et al. Nature. 2021 Dec.

Abstract

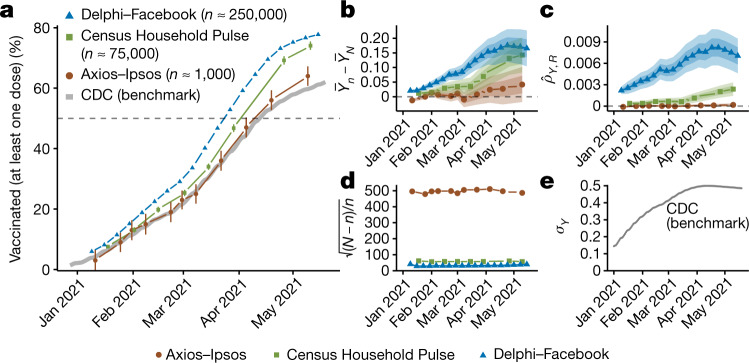
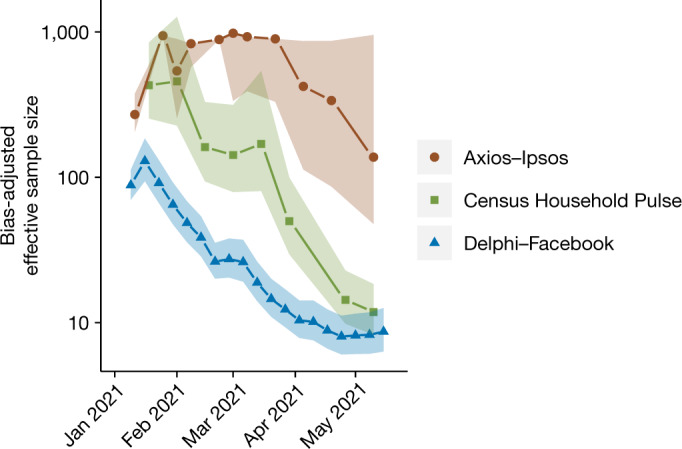
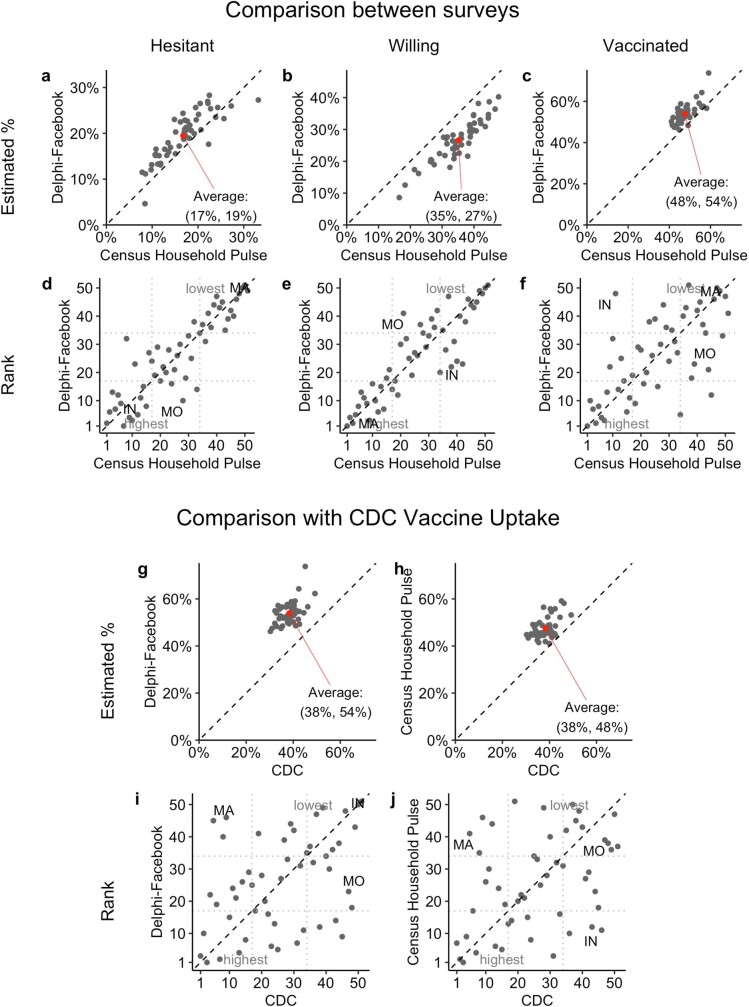
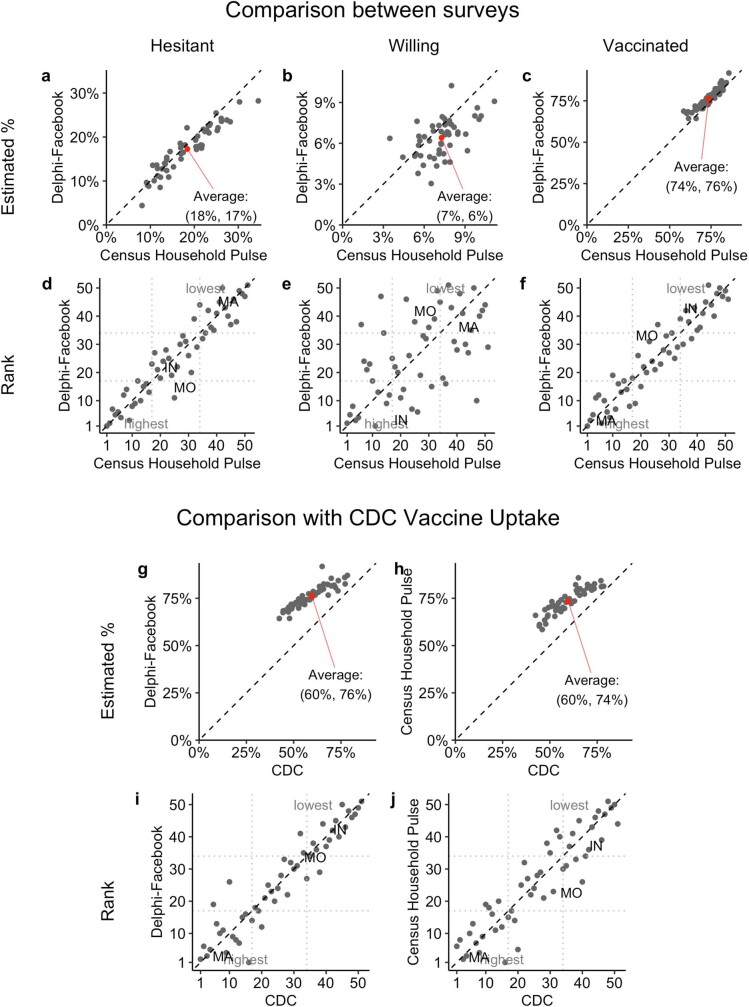
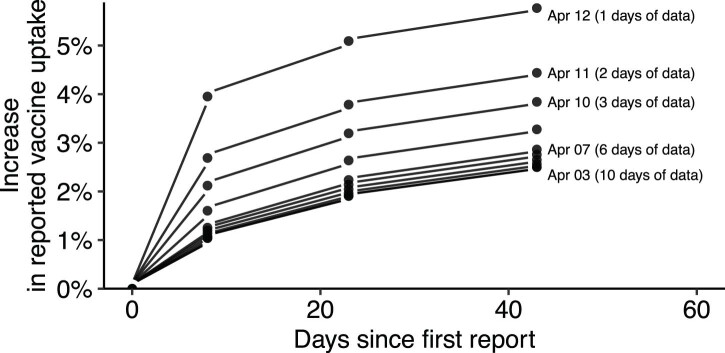
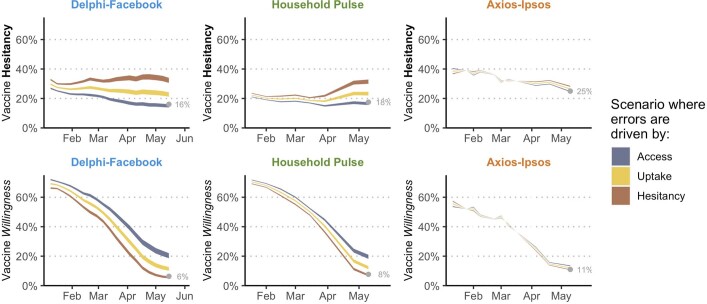
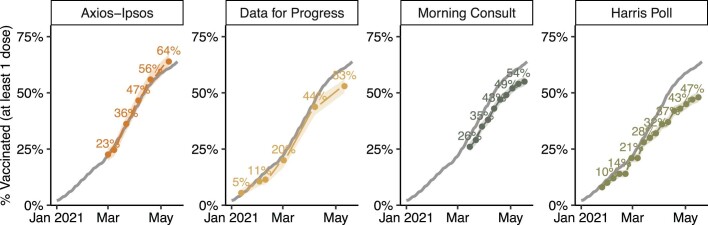
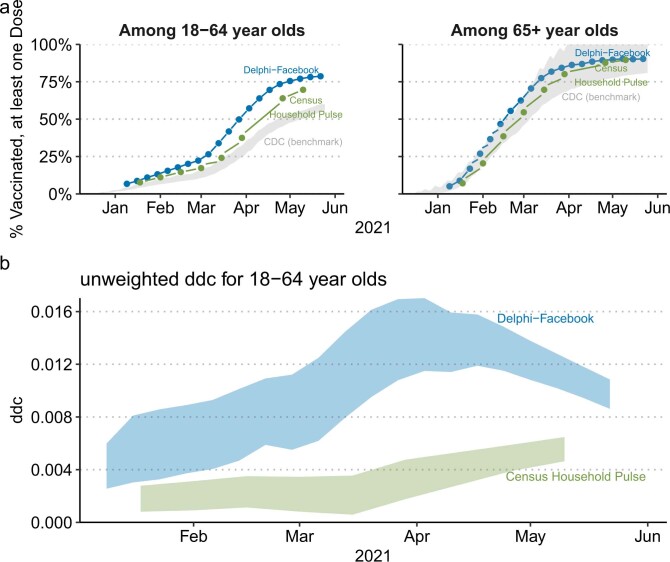
Surveys are a crucial tool for understanding public opinion and behaviour, and their accuracy depends on maintaining statistical representativeness of their target populations by minimizing biases from all sources. Increasing data size shrinks confidence intervals but magnifies the effect of survey bias: an instance of the Big Data Paradox1. Here we demonstrate this paradox in estimates of first-dose COVID-19 vaccine uptake in US adults from 9 January to 19 May 2021 from two large surveys: Delphi-Facebook2,3 (about 250,000 responses per week) and Census Household Pulse4 (about 75,000 every two weeks). In May 2021, Delphi-Facebook overestimated uptake by 17 percentage points (14-20 percentage points with 5% benchmark imprecision) and Census Household Pulse by 14 (11-17 percentage points with 5% benchmark imprecision), compared to a retroactively updated benchmark the Centers for Disease Control and Prevention published on 26 May 2021. Moreover, their large sample sizes led to miniscule margins of error on the incorrect estimates. By contrast, an Axios-Ipsos online panel5 with about 1,000 responses per week following survey research best practices6 provided reliable estimates and uncertainty quantification. We decompose observed error using a recent analytic framework1 to explain the inaccuracy in the three surveys. We then analyse the implications for vaccine hesitancy and willingness. We show how a survey of 250,000 respondents can produce an estimate of the population mean that is no more accurate than an estimate from a simple random sample of size 10. Our central message is that data quality matters more than data quantity, and that compensating the former with the latter is a mathematically provable losing proposition.


Conflict of interest statement

The authors declare no competing interests.

Figures

Fig 1
Fig 1. Errors in estimates of vaccine uptake.
a, Estimates of vaccine uptake for US adults in 2021 compared to CDC benchmark data, plotted by the end date of each survey wave. Points indicate each study’s weighted estimate of first-dose vaccine uptake, and intervals are 95% confidence intervals using reported standard errors and design effects. Delphi–Facebook has n = 4,525,633 across 19 waves, Census Household Pulse has n = 606,615 across 8 waves and Axios–Ipsos has n = 11,421 across 11 waves. Delphi–Facebook’s confidence intervals are too small to be visible. b, Total error Y¯nY¯N. c, Data defect correlation ρˆY,R. d, Data scarcity (Nn)/n. e, Inherent problem difficulty σY. Shaded bands represent scenarios of ±5% (darker) and ±10% (lighter) imprecision in the CDC benchmark relative to reported values (points). be comprise the decomposition in equation (1).
Fig 2
Fig 2. Bias-adjusted effective sample size.
An estimate’s bias-adjusted effective sample size (different from the classic Kish effective sample size) is the size of a simple random sample that would have the same MSE as the observed estimate. Effective sample sizes are shown here on the log10 scale. The original sample size was n = 4,525,633 across 19 waves for Delphi–Facebook, n = 606,615 across 8 waves for Census Household Pulse and n = 11,421 across 11 waves for Axios–Ipsos. Shaded bands represent scenarios of ±5% benchmark imprecision in the CDC benchmark.
Extended Data Fig. 1
Extended Data Fig. 1. Comparisons of state-level vaccine uptake, hesitancy and willingness across surveys and the CDC for March 2021.
Comparison of Delphi-Facebook and Census Household Pulse’s state-level point estimates (ac) and rankings (df) for vaccine hesitancy, willingness and uptake Dotted black lines show agreement and red points show the average of 50 states. During our study period, the CDC published daily reports of the cumulative number of vaccinations by state that had occurred up to a certain date. Due to reporting delays, these may be an underestimate, but retroactively updated data was not available to us. gj compare state-level point estimates and rankings for the same survey waves to CDC benchmark estimates from 31 March 2021. The Delphi–Facebook data are from the week ending 27 March 2021 and the Census Household Pulse is the wave ending 29 March 2021. See Extended Data Fig. 3 for details on the degree of retroactive updates we could expect, and Supplementary Information A.2 for details.
Extended Data Fig. 2
Extended Data Fig. 2. Comparisons of state-level vaccine uptake, hesitancy and willingness across surveys and the CDC for May 2021.
Comparison of Delphi-Facebook and Census Household Pulse’s state-level point estimates (ac) and rankings (df) for vaccine hesitancy, willingness and uptake. Dotted black lines show agreement and red points show the average of 50 states. During our study period, the CDC published daily reports of the cumulative number of vaccinations by state that had occurred up to a certain date. Due to reporting delays, these may be an underestimate, but retroactively updated data was not available to us. gj compare state-level point estimates and rankings for the same survey waves to CDC benchmark estimates from 15 May 2021. The Delphi–Facebook data are from the wave week ending 8 May 2021 and the Census Household Pulse is the wave ending 10 May 2021. See Extended Data Fig. 3 for details on the degree of retroactive updates we could expect, and Supplementary Information A.2 for details.
Extended Data Fig. 3
Extended Data Fig. 3. Retroactive adjustment of CDC vaccine uptake figures for 3–12 April 2021, over the 45 days from 12 April.
Increase is shown as a percentage of the vaccine uptake reported on 12 April. Most of the retroactive increases in reported estimates appear to occur in the first 10 days after an estimate is first reported. By about 40 days after the initial estimates for a particular day are reported, the upward adjustment plateaus at around 5–6% of the initial estimate. We use this analysis to guide the choice of 5% and 10% threshold for the possible imprecision in the CDC benchmark when computing Benchmark Imprecision (BI) intervals.
Extended Data Fig. 4
Extended Data Fig. 4. Revised estimates of hesitancy and willingness after accounting for survey errors for vaccination uptake.
The grey point shows the reported value at the last point of the time series. Each line shows a different scenario for what might be driving the error in uptake estimate, derived using hypothetical ddc values for willingness and hesitancy based on the observed ddc value for uptake. Access scenario: willingness suffers from at least as much, if not more, bias than uptake. Hesitancy scenario: hesitancy suffers from at least as much, if not more, bias than uptake. Uptake scenario: the error is split roughly equally between hesitancy and willingness. See Supplementary Information D for more details.
Extended Data Fig. 5
Extended Data Fig. 5. Vaccination rates compared with CDC benchmark for four online polls.
Ribbons indicate traditional 95% confidence intervals, which are twice the standard error reported by the poll. Grey line is the CDC benchmark. Data for Progress asks “As of today, have you been vaccinated for Covid-19?”; Morning Consult asks “Have you gotten the vaccine, or not?”; Harris Poll asks “Which of the following best describes your mindset when it comes to getting the COVID-19 vaccine when it becomes available to you?”. YouGov surveys are not analysed because they explicitly examined how their surveys tracked CDC vaccine uptake. See Supplementary Information C.3 for the sampling methodology of each survey and discussion of differences.
Extended Data Fig. 6
Extended Data Fig. 6. Survey error by age group (18–64-year-olds, and those aged 65 and over).
a, Estimates of vaccine uptake from Delphi–Facebook (blue) and Census Household Pulse (green) for 18–64-year-olds (left) and those aged 65 or older (right). Bounds on the CDC’s estimate of vaccine uptake for those groups are shown in grey. The CDC receives vaccination-by-age data only from some jurisdictions. We do know, however, the total number of vaccinations in the US. Therefore, we calculate the bounds by allocating all the vaccine doses for which age is unknown to either 18–64 or 65+. b, Unweighted ddc for each Delphi–Facebook and Census Household Pulse calculated for the 18–64 group using the bounds on the CDC’s estimates of uptake. ddc for 65+ is not shown due to large uncertainty in the bounded CDC estimates of uptake.

Comment in

  • What surveys really say.
    Kreuter F. Kreuter F. Nature. 2021 Dec;600(7890):614-615. doi: 10.1038/d41586-021-03604-1. Nature. 2021. PMID: 34880485 No abstract available.

Similar articles

Cited by

References

    1. Meng X-L. Statistical paradises and paradoxes in big data (I): Law of large populations, big data paradox, and the 2016 US presidential election. Ann. Appl. Stat. 2018;12:685–726. doi: 10.1214/18-AOAS1161SF. - DOI
    1. Barkay, N. et al. Weights and methodology brief for the COVID-19 Symptom Survey by University of Maryland and Carnegie Mellon University, in partnership with Facebook. Preprint at https://arxiv.org/abs/2009.14675 (2020).
    1. Kreuter F, et al. Partnering with Facebook on a university-based rapid turn-around global survey. Surv. Res. Methods. 2020;14:159–163.
    1. Fields, J. F. et al. Design and Operation of the 2020 Household Pulse Survey (U.S. Census Bureau, 2020).
    1. Jackson, C., Newall, M. & Yi, J. Axios Ipsos Coronavirus Index (2021).

Publication types

Substances